| Param | Original file | Final file |
|---|---|---|
| Filename | modeM0/AS1A09_138T04_9000005282_37121cztM0_level2.evt | modeM0/AS1A09_138T04_9000005282_37121cztM0_level2_quad_clean.evt |
| Size (bytes) | 499,996,800 | 84,916,800 |
| Size | 476.8 MB | 81.0 MB |
| Events in quadrant A | 3,330,525 | 546,745 |
| Events in quadrant B | 4,006,946 | 554,671 |
| Events in quadrant C | 3,215,835 | 547,313 |
| Events in quadrant D | 4,183,561 | 505,141 |
| Mode SS | |||
|---|---|---|---|
| Quadrant | BADHDUFLAG | Total packets | Discarded packets |
| A | 0 | 122 | 0 |
| B | 0 | 122 | 0 |
| C | 0 | 122 | 0 |
| D | 0 | 122 | 0 |
| Mode M0 | |||
|---|---|---|---|
| Quadrant | BADHDUFLAG | Total packets | Discarded packets |
| A | 0 | 13753 | 3 |
| B | 0 | 15964 | 2 |
| C | 0 | 13156 | 2 |
| D | 0 | 16498 | 2 |
| Mode M9 | |||
|---|---|---|---|
| Quadrant | BADHDUFLAG | Total packets | Discarded packets |
| A | 0 | 24 | 0 |
| B | 0 | 24 | 0 |
| C | 0 | 24 | 0 |
| D | 0 | 25 | 0 |
| Quadrant | Total seconds | Saturated seconds | Saturation percentage |
|---|---|---|---|
| A | 5972 | 174 | 2.913597% |
| B | 5972 | 443 | 7.417950% |
| C | 5972 | 71 | 1.188881% |
| D | 5972 | 423 | 7.083054% |
Noise dominated data is calculated using 1-second bins in cleaned event files. If a bin has >2000 counts, and if more than 50% of those come from <1% of pixels, then it is considered to be noise-dominated and hence unusable.
| Quadrant | # 1 sec bins | Bins with >0 counts | Bins with >2000 counts | High rate bins dominated by noise | Noise dominated (total time) | Noise dominated (detector-on time) | Marked lightcurve |
|---|---|---|---|---|---|---|---|
| A | 7254 | 5973 | 106 | 106 | 1.46% | 1.77% | 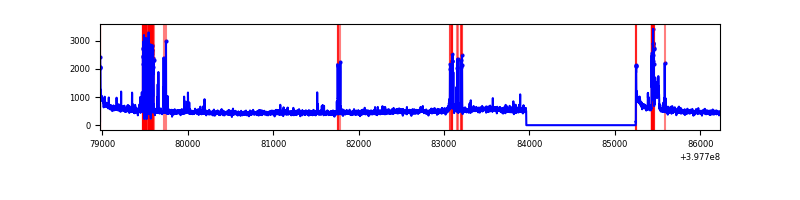 |
| B | 7254 | 5973 | 349 | 349 | 4.81% | 5.84% | 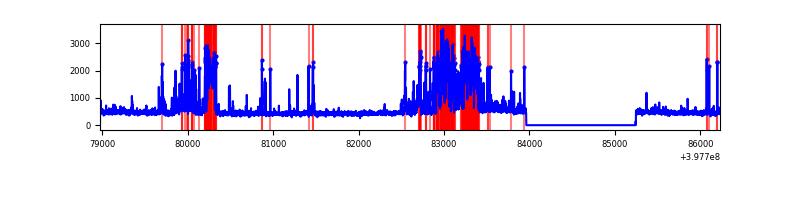 |
| C | 7254 | 5973 | 63 | 63 | 0.87% | 1.05% | 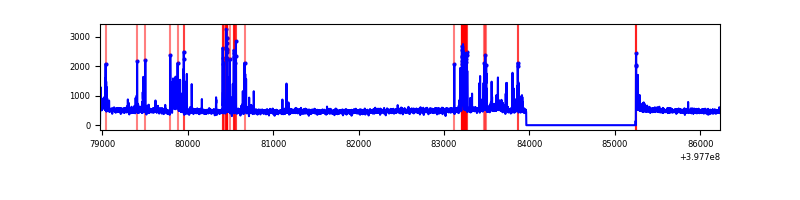 |
| D | 7254 | 5973 | 416 | 416 | 5.73% | 6.96% | 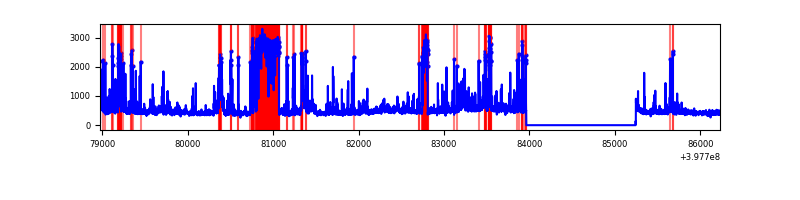 |
Top three noisy pixels from each quadrant. If the there are fewer than three noisy pixels in the level2.evt file, extra rows are filled as -1
| Pixel properties | Quadrant properties | ||||||
|---|---|---|---|---|---|---|---|
| Quadrant | DetID | PixID | Counts | Sigma | Mean | Median | Sigma |
| A | 15 | 237 | 343003 | 2513.37 | 666 | 654 | 136.2 |
| A | 10 | 83 | 274377 | 2009.55 | 666 | 654 | 136.2 |
| A | 9 | 143 | 87032 | 634.15 | 666 | 654 | 136.2 |
| B | 5 | 200 | 704907 | 5579.31 | 654 | 636 | 126.2 |
| B | 5 | 172 | 411154 | 3252.17 | 654 | 636 | 126.2 |
| B | 5 | 184 | 230061 | 1817.53 | 654 | 636 | 126.2 |
| C | 14 | 254 | 306166 | 1980.36 | 659 | 664 | 154.3 |
| C | 15 | 214 | 256011 | 1655.24 | 659 | 664 | 154.3 |
| C | 0 | 10 | 67696 | 434.52 | 659 | 664 | 154.3 |
| D | 12 | 17 | 861544 | 5476.1 | 640 | 622 | 157.2 |
| D | 13 | 171 | 389510 | 2473.61 | 640 | 622 | 157.2 |
| D | 13 | 249 | 223970 | 1420.66 | 640 | 622 | 157.2 |
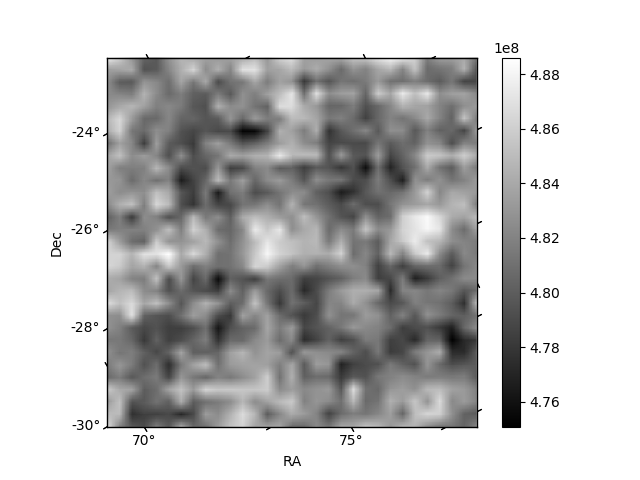
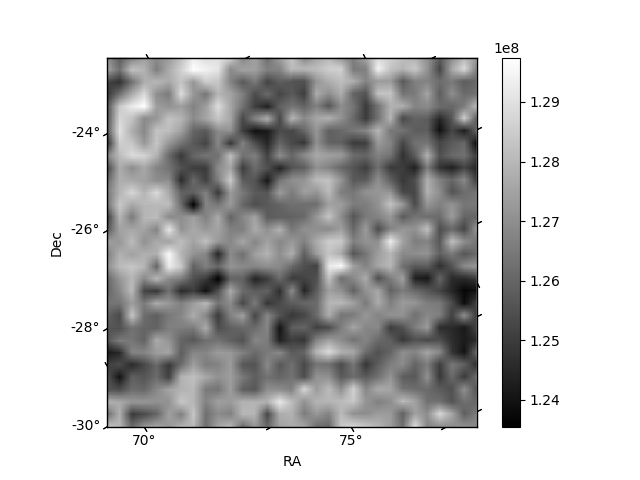
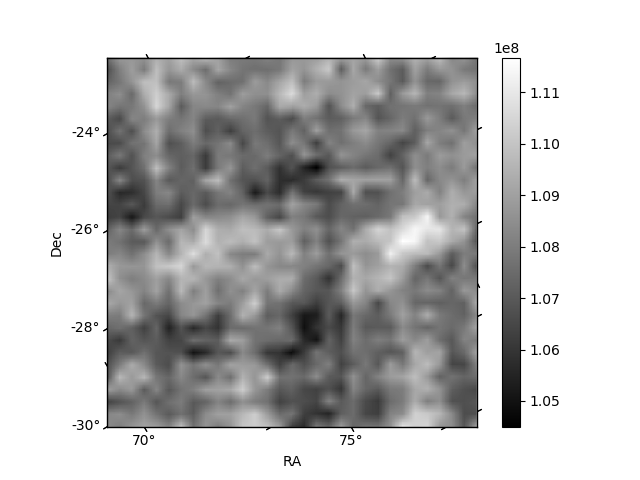
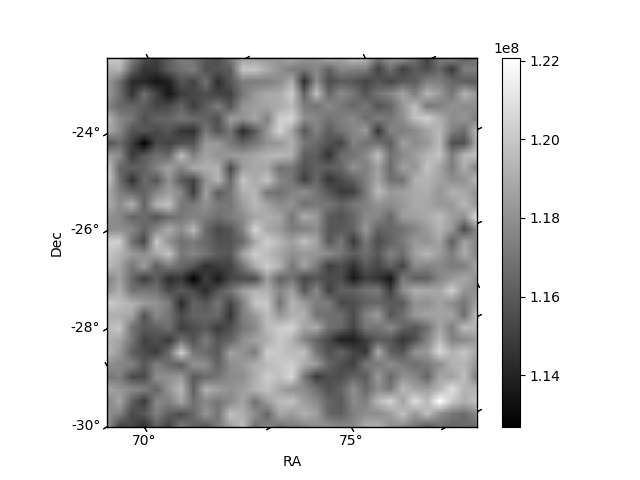
Histogram calculated using DETX and DETY for each event in the final _common_clean file
| Quadrant A | 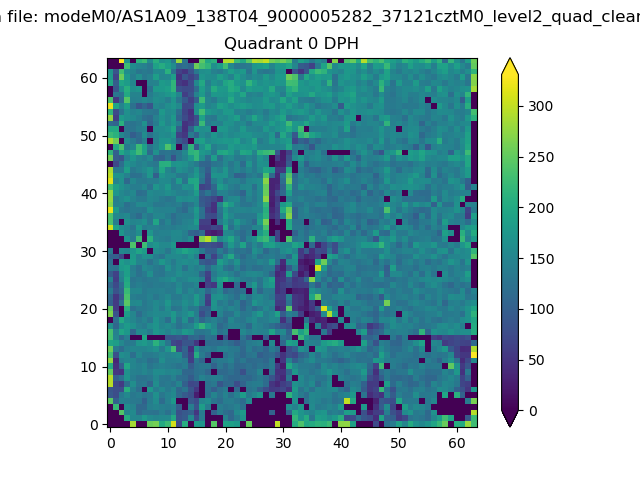 |
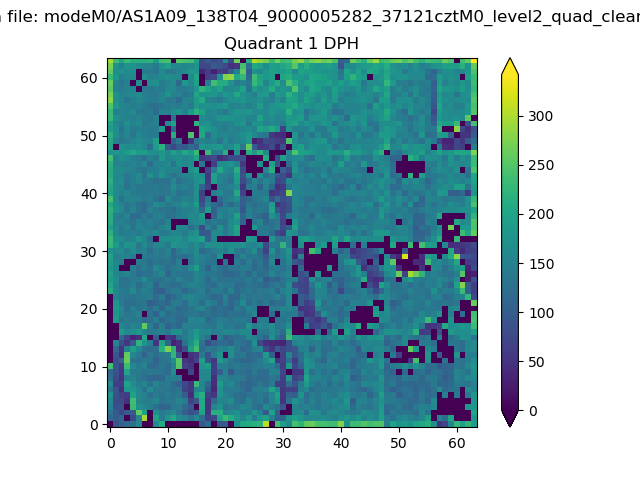 |
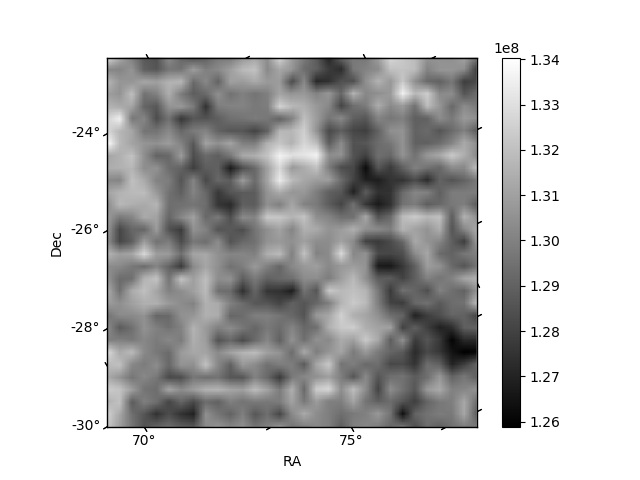
Quadrant B |
|---|---|---|---|
| Quadrant D | 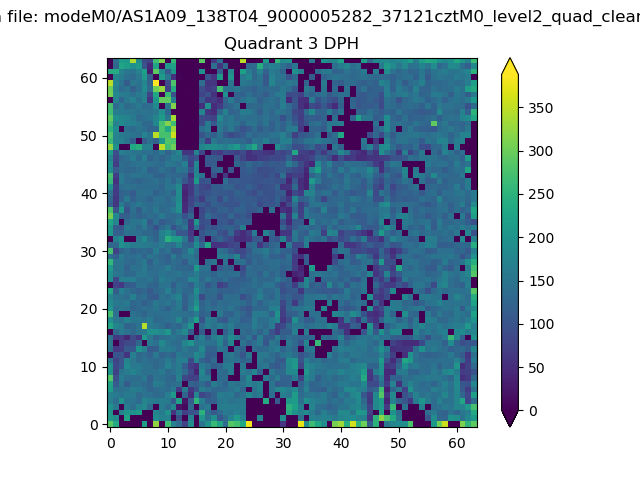 |
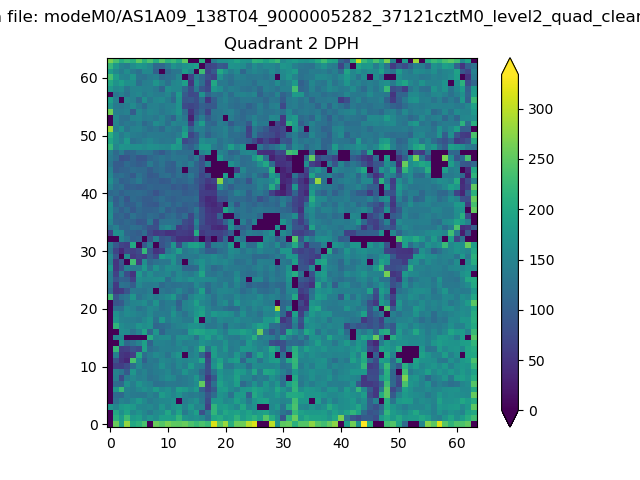 |
Quadrant C |
| Plot type | Count rate plots | Images |
|---|---|---|
| Comparison with Poisson distribution Blue bars denote a histogram of data divided into 1 sec bins. Red curve is a Poisson curve with rate = median count rate of data. |
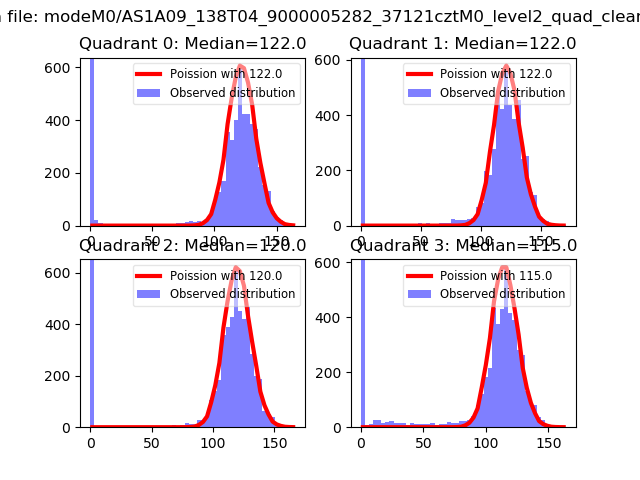 |
 |
| Quadrant-wise count rates Data is divided into 100 sec bins |
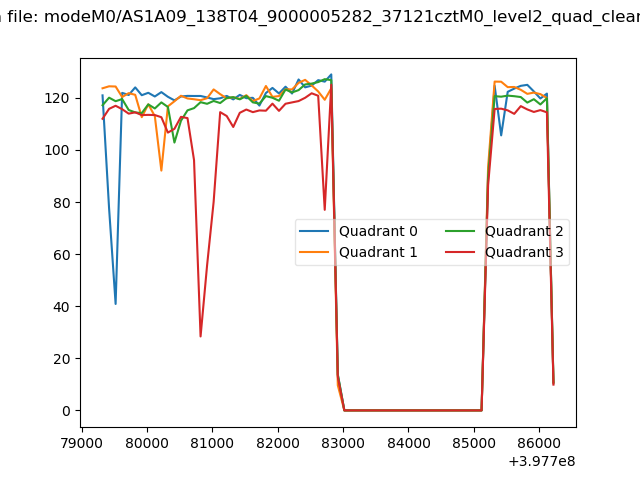 |
|
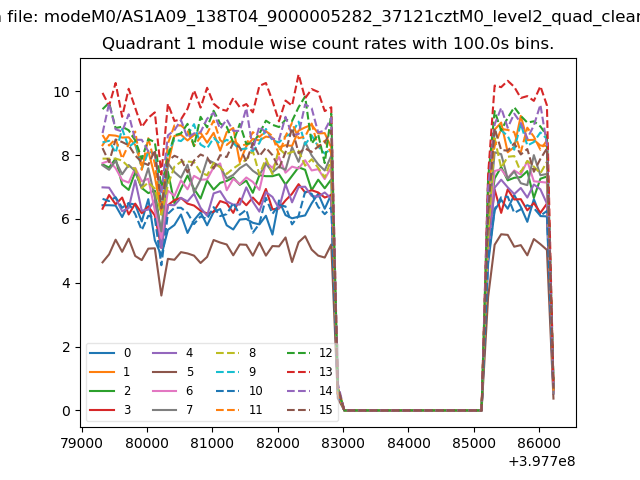
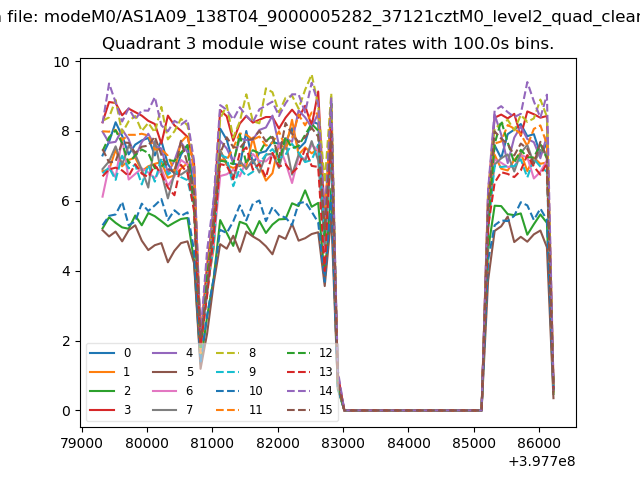
| Module-wise count rates for Quadrant A Data is divided into 100 sec bins |
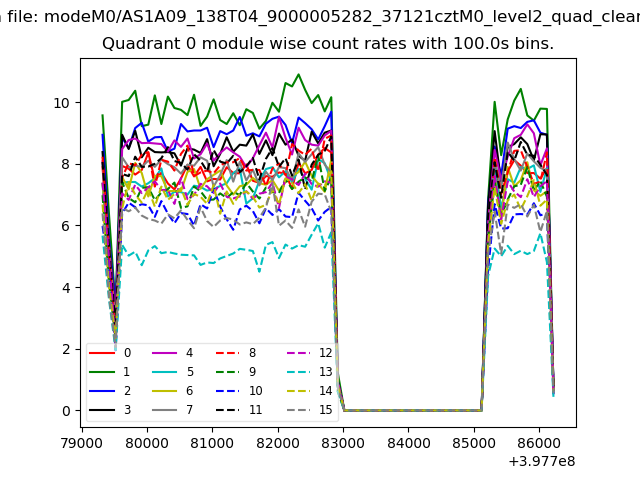 |
 |
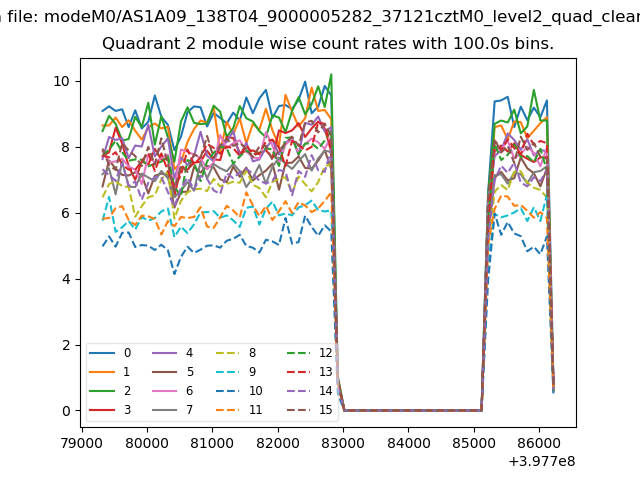
| Module-wise count rates for Quadrant B Data is divided into 100 sec bins |
 |
 |
| Module-wise count rates for Quadrant C Data is divided into 100 sec bins |
 |
 |
| Module-wise count rates for Quadrant D Data is divided into 100 sec bins |
 |
 |
| Parameter | Plot |
|---|---|
| CZT HV Monitor | 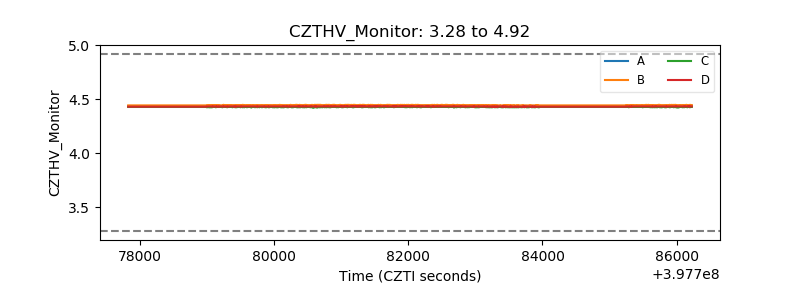 |
| D_VDD | 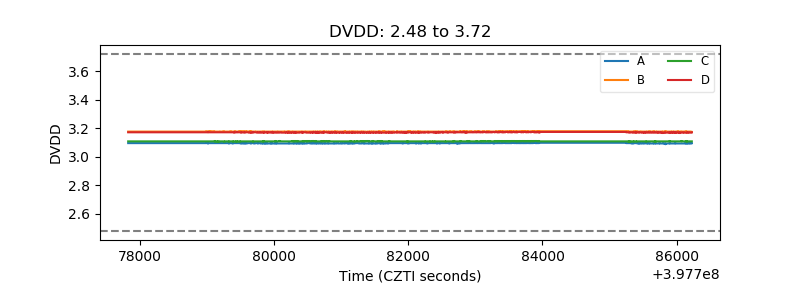 |
| Temperature 1 | 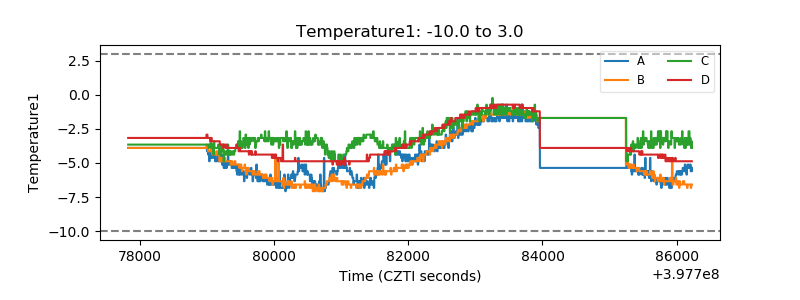 |
| Veto HV Monitor | 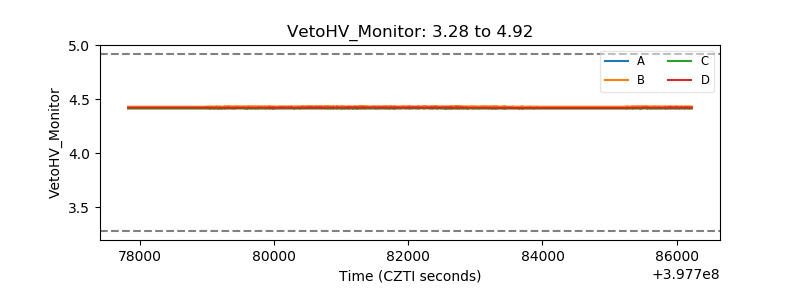 |
| Veto LLD | 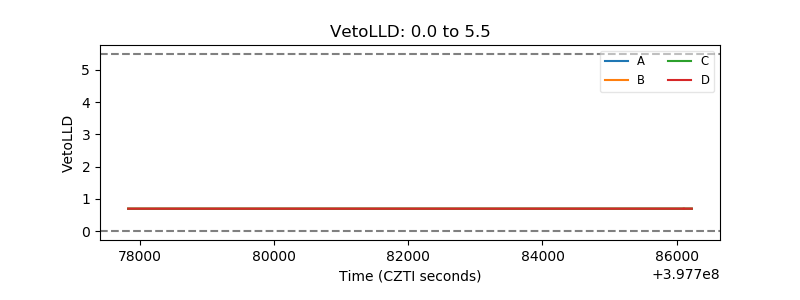 |
| Alpha Counter | 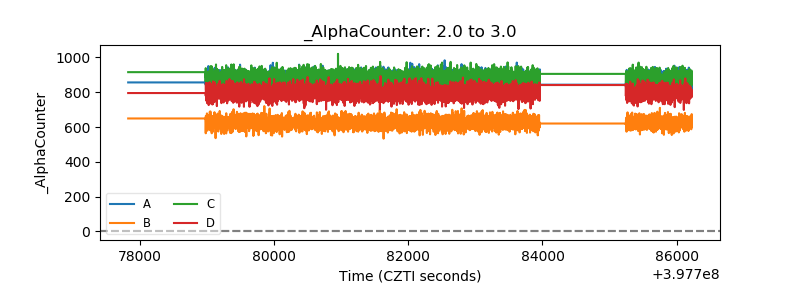 |
| _CPM_Rate | 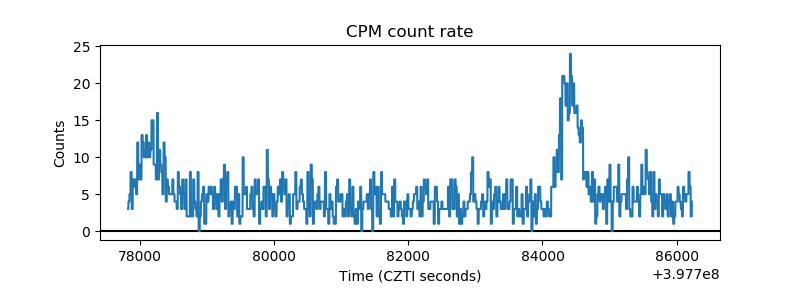 |
| CZT Counter | 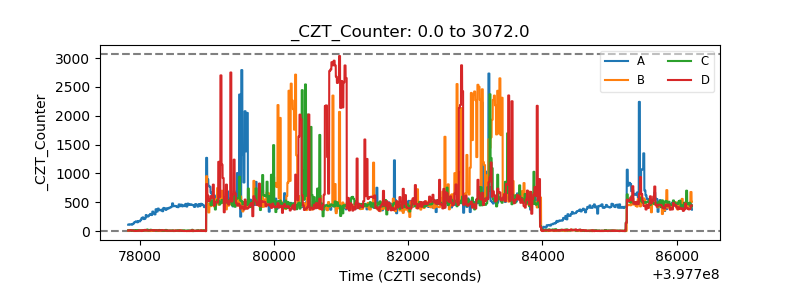 |
| +2.5 Volts monitor | 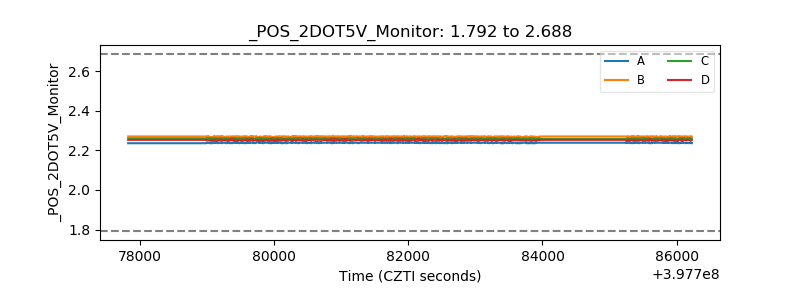 |
| +5 Volts monitor | 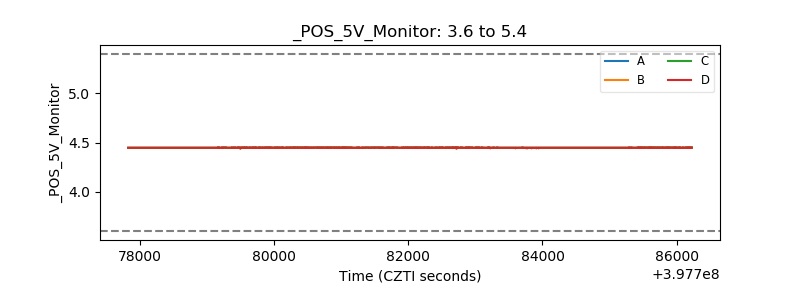 |
| _ROLL_ROT | 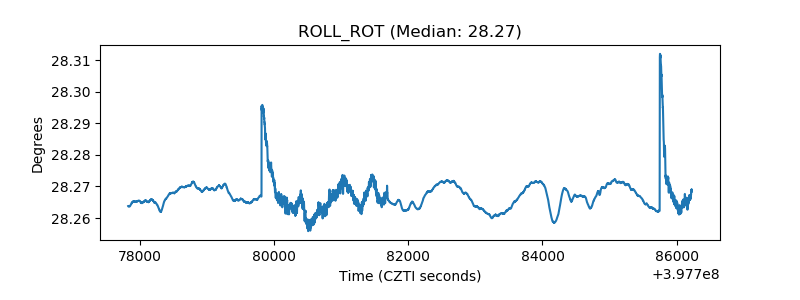 |
| _Roll_DEC | 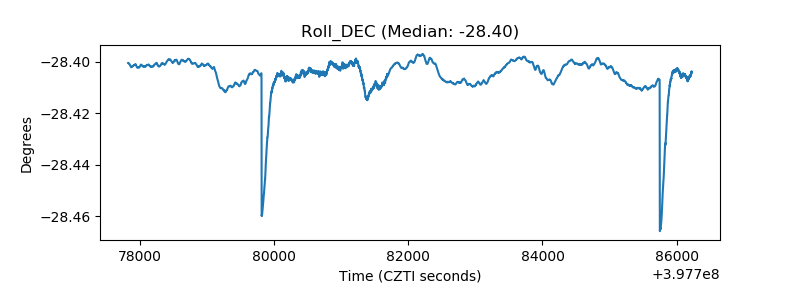 |
| _Roll_RA | 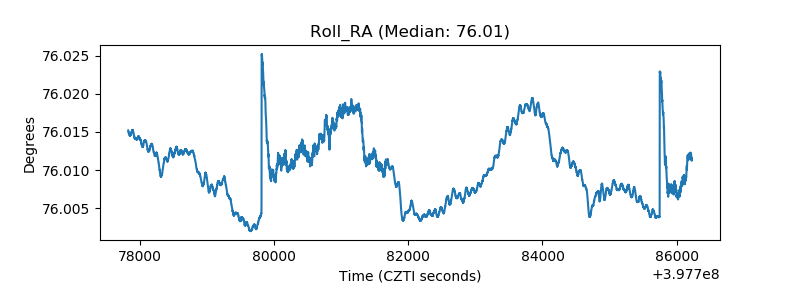 |
| Veto Counter | 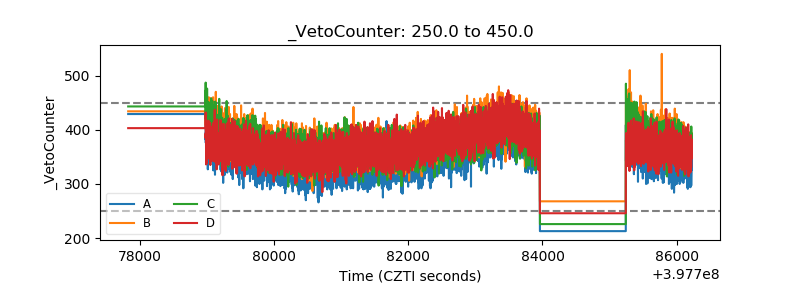 |