| Param | Original file | Final file |
|---|---|---|
| Filename | modeM0/AS1A09_138T04_9000005282_37123cztM0_level2.evt | modeM0/AS1A09_138T04_9000005282_37123cztM0_level2_quad_clean.evt |
| Size (bytes) | 254,399,040 | 62,637,120 |
| Size | 242.6 MB | 59.7 MB |
| Events in quadrant A | 1,879,523 | 415,655 |
| Events in quadrant B | 1,773,623 | 416,764 |
| Events in quadrant C | 1,882,729 | 408,682 |
| Events in quadrant D | 1,913,884 | 392,296 |
| Mode SS | |||
|---|---|---|---|
| Quadrant | BADHDUFLAG | Total packets | Discarded packets |
| A | 0 | 76 | 0 |
| B | 0 | 76 | 0 |
| C | 0 | 76 | 0 |
| D | 0 | 76 | 0 |
| Mode M0 | |||
|---|---|---|---|
| Quadrant | BADHDUFLAG | Total packets | Discarded packets |
| A | 0 | 8083 | 1 |
| B | 0 | 7907 | 1 |
| C | 0 | 7929 | 1 |
| D | 0 | 8389 | 1 |
| Mode M9 | |||
|---|---|---|---|
| Quadrant | BADHDUFLAG | Total packets | Discarded packets |
| A | 0 | 13 | 0 |
| B | 0 | 13 | 0 |
| C | 0 | 13 | 0 |
| D | 0 | 13 | 0 |
| Quadrant | Total seconds | Saturated seconds | Saturation percentage |
|---|---|---|---|
| A | 3725 | 28 | 0.751678% |
| B | 3725 | 34 | 0.912752% |
| C | 3725 | 22 | 0.590604% |
| D | 3725 | 74 | 1.986577% |
Noise dominated data is calculated using 1-second bins in cleaned event files. If a bin has >2000 counts, and if more than 50% of those come from <1% of pixels, then it is considered to be noise-dominated and hence unusable.
| Quadrant | # 1 sec bins | Bins with >0 counts | Bins with >2000 counts | High rate bins dominated by noise | Noise dominated (total time) | Noise dominated (detector-on time) | Marked lightcurve |
|---|---|---|---|---|---|---|---|
| A | 5007 | 3726 | 25 | 25 | 0.50% | 0.67% | 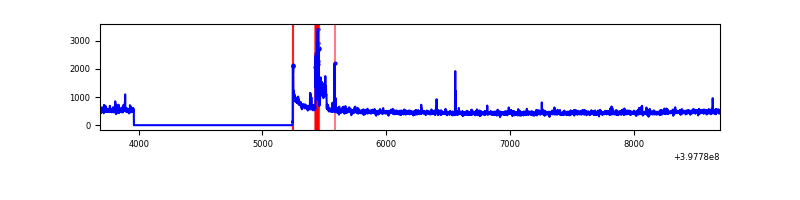 |
| B | 5007 | 3726 | 28 | 28 | 0.56% | 0.75% | 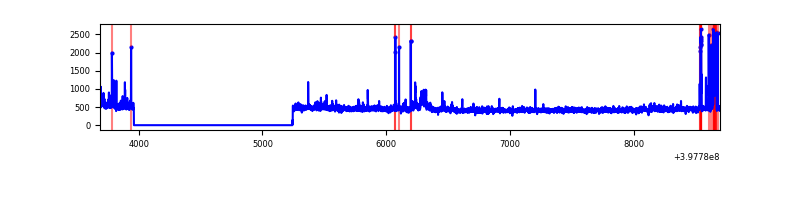 |
| C | 5007 | 3726 | 19 | 19 | 0.38% | 0.51% | 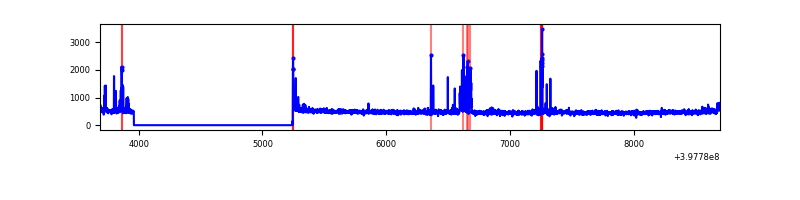 |
| D | 5007 | 3726 | 65 | 65 | 1.30% | 1.74% | 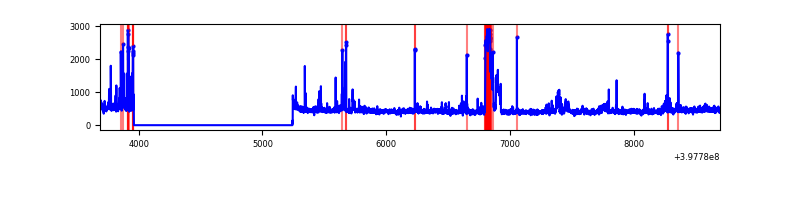 |
Top three noisy pixels from each quadrant. If the there are fewer than three noisy pixels in the level2.evt file, extra rows are filled as -1
| Pixel properties | Quadrant properties | ||||||
|---|---|---|---|---|---|---|---|
| Quadrant | DetID | PixID | Counts | Sigma | Mean | Median | Sigma |
| A | 10 | 83 | 153610 | 1850.32 | 407 | 399 | 82.8 |
| A | 15 | 237 | 95893 | 1153.27 | 407 | 399 | 82.8 |
| A | 9 | 143 | 21294 | 252.35 | 407 | 399 | 82.8 |
| B | 5 | 172 | 91737 | 1138.48 | 404 | 394 | 80.2 |
| B | 5 | 184 | 33544 | 413.17 | 404 | 394 | 80.2 |
| B | 5 | 200 | 20929 | 255.94 | 404 | 394 | 80.2 |
| C | 15 | 214 | 157713 | 1655.78 | 400 | 404 | 95.0 |
| C | 0 | 10 | 79518 | 832.72 | 400 | 404 | 95.0 |
| C | 14 | 254 | 78892 | 826.14 | 400 | 404 | 95.0 |
| D | 13 | 249 | 267490 | 2712.97 | 397 | 386 | 98.5 |
| D | 1 | 47 | 34935 | 350.91 | 397 | 386 | 98.5 |
| D | 2 | 250 | 20792 | 207.26 | 397 | 386 | 98.5 |
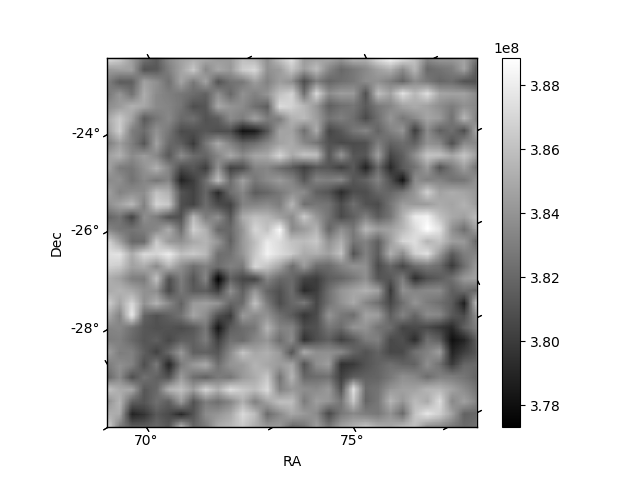
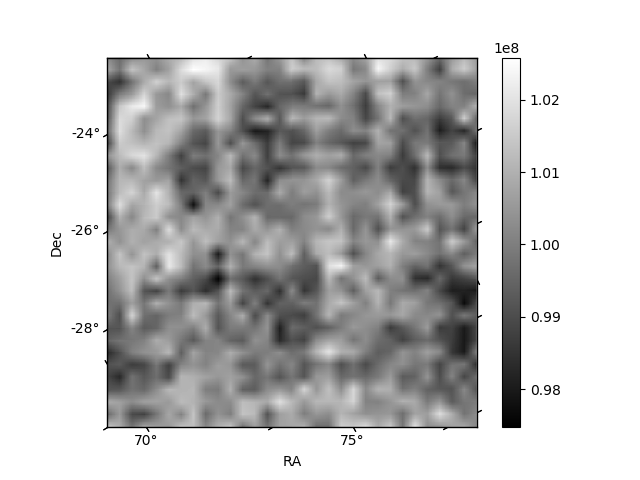
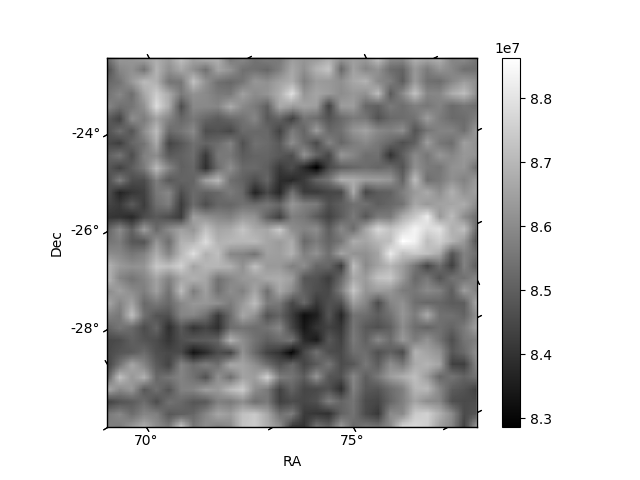
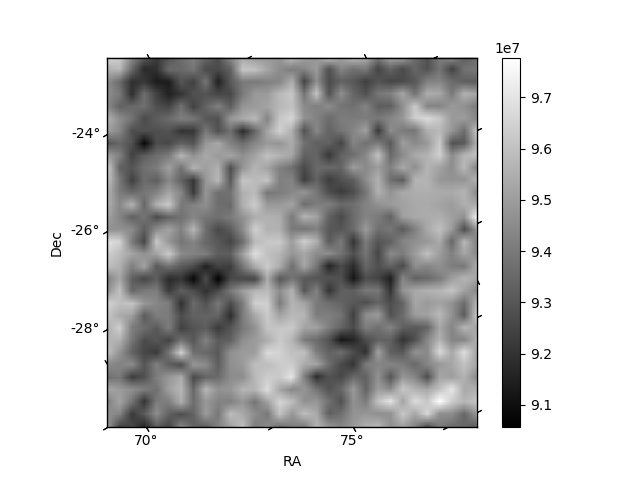
Histogram calculated using DETX and DETY for each event in the final _common_clean file
| Quadrant A | 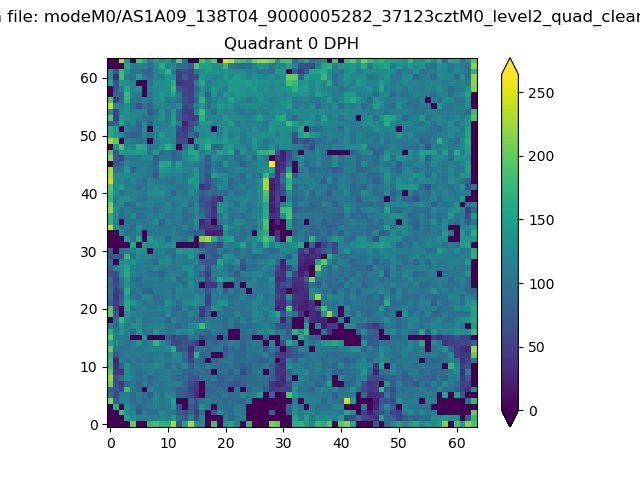 |
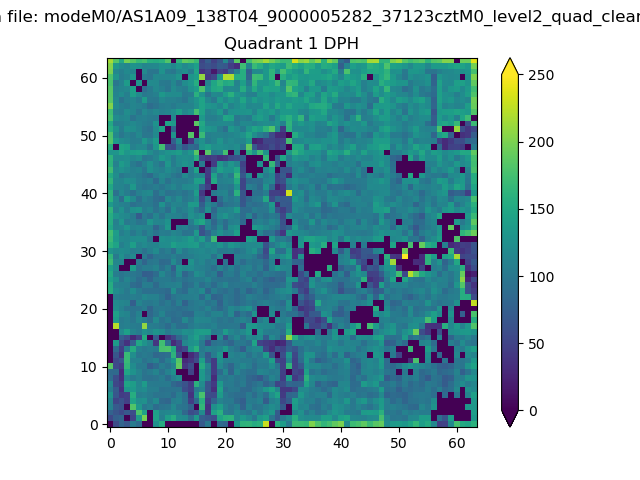 |
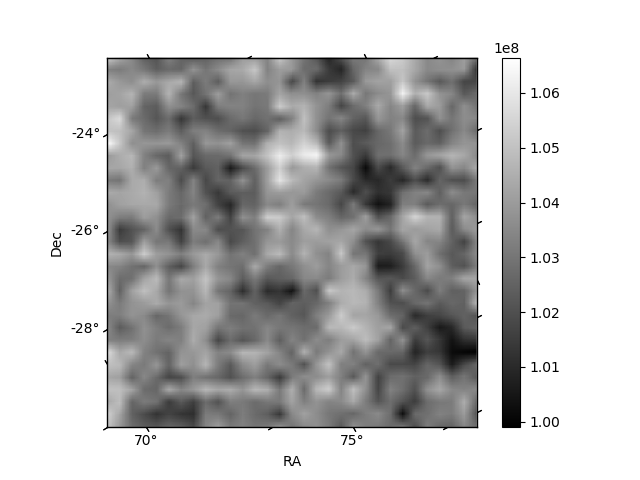
Quadrant B |
|---|---|---|---|
| Quadrant D | 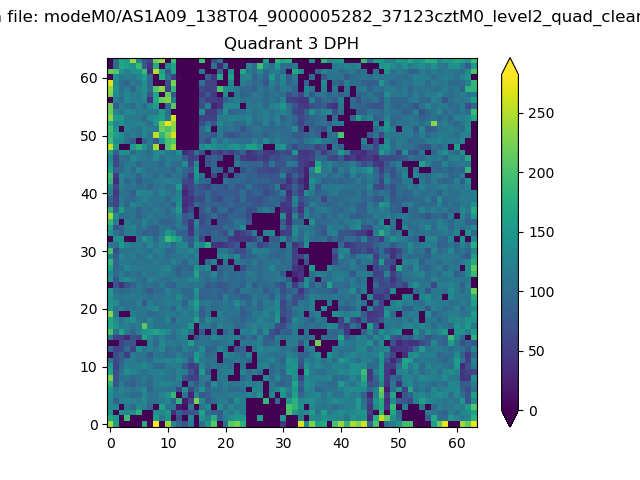 |
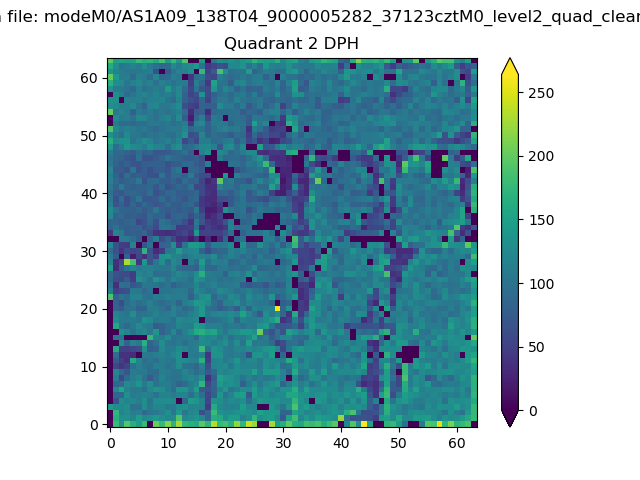 |
Quadrant C |
| Plot type | Count rate plots | Images |
|---|---|---|
| Comparison with Poisson distribution Blue bars denote a histogram of data divided into 1 sec bins. Red curve is a Poisson curve with rate = median count rate of data. |
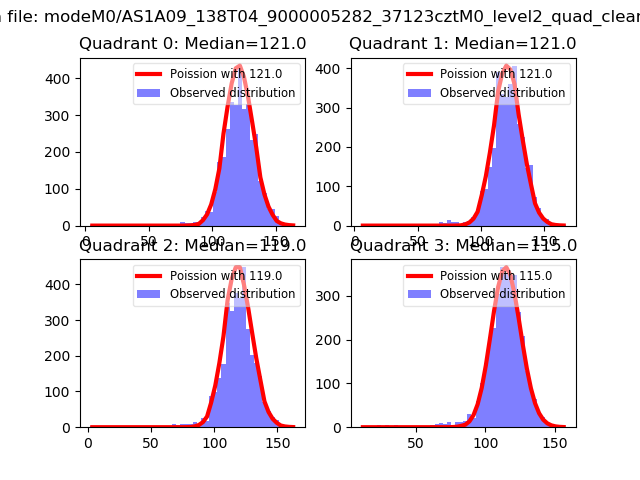 |
 |
| Quadrant-wise count rates Data is divided into 100 sec bins |
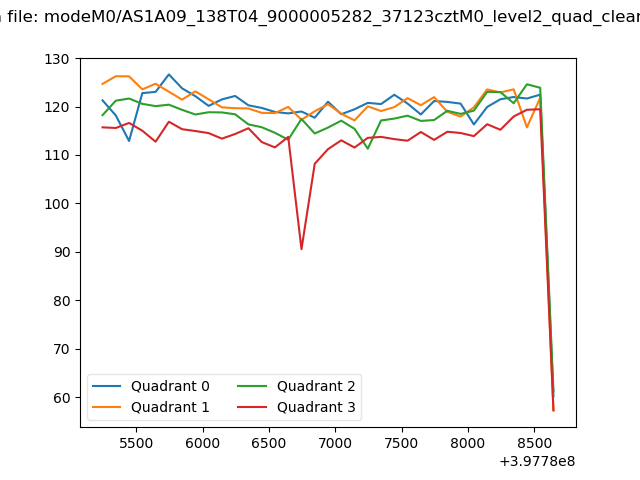 |
|
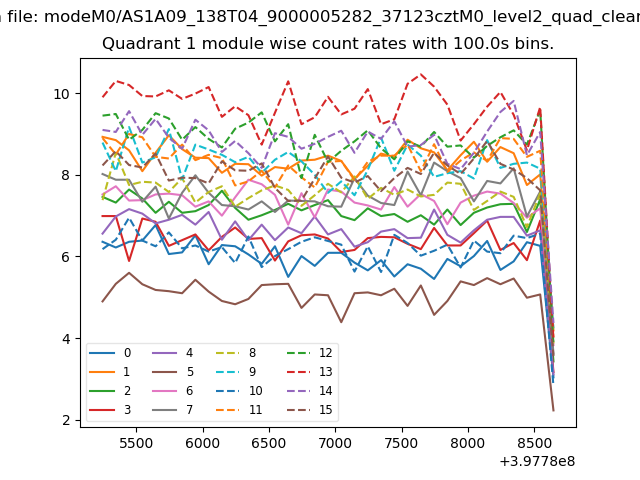
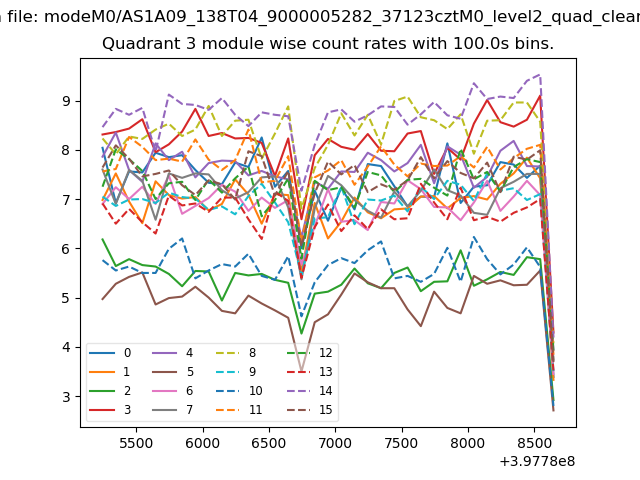
| Module-wise count rates for Quadrant A Data is divided into 100 sec bins |
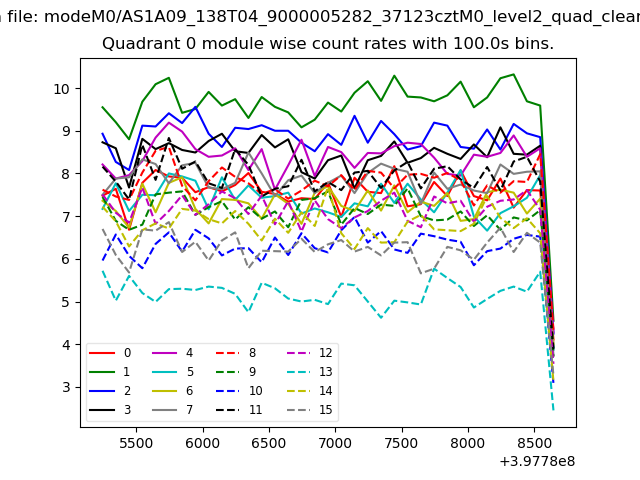 |
 |
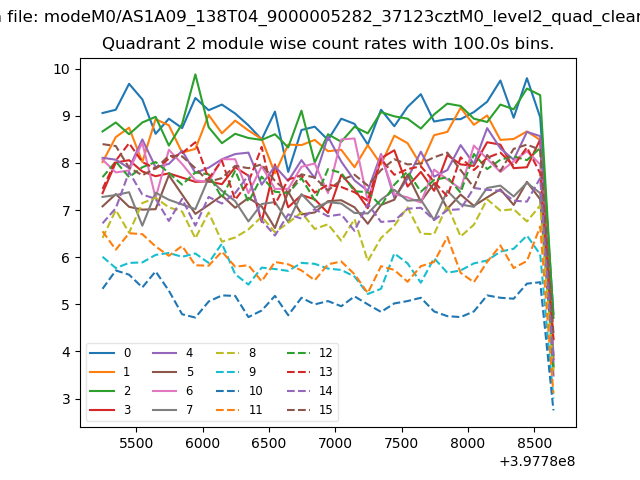
| Module-wise count rates for Quadrant B Data is divided into 100 sec bins |
 |
 |
| Module-wise count rates for Quadrant C Data is divided into 100 sec bins |
 |
 |
| Module-wise count rates for Quadrant D Data is divided into 100 sec bins |
 |
 |
| Parameter | Plot |
|---|---|
| CZT HV Monitor | 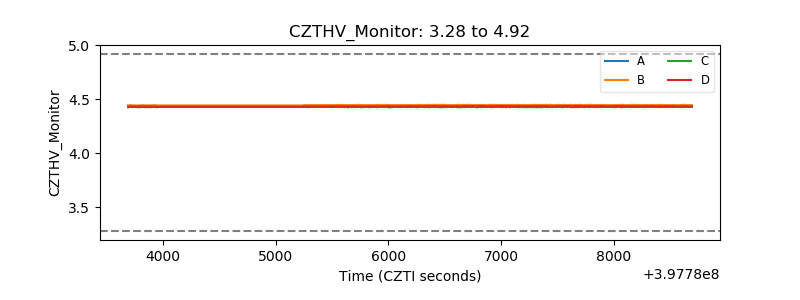 |
| D_VDD | 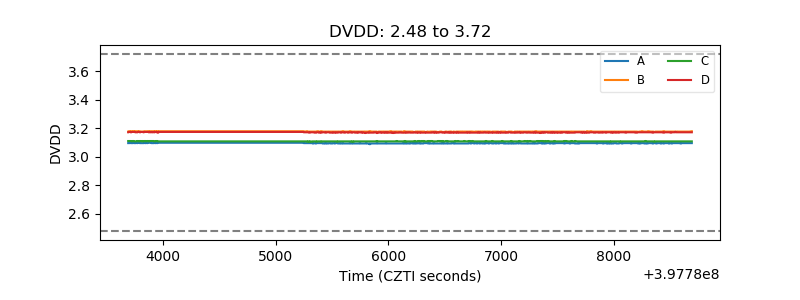 |
| Temperature 1 | 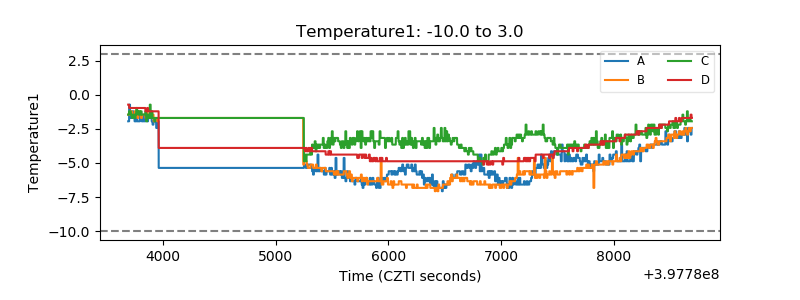 |
| Veto HV Monitor | 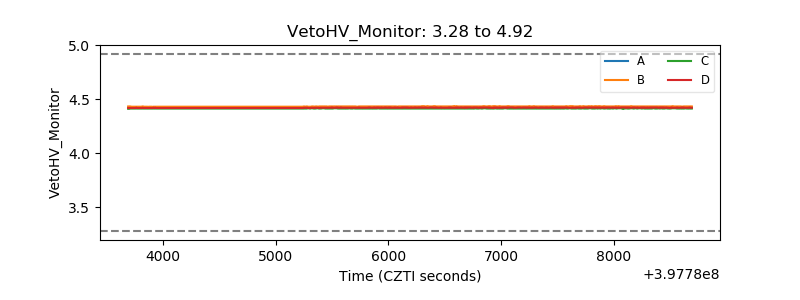 |
| Veto LLD | 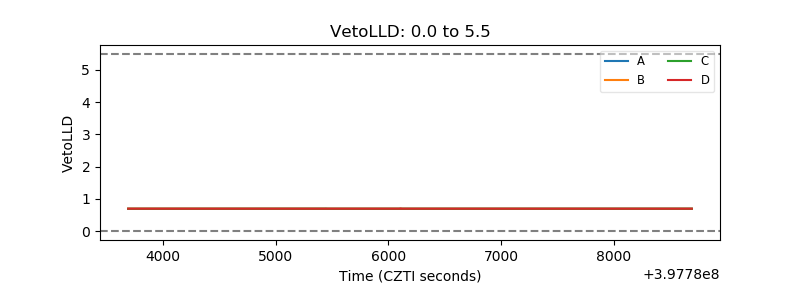 |
| Alpha Counter | 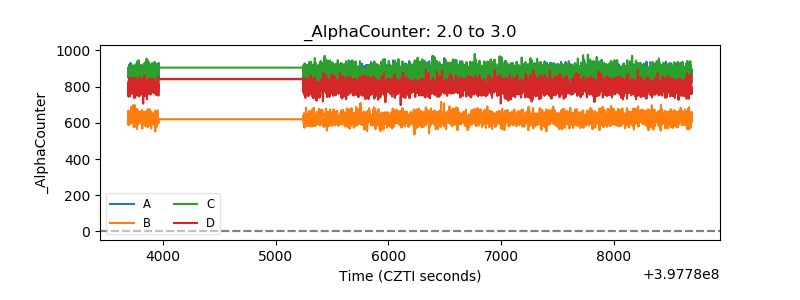 |
| _CPM_Rate | 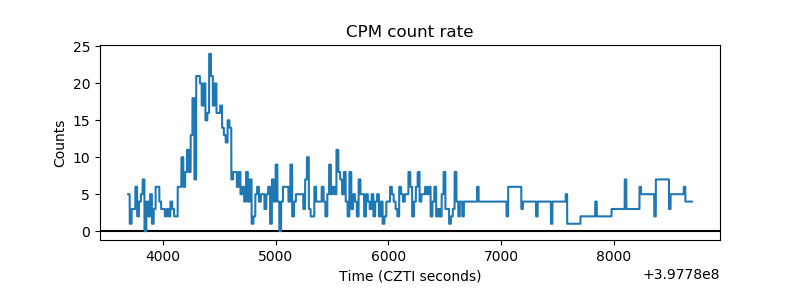 |
| CZT Counter | 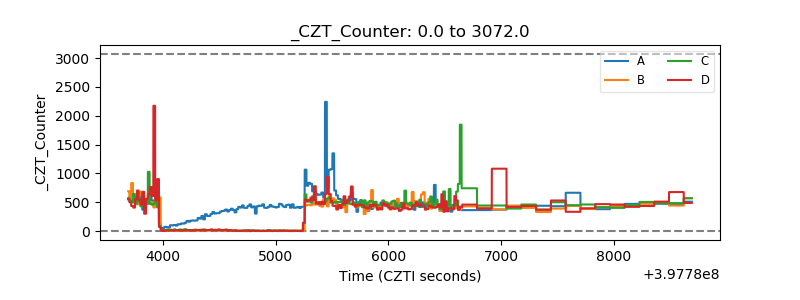 |
| +2.5 Volts monitor | 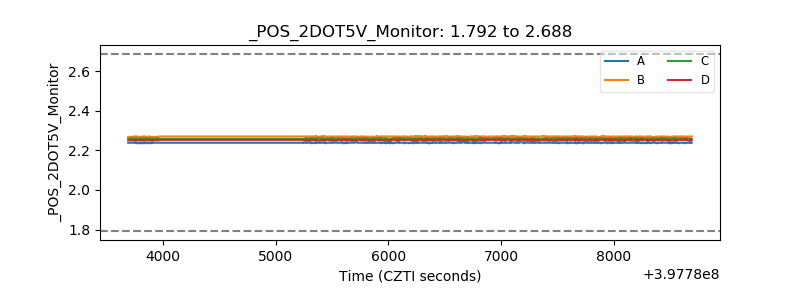 |
| +5 Volts monitor | 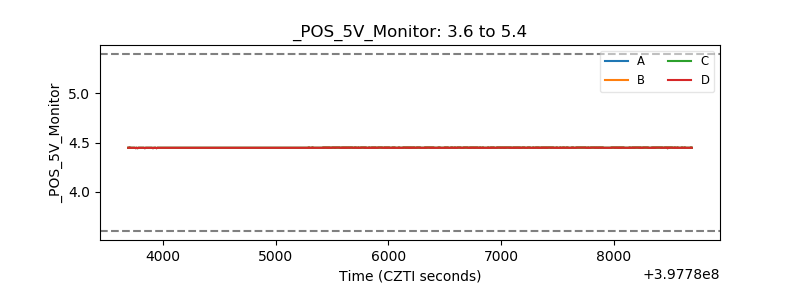 |
| _ROLL_ROT | 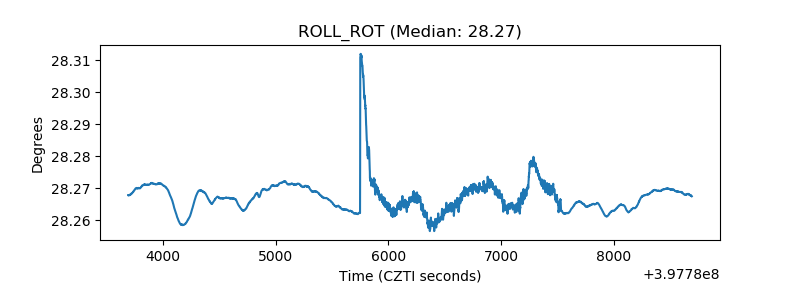 |
| _Roll_DEC | 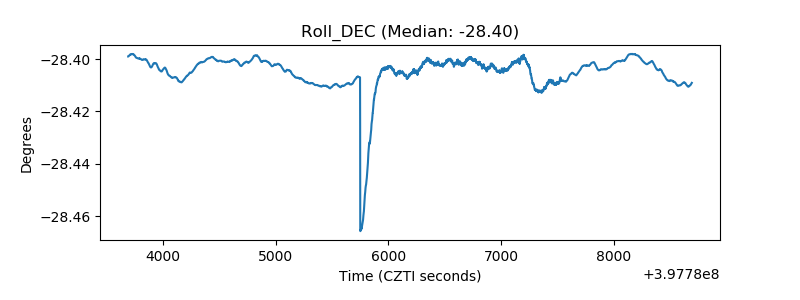 |
| _Roll_RA | 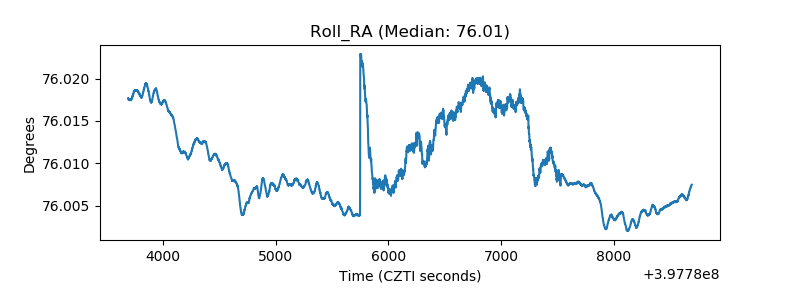 |
| Veto Counter | 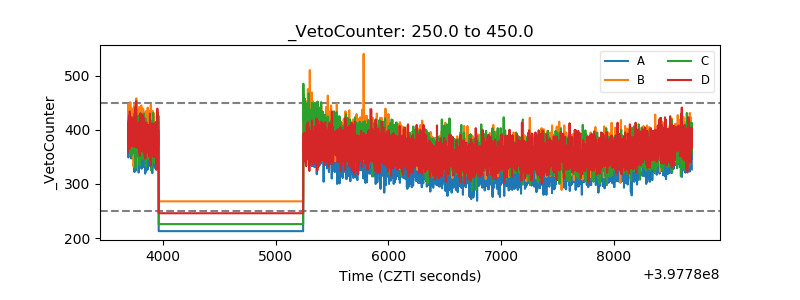 |