| Param | Original file | Final file |
|---|---|---|
| Filename | modeM0/AS1A11_079T01_9000005284cztM0_level2.fits | modeM0/AS1A11_079T01_9000005284cztM0_level2_quad_clean.evt |
| Size (bytes) | 4,223,917,440 | 4,250,220,480 |
| Size | 3.9 GB | 4.0 GB |
| Events in quadrant A | 26,190,336 | 26,239,174 |
| Events in quadrant B | 24,527,444 | 25,545,339 |
| Events in quadrant C | 25,162,068 | 24,705,969 |
| Events in quadrant D | 21,588,746 | 21,786,804 |
| Mode M9 | |||
|---|---|---|---|
| Quadrant | BADHDUFLAG | Total packets | Discarded packets |
| A | 0 | 1676 | 0 |
| B | 0 | 1676 | 0 |
| C | 0 | 1676 | 0 |
| D | 0 | 1676 | 0 |
| Mode SS | |||
|---|---|---|---|
| Quadrant | BADHDUFLAG | Total packets | Discarded packets |
| A | 0 | 9084 | 0 |
| B | 0 | 9084 | 0 |
| C | 0 | 9084 | 0 |
| D | 0 | 9084 | 0 |
| Mode M0 | |||
|---|---|---|---|
| Quadrant | BADHDUFLAG | Total packets | Discarded packets |
| A | 0 | 947403 | 0 |
| B | 0 | 1046412 | 0 |
| C | 0 | 1048090 | 0 |
| D | 0 | 1198386 | 0 |
| Quadrant | Total seconds | Saturated seconds | Saturation percentage |
|---|---|---|---|
| A | 444610 | 1739 | 0.391129% |
| B | 444609 | 10540 | 2.370622% |
| C | 444609 | 6815 | 1.532807% |
| D | 444607 | 21002 | 4.723722% |
Noise dominated data is calculated using 1-second bins in cleaned event files. If a bin has >2000 counts, and if more than 50% of those come from <1% of pixels, then it is considered to be noise-dominated and hence unusable.
| Quadrant | # 1 sec bins | Bins with >0 counts | Bins with >2000 counts | High rate bins dominated by noise | Noise dominated (total time) | Noise dominated (detector-on time) | Marked lightcurve |
|---|---|---|---|---|---|---|---|
| A | 610962 | 444578 | 0 | 0 | 0.00% | 0.00% |  |
| B | 610962 | 444508 | 0 | 0 | 0.00% | 0.00% |  |
| C | 610962 | 444572 | 0 | 0 | 0.00% | 0.00% | 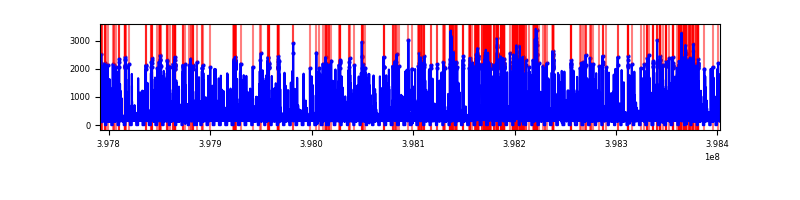 |
| D | 610962 | 444413 | 0 | 0 | 0.00% | 0.00% | 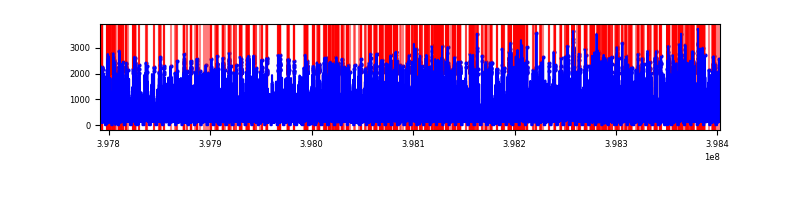 |
Top three noisy pixels from each quadrant. If the there are fewer than three noisy pixels in the level2.evt file, extra rows are filled as -1
| Pixel properties | Quadrant properties | ||||||
|---|---|---|---|---|---|---|---|
| Quadrant | DetID | PixID | Counts | Sigma | Mean | Median | Sigma |
| A | 7 | 110 | 21388 | 8.97 | 6850 | 6438 | 1666.9 |
| A | 9 | 19 | 21129 | 8.81 | 6850 | 6438 | 1666.9 |
| A | 0 | 29 | 20401 | 8.38 | 6850 | 6438 | 1666.9 |
| B | 2 | 9 | 21285 | 12.06 | 6512 | 6228 | 1248.3 |
| B | 3 | 80 | 18817 | 10.09 | 6512 | 6228 | 1248.3 |
| B | 5 | 128 | 17253 | 8.83 | 6512 | 6228 | 1248.3 |
| C | 1 | 81 | 20749 | 8.54 | 6654 | 6242 | 1698.3 |
| C | 1 | 80 | 20093 | 8.16 | 6654 | 6242 | 1698.3 |
| C | 3 | 203 | 19929 | 8.06 | 6654 | 6242 | 1698.3 |
| D | 7 | 3 | 15796 | 6.21 | 6202 | 5667 | 1631.6 |
| D | 10 | 113 | 15679 | 6.14 | 6202 | 5667 | 1631.6 |
| D | 4 | 160 | 15439 | 5.99 | 6202 | 5667 | 1631.6 |
Histogram calculated using DETX and DETY for each event in the final _common_clean file
| Quadrant A | 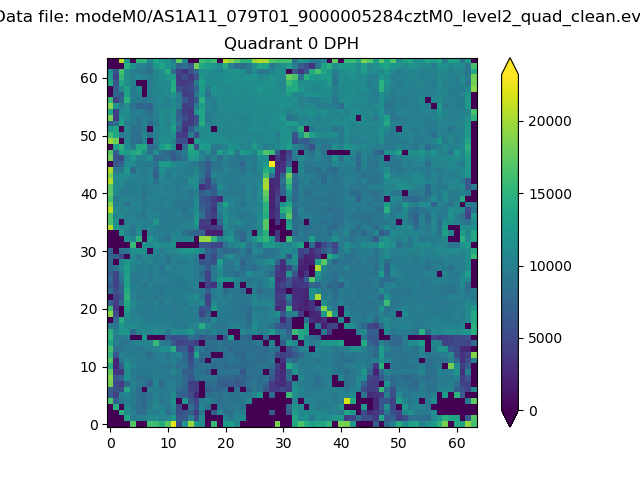 |
 |
Quadrant B |
|---|---|---|---|
| Quadrant D | 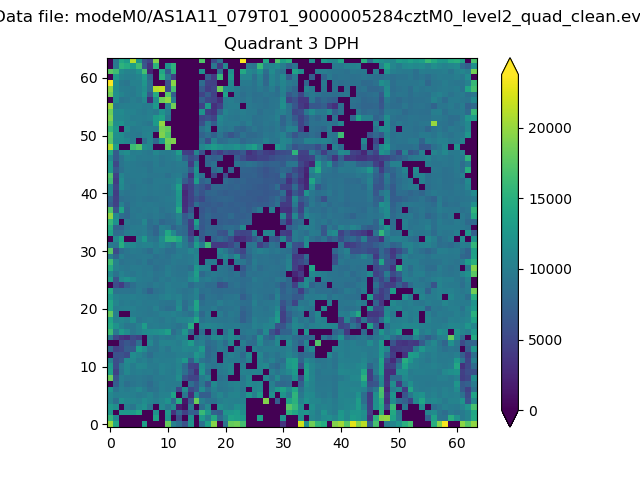 |
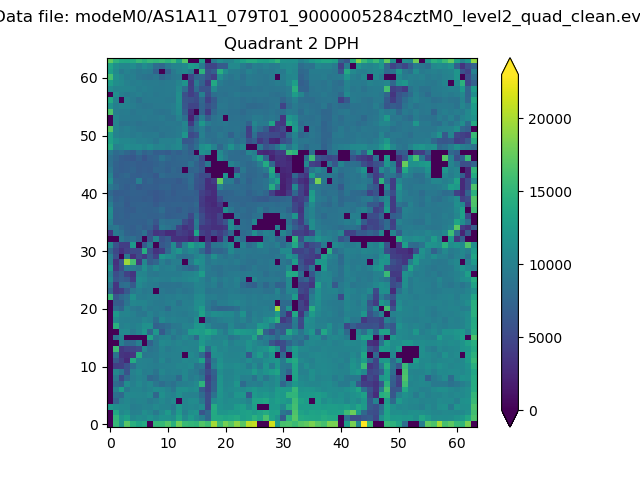 |
Quadrant C |
| Plot type | Count rate plots | Images |
|---|---|---|
| Comparison with Poisson distribution Blue bars denote a histogram of data divided into 1 sec bins. Red curve is a Poisson curve with rate = median count rate of data. |
 |
 |
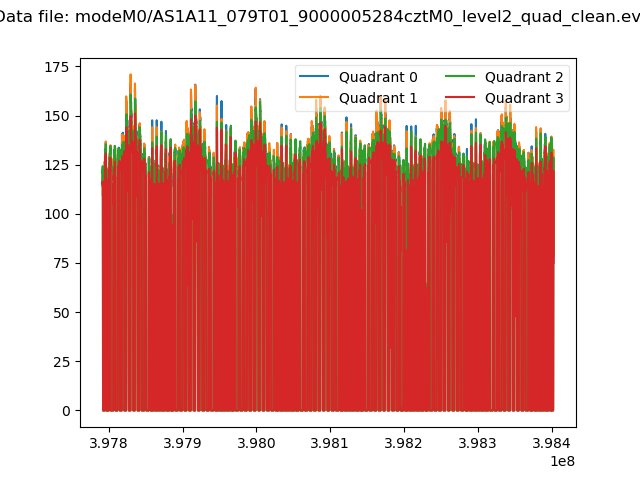
| Quadrant-wise count rates Data is divided into 100 sec bins |
 |
|
| Module-wise count rates for Quadrant A Data is divided into 100 sec bins |
 |
 |
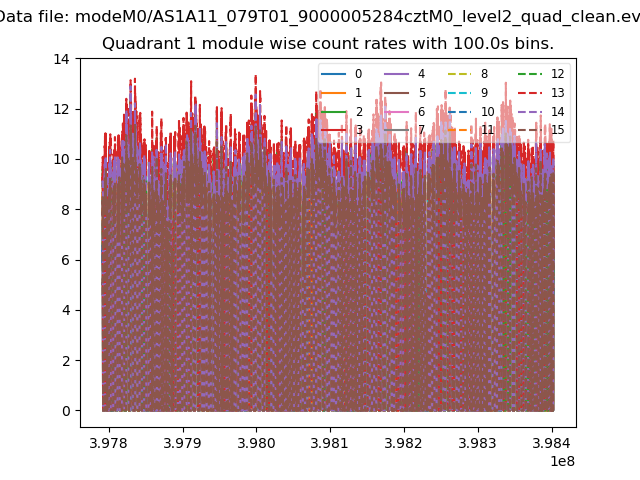
| Module-wise count rates for Quadrant B Data is divided into 100 sec bins |
 |
 |
| Module-wise count rates for Quadrant C Data is divided into 100 sec bins |
 |
 |
| Module-wise count rates for Quadrant D Data is divided into 100 sec bins |
 |
 |
| Parameter | Plot |
|---|---|
| CZT HV Monitor |  |
| D_VDD | 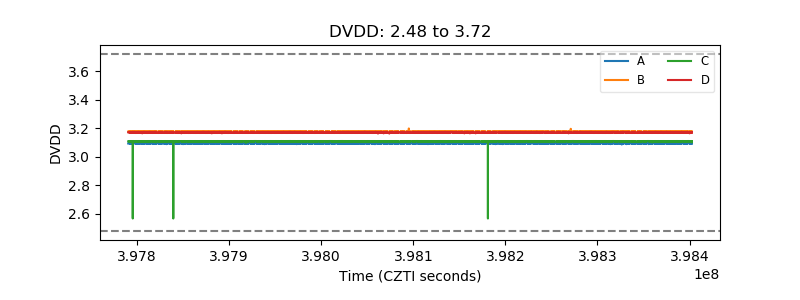 |
| Temperature 1 |  |
| Veto HV Monitor |  |
| Veto LLD |  |
| Alpha Counter |  |
| _CPM_Rate | 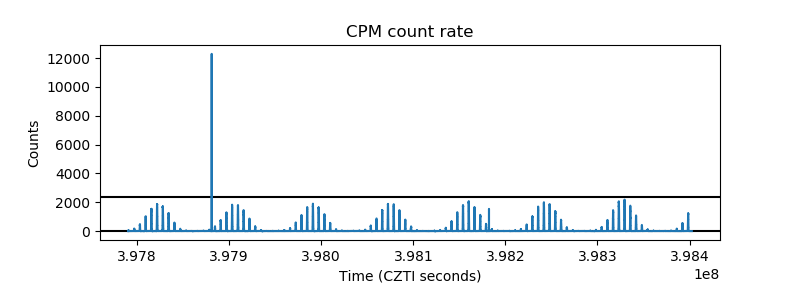 |
| CZT Counter | 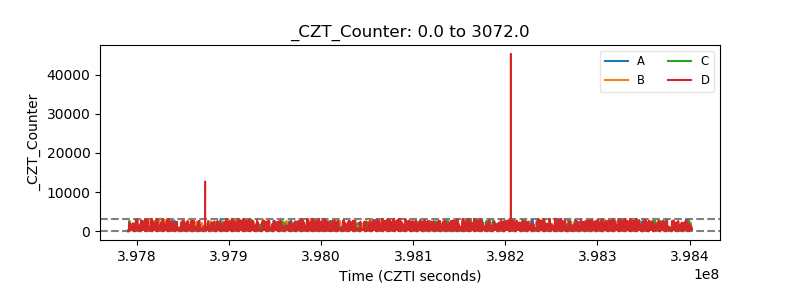 |
| +2.5 Volts monitor |  |
| +5 Volts monitor |  |
| _ROLL_ROT | 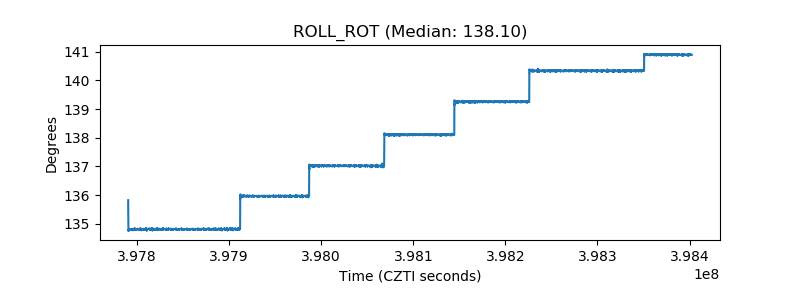 |
| _Roll_DEC |  |
| _Roll_RA |  |
| Veto Counter |  |