| Param | Original file | Final file |
|---|---|---|
| Filename | modeM0/AS1A11_079T01_9000005284_37123cztM0_level2.evt | modeM0/AS1A11_079T01_9000005284_37123cztM0_level2_quad_clean.evt |
| Size (bytes) | 411,511,680 | 59,365,440 |
| Size | 392.4 MB | 56.6 MB |
| Events in quadrant A | 2,879,489 | 350,094 |
| Events in quadrant B | 2,974,369 | 353,659 |
| Events in quadrant C | 3,121,193 | 349,602 |
| Events in quadrant D | 3,092,089 | 337,441 |
| Mode M9 | |||
|---|---|---|---|
| Quadrant | BADHDUFLAG | Total packets | Discarded packets |
| A | 0 | 26 | 0 |
| B | 0 | 26 | 0 |
| C | 0 | 26 | 0 |
| D | 0 | 26 | 0 |
| Mode SS | |||
|---|---|---|---|
| Quadrant | BADHDUFLAG | Total packets | Discarded packets |
| A | 0 | 120 | 0 |
| B | 0 | 120 | 0 |
| C | 0 | 120 | 0 |
| D | 0 | 120 | 0 |
| Mode M0 | |||
|---|---|---|---|
| Quadrant | BADHDUFLAG | Total packets | Discarded packets |
| A | 0 | 12169 | 3 |
| B | 0 | 12728 | 2 |
| C | 0 | 12870 | 2 |
| D | 0 | 13323 | 2 |
| Quadrant | Total seconds | Saturated seconds | Saturation percentage |
|---|---|---|---|
| A | 5809 | 19 | 0.327079% |
| B | 5809 | 75 | 1.291100% |
| C | 5809 | 65 | 1.118953% |
| D | 5809 | 100 | 1.721467% |
Noise dominated data is calculated using 1-second bins in cleaned event files. If a bin has >2000 counts, and if more than 50% of those come from <1% of pixels, then it is considered to be noise-dominated and hence unusable.
| Quadrant | # 1 sec bins | Bins with >0 counts | Bins with >2000 counts | High rate bins dominated by noise | Noise dominated (total time) | Noise dominated (detector-on time) | Marked lightcurve |
|---|---|---|---|---|---|---|---|
| A | 7242 | 5810 | 4 | 4 | 0.06% | 0.07% | 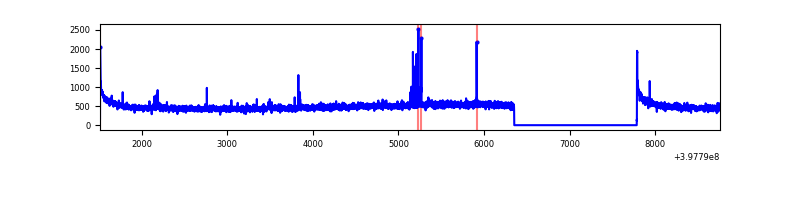 |
| B | 7242 | 5810 | 37 | 37 | 0.51% | 0.64% | 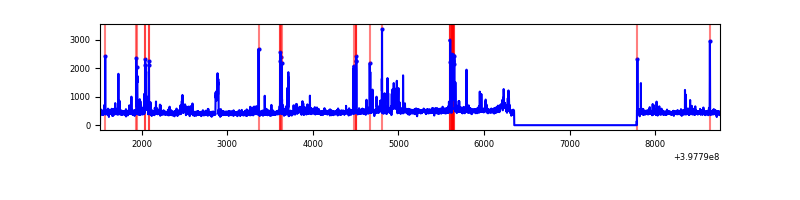 |
| C | 7242 | 5810 | 66 | 66 | 0.91% | 1.14% | 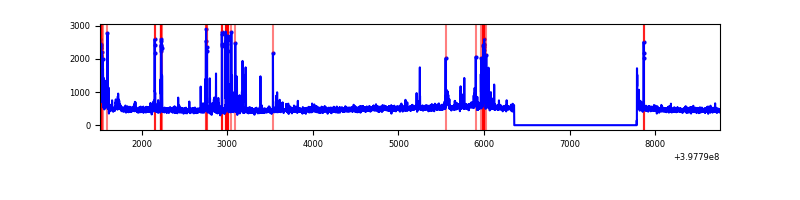 |
| D | 7242 | 5810 | 96 | 96 | 1.33% | 1.65% | 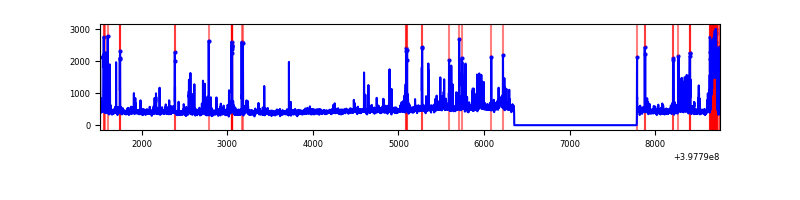 |
Top three noisy pixels from each quadrant. If the there are fewer than three noisy pixels in the level2.evt file, extra rows are filled as -1
| Pixel properties | Quadrant properties | ||||||
|---|---|---|---|---|---|---|---|
| Quadrant | DetID | PixID | Counts | Sigma | Mean | Median | Sigma |
| A | 10 | 83 | 273416 | 2037.89 | 658 | 644 | 133.8 |
| A | 15 | 237 | 24746 | 180.06 | 658 | 644 | 133.8 |
| A | 9 | 143 | 20455 | 148.01 | 658 | 644 | 133.8 |
| B | 5 | 200 | 194755 | 1529.77 | 653 | 634 | 126.9 |
| B | 5 | 184 | 65441 | 510.71 | 653 | 634 | 126.9 |
| B | 5 | 172 | 47275 | 367.55 | 653 | 634 | 126.9 |
| C | 14 | 254 | 283129 | 1868.19 | 640 | 644 | 151.2 |
| C | 15 | 214 | 250211 | 1650.49 | 640 | 644 | 151.2 |
| C | 0 | 10 | 77519 | 508.4 | 640 | 644 | 151.2 |
| D | 2 | 250 | 203234 | 1290.22 | 637 | 621 | 157.0 |
| D | 13 | 249 | 144734 | 917.7 | 637 | 621 | 157.0 |
| D | 12 | 17 | 135715 | 860.26 | 637 | 621 | 157.0 |
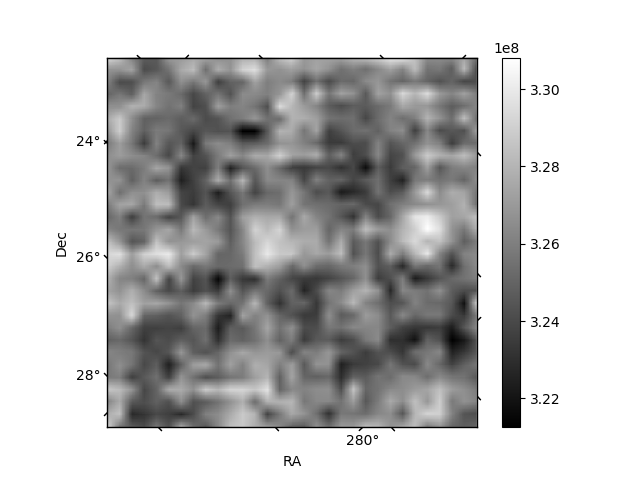
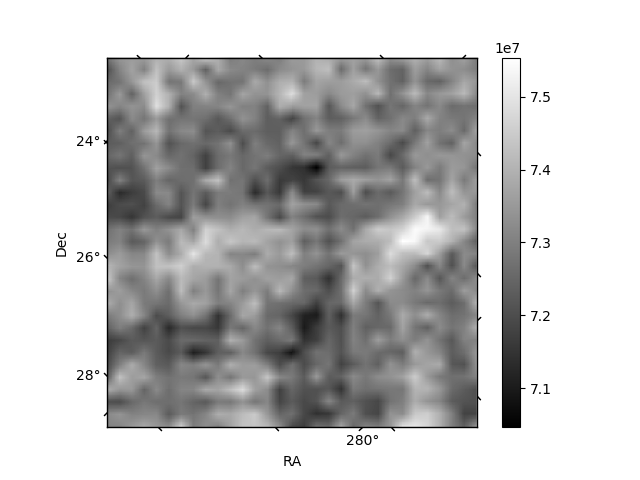
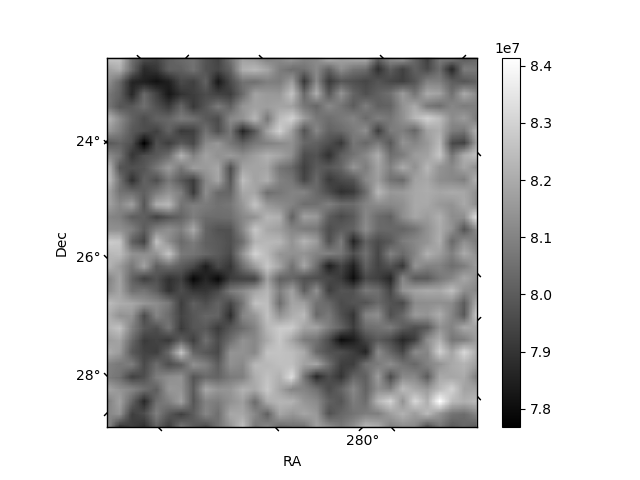
Histogram calculated using DETX and DETY for each event in the final _common_clean file
| Quadrant A | 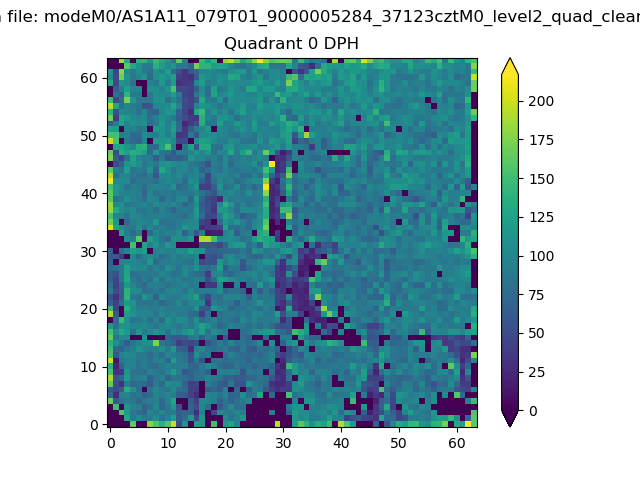 |
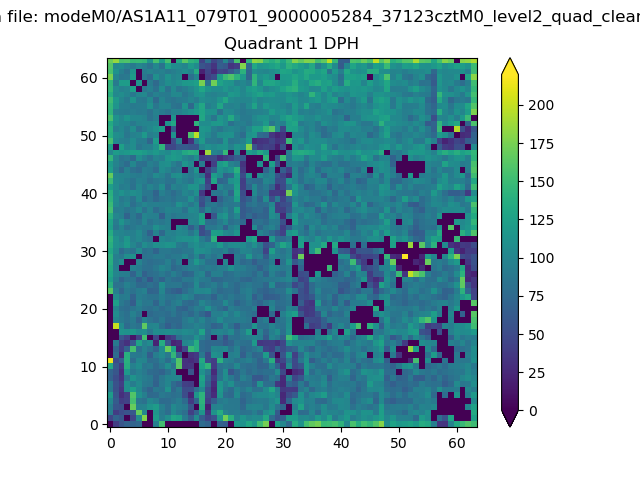 |
Quadrant B |
|---|---|---|---|
| Quadrant D | 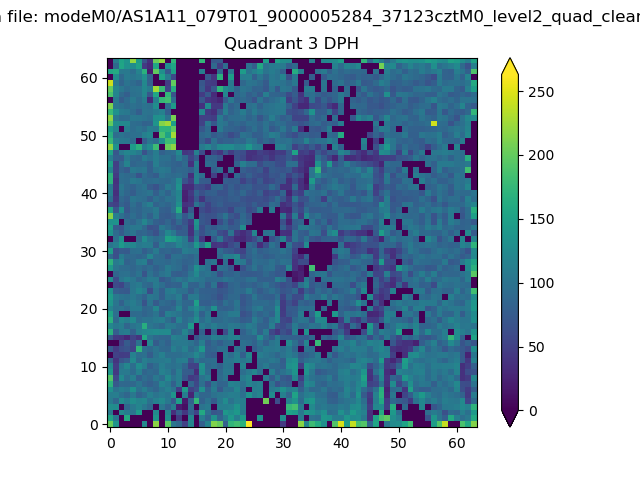 |
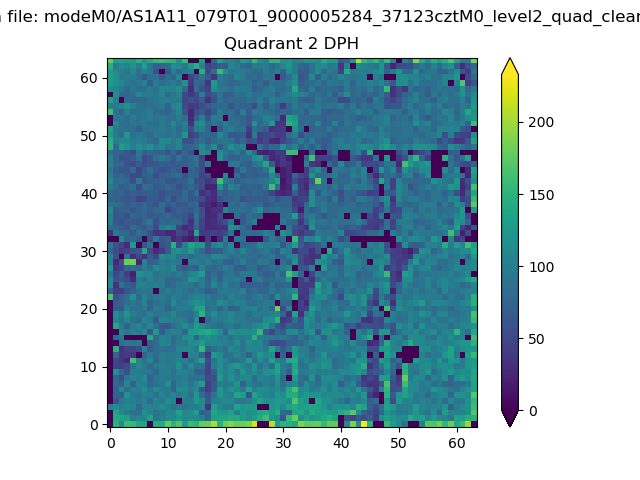 |
Quadrant C |
| Plot type | Count rate plots | Images |
|---|---|---|
| Comparison with Poisson distribution Blue bars denote a histogram of data divided into 1 sec bins. Red curve is a Poisson curve with rate = median count rate of data. |
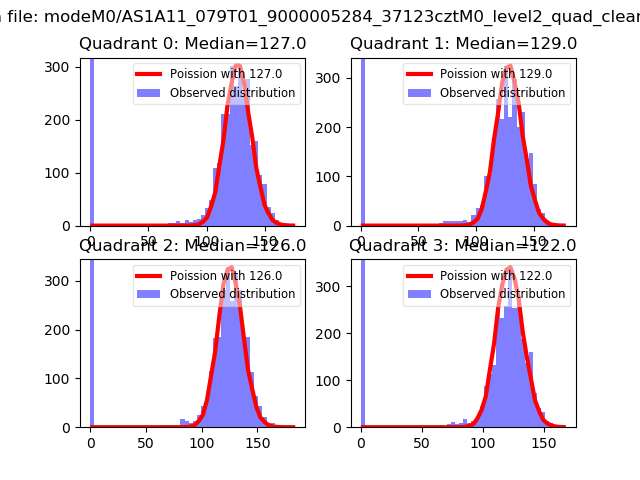 |
 |
| Quadrant-wise count rates Data is divided into 100 sec bins |
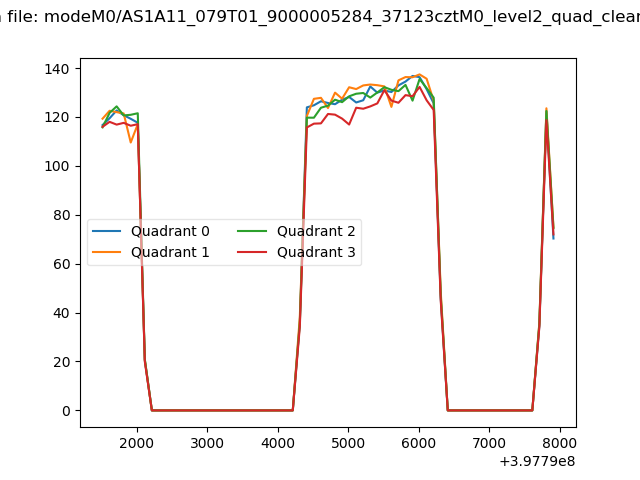 |
|
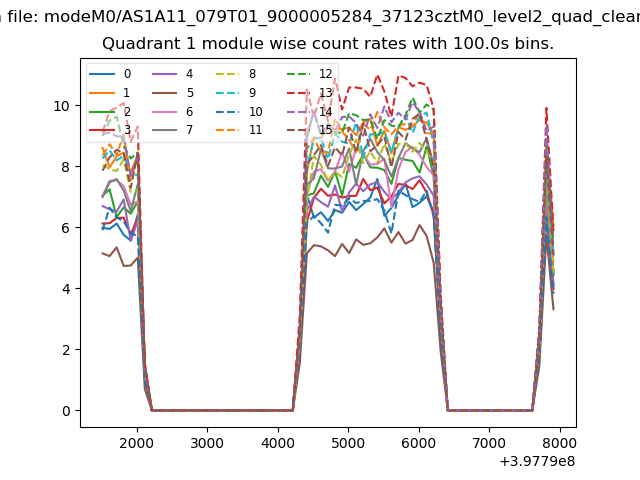
| Module-wise count rates for Quadrant A Data is divided into 100 sec bins |
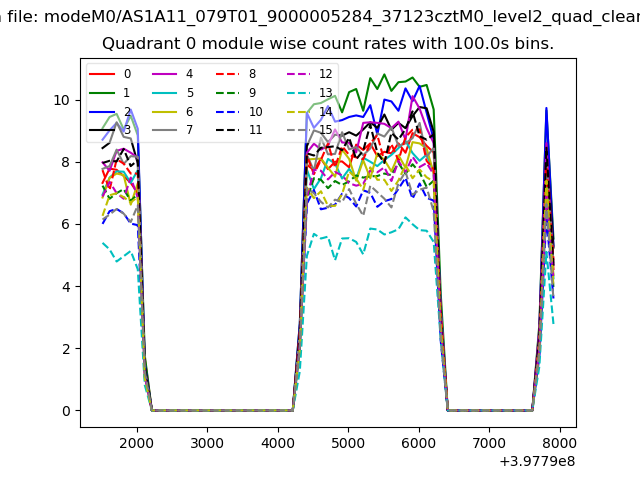 |
 |
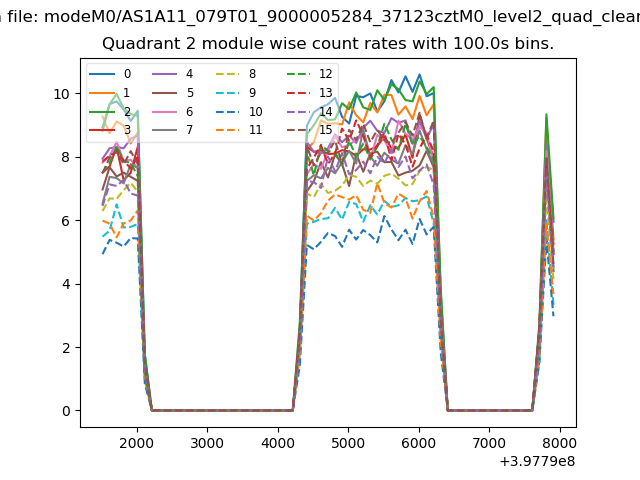
| Module-wise count rates for Quadrant B Data is divided into 100 sec bins |
 |
 |
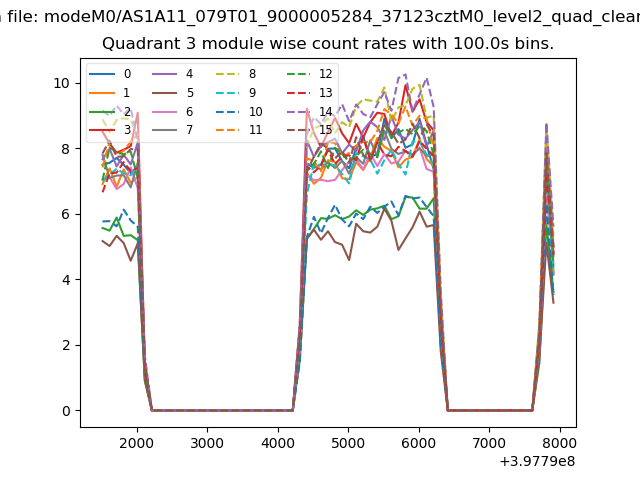
| Module-wise count rates for Quadrant C Data is divided into 100 sec bins |
 |
 |
| Module-wise count rates for Quadrant D Data is divided into 100 sec bins |
 |
 |
| Parameter | Plot |
|---|---|
| CZT HV Monitor | 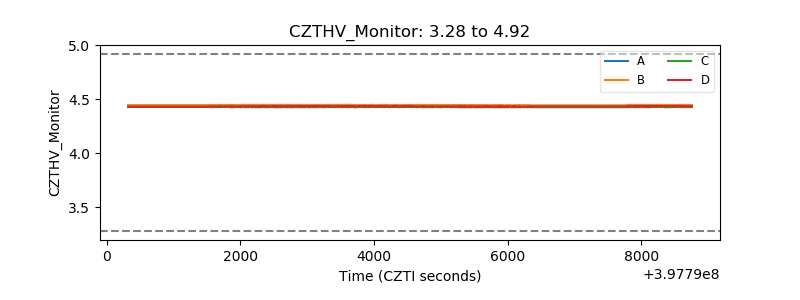 |
| D_VDD | 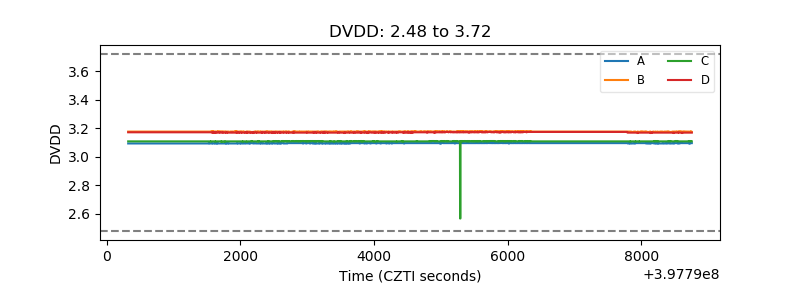 |
| Temperature 1 | 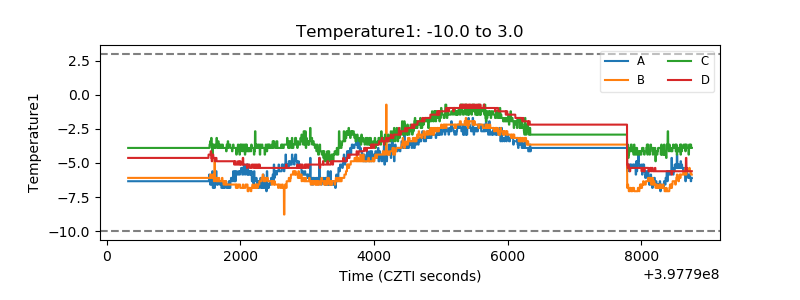 |
| Veto HV Monitor | 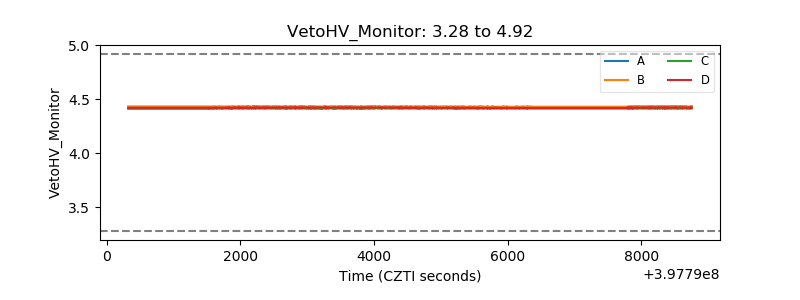 |
| Veto LLD | 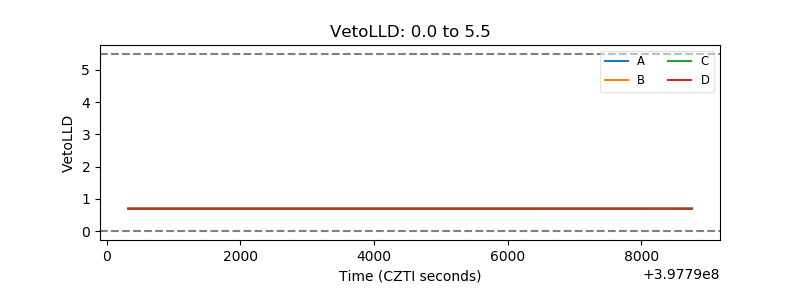 |
| Alpha Counter | 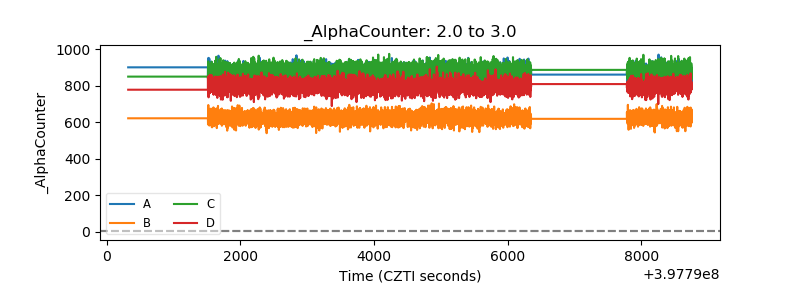 |
| _CPM_Rate | 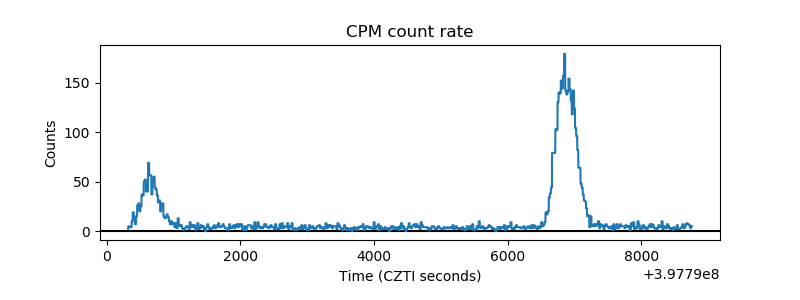 |
| CZT Counter | 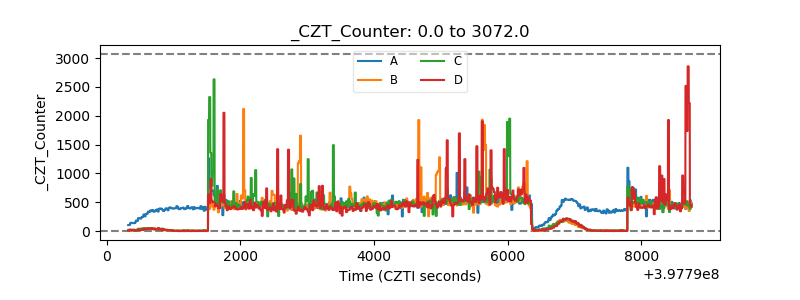 |
| +2.5 Volts monitor | 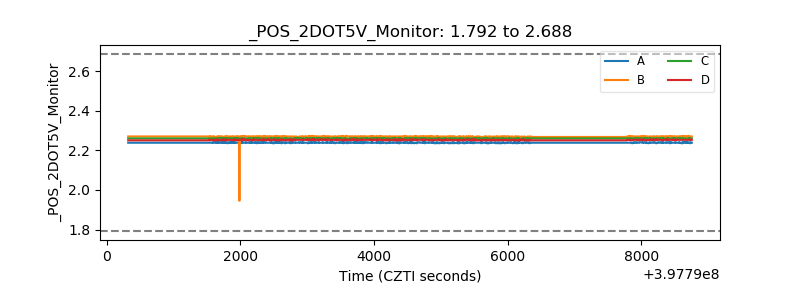 |
| +5 Volts monitor | 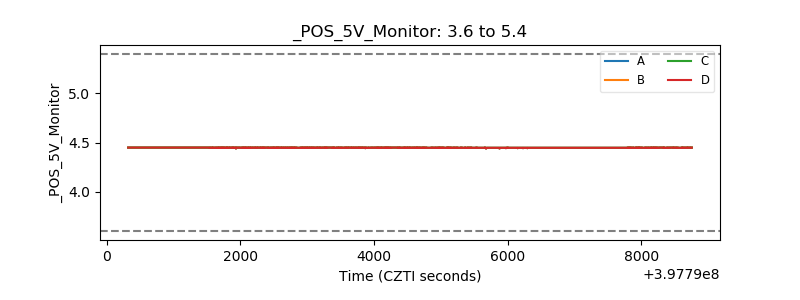 |
| _ROLL_ROT |  |
| _Roll_DEC | 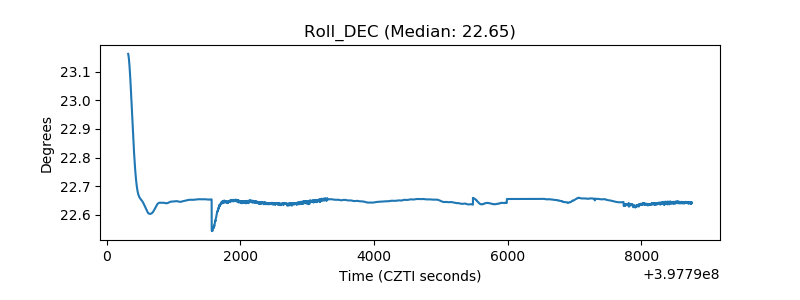 |
| _Roll_RA | 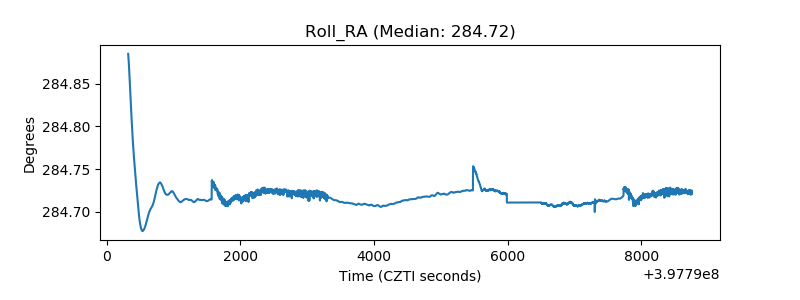 |
| Veto Counter |  |