| Param | Original file | Final file |
|---|---|---|
| Filename | modeM0/AS1A11_079T01_9000005284_37124cztM0_level2.evt | modeM0/AS1A11_079T01_9000005284_37124cztM0_level2_quad_clean.evt |
| Size (bytes) | 505,494,720 | 66,971,520 |
| Size | 482.1 MB | 63.9 MB |
| Events in quadrant A | 3,522,031 | 398,477 |
| Events in quadrant B | 3,229,952 | 403,673 |
| Events in quadrant C | 3,317,580 | 400,361 |
| Events in quadrant D | 4,807,266 | 380,989 |
| Mode M9 | |||
|---|---|---|---|
| Quadrant | BADHDUFLAG | Total packets | Discarded packets |
| A | 0 | 30 | 0 |
| B | 0 | 30 | 0 |
| C | 0 | 30 | 0 |
| D | 0 | 30 | 0 |
| Mode SS | |||
|---|---|---|---|
| Quadrant | BADHDUFLAG | Total packets | Discarded packets |
| A | 0 | 132 | 0 |
| B | 0 | 132 | 0 |
| C | 0 | 132 | 0 |
| D | 0 | 132 | 0 |
| Mode M0 | |||
|---|---|---|---|
| Quadrant | BADHDUFLAG | Total packets | Discarded packets |
| A | 0 | 14365 | 3 |
| B | 0 | 13794 | 2 |
| C | 0 | 13619 | 2 |
| D | 0 | 18590 | 2 |
| Quadrant | Total seconds | Saturated seconds | Saturation percentage |
|---|---|---|---|
| A | 6363 | 121 | 1.901619% |
| B | 6363 | 52 | 0.817225% |
| C | 6363 | 45 | 0.707214% |
| D | 6363 | 522 | 8.203678% |
Noise dominated data is calculated using 1-second bins in cleaned event files. If a bin has >2000 counts, and if more than 50% of those come from <1% of pixels, then it is considered to be noise-dominated and hence unusable.
| Quadrant | # 1 sec bins | Bins with >0 counts | Bins with >2000 counts | High rate bins dominated by noise | Noise dominated (total time) | Noise dominated (detector-on time) | Marked lightcurve |
|---|---|---|---|---|---|---|---|
| A | 9349 | 6365 | 112 | 112 | 1.20% | 1.76% | 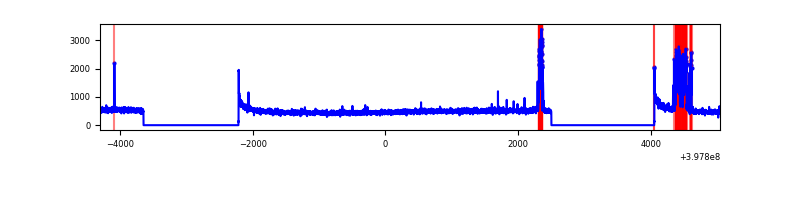 |
| B | 9349 | 6365 | 26 | 26 | 0.28% | 0.41% | 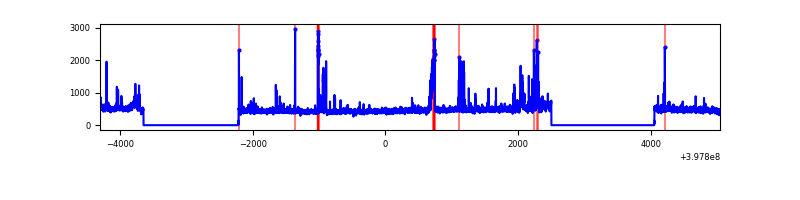 |
| C | 9349 | 6365 | 40 | 40 | 0.43% | 0.63% | 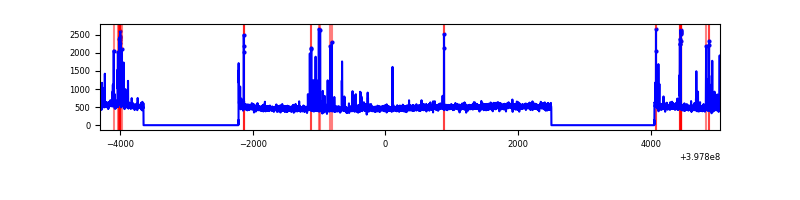 |
| D | 9349 | 6365 | 533 | 533 | 5.70% | 8.37% | 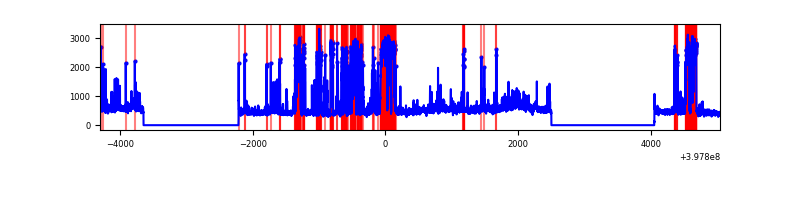 |
Top three noisy pixels from each quadrant. If the there are fewer than three noisy pixels in the level2.evt file, extra rows are filled as -1
| Pixel properties | Quadrant properties | ||||||
|---|---|---|---|---|---|---|---|
| Quadrant | DetID | PixID | Counts | Sigma | Mean | Median | Sigma |
| A | 10 | 83 | 288378 | 1940.76 | 730 | 716 | 148.2 |
| A | 15 | 174 | 239694 | 1612.31 | 730 | 716 | 148.2 |
| A | 15 | 237 | 127588 | 855.97 | 730 | 716 | 148.2 |
| B | 5 | 184 | 174992 | 1234.13 | 728 | 709 | 141.2 |
| B | 5 | 255 | 89400 | 628.04 | 728 | 709 | 141.2 |
| B | 5 | 172 | 53860 | 376.37 | 728 | 709 | 141.2 |
| C | 15 | 214 | 274099 | 1642.63 | 715 | 720 | 166.4 |
| C | 14 | 254 | 214230 | 1282.9 | 715 | 720 | 166.4 |
| C | 0 | 10 | 34866 | 205.17 | 715 | 720 | 166.4 |
| D | 12 | 17 | 1325046 | 7824.63 | 691 | 675 | 169.3 |
| D | 2 | 250 | 392915 | 2317.43 | 691 | 675 | 169.3 |
| D | 12 | 235 | 182061 | 1071.66 | 691 | 675 | 169.3 |
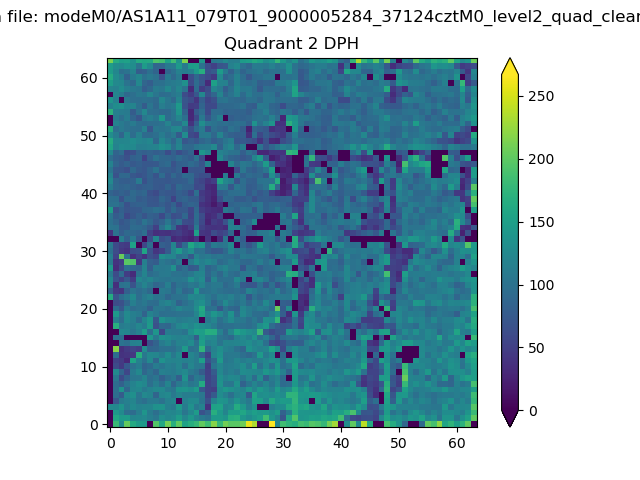
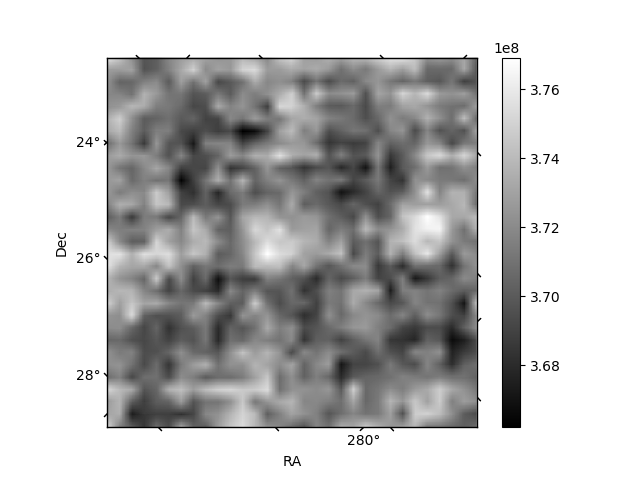
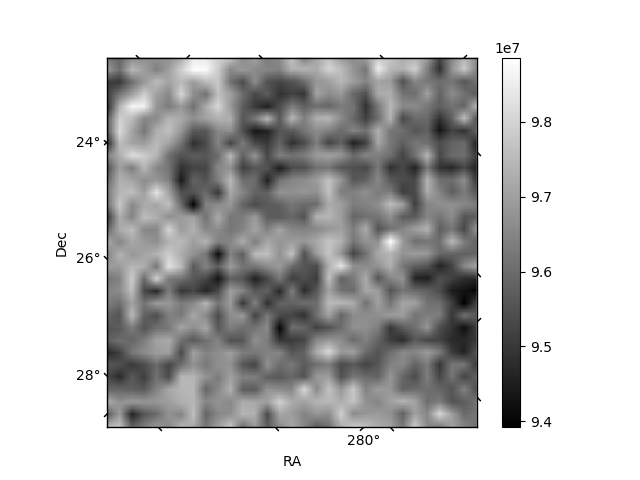
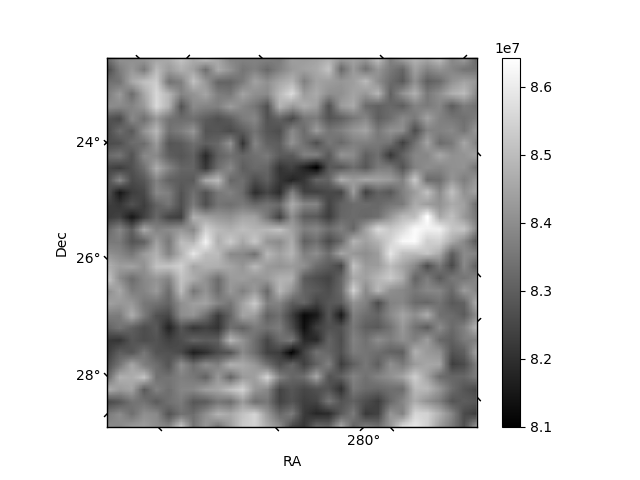
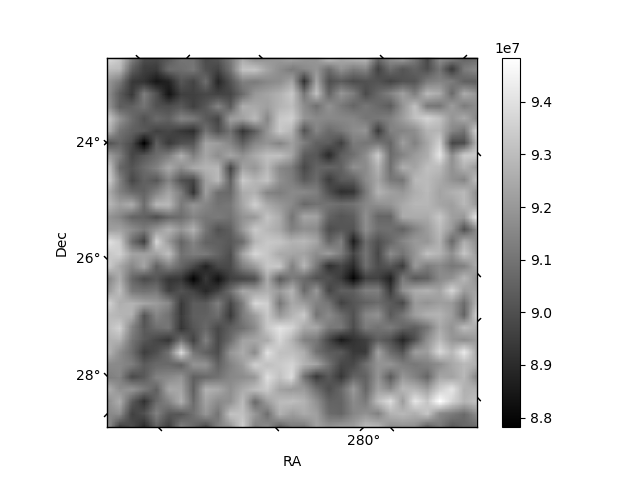
Histogram calculated using DETX and DETY for each event in the final _common_clean file
| Quadrant A | 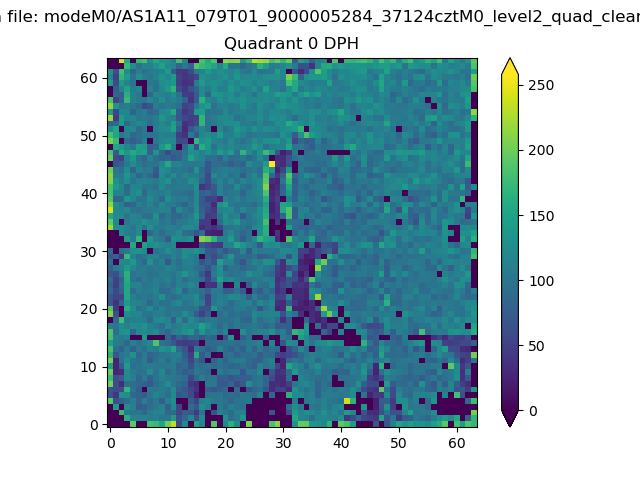 |
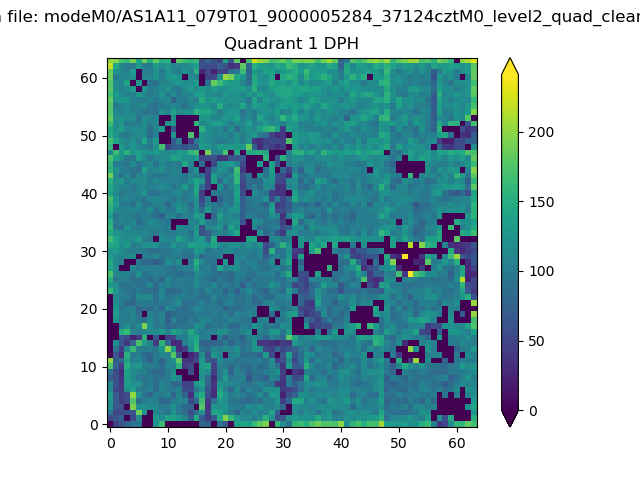 |
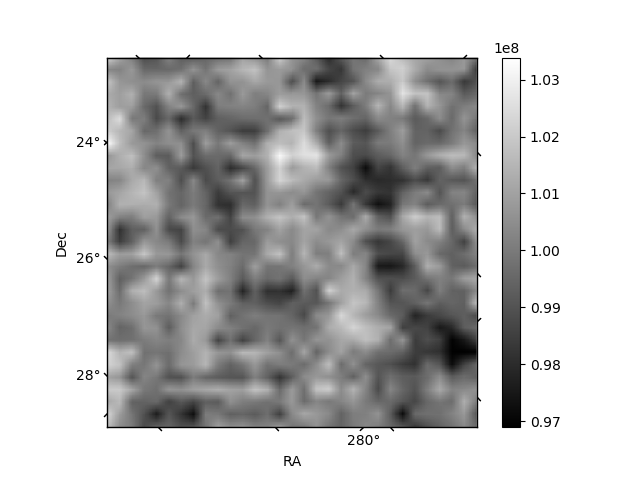
Quadrant B |
|---|---|---|---|
| Quadrant D | 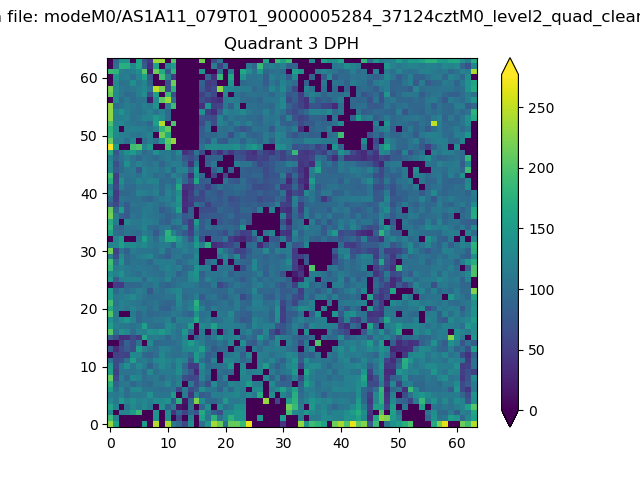 |
 |
Quadrant C |
| Plot type | Count rate plots | Images |
|---|---|---|
| Comparison with Poisson distribution Blue bars denote a histogram of data divided into 1 sec bins. Red curve is a Poisson curve with rate = median count rate of data. |
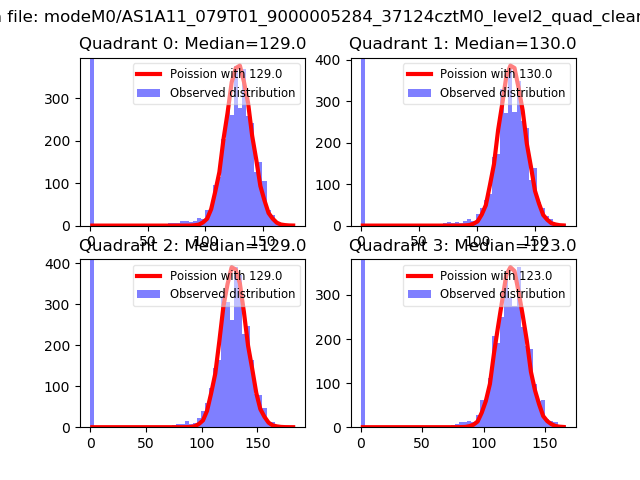 |
 |
| Quadrant-wise count rates Data is divided into 100 sec bins |
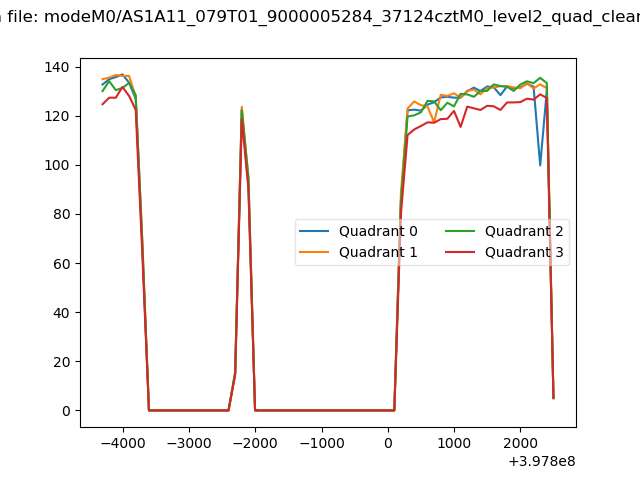 |
|
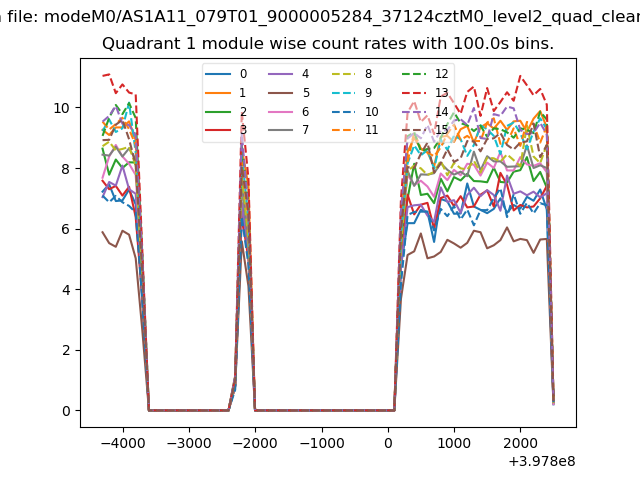
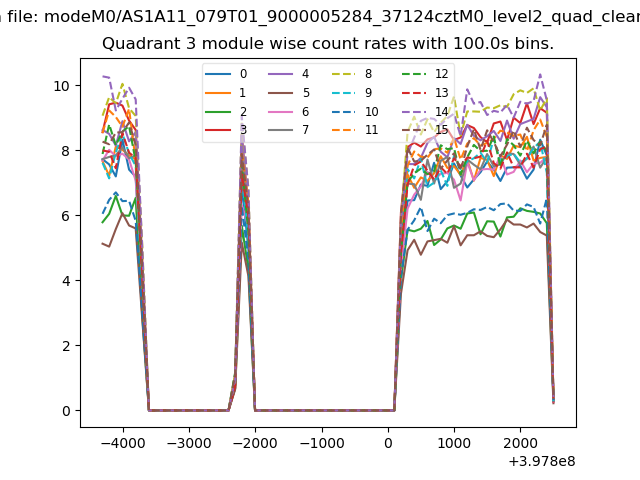
| Module-wise count rates for Quadrant A Data is divided into 100 sec bins |
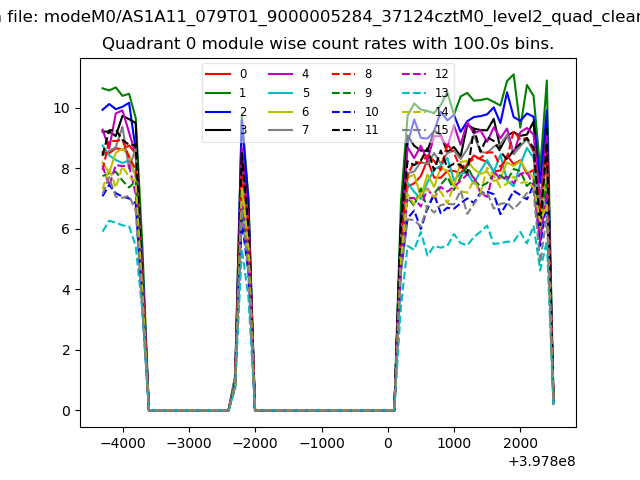 |
 |
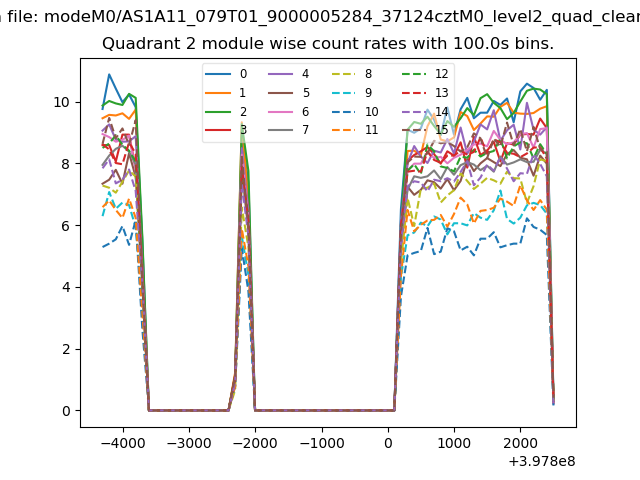
| Module-wise count rates for Quadrant B Data is divided into 100 sec bins |
 |
 |
| Module-wise count rates for Quadrant C Data is divided into 100 sec bins |
 |
 |
| Module-wise count rates for Quadrant D Data is divided into 100 sec bins |
 |
 |
| Parameter | Plot |
|---|---|
| CZT HV Monitor | 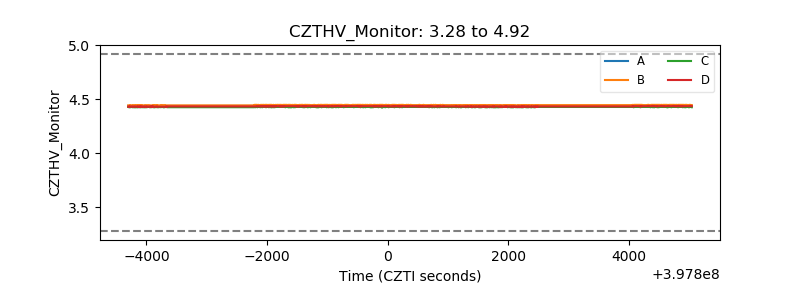 |
| D_VDD | 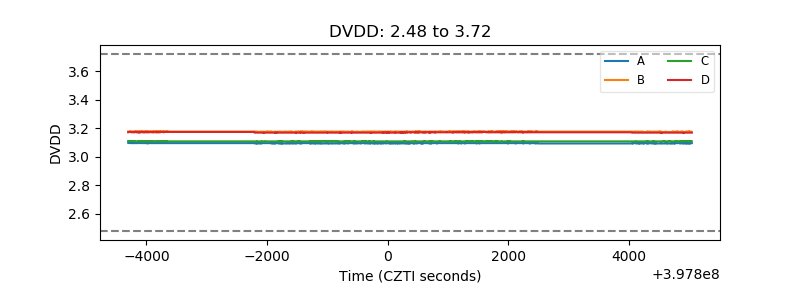 |
| Temperature 1 | 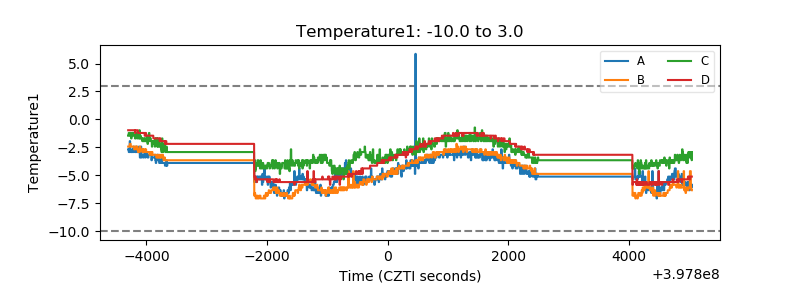 |
| Veto HV Monitor | 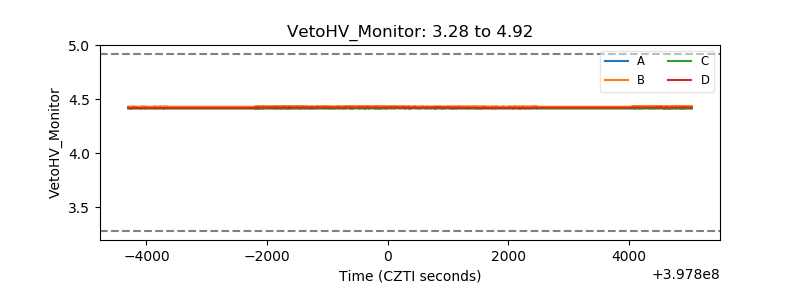 |
| Veto LLD | 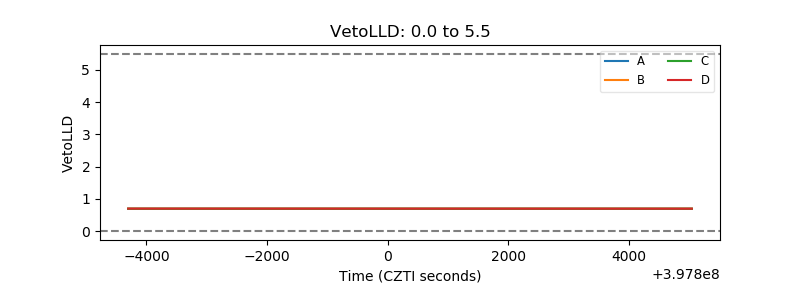 |
| Alpha Counter | 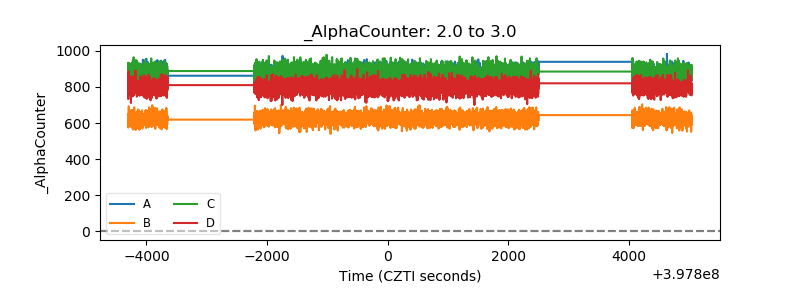 |
| _CPM_Rate | 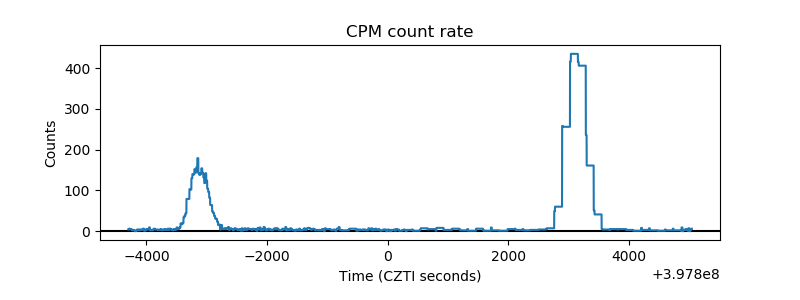 |
| CZT Counter | 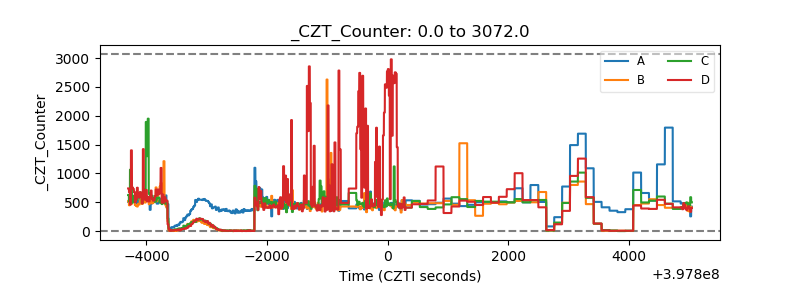 |
| +2.5 Volts monitor | 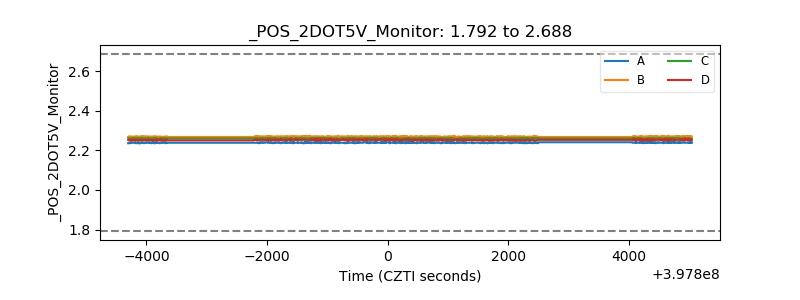 |
| +5 Volts monitor | 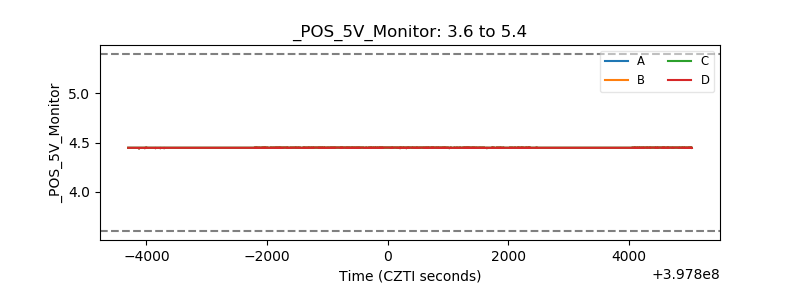 |
| _ROLL_ROT | 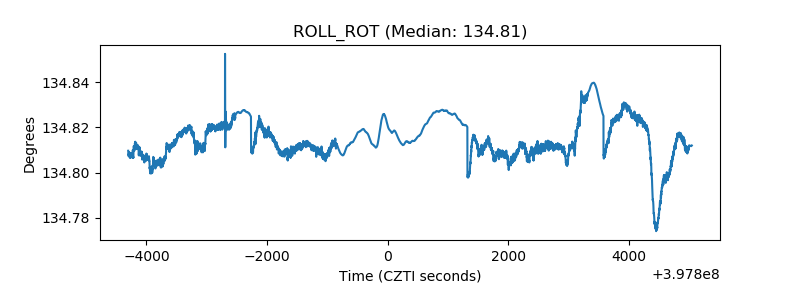 |
| _Roll_DEC | 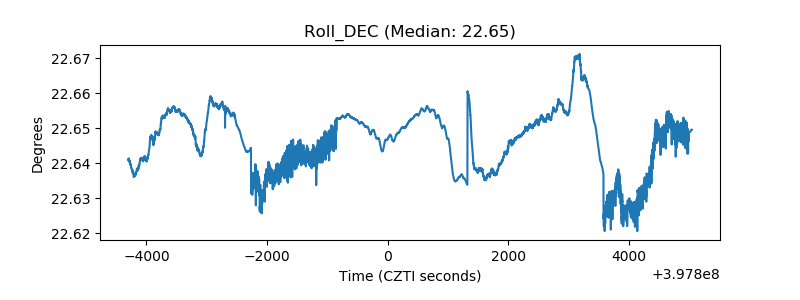 |
| _Roll_RA | 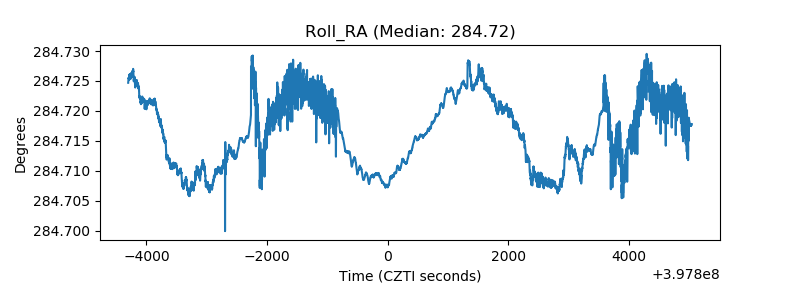 |
| Veto Counter | 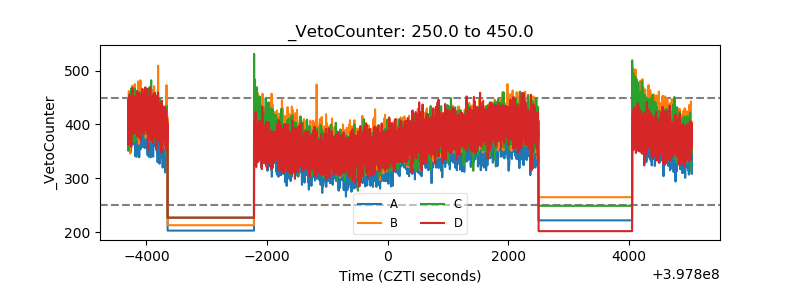 |