| Param | Original file | Final file |
|---|---|---|
| Filename | modeM0/AS1A11_079T01_9000005284_37125cztM0_level2.evt | modeM0/AS1A11_079T01_9000005284_37125cztM0_level2_quad_clean.evt |
| Size (bytes) | 452,381,760 | 55,537,920 |
| Size | 431.4 MB | 53.0 MB |
| Events in quadrant A | 3,036,745 | 330,913 |
| Events in quadrant B | 2,914,192 | 328,658 |
| Events in quadrant C | 3,309,328 | 326,523 |
| Events in quadrant D | 4,064,841 | 308,662 |
| Mode M9 | |||
|---|---|---|---|
| Quadrant | BADHDUFLAG | Total packets | Discarded packets |
| A | 0 | 27 | 0 |
| B | 0 | 27 | 0 |
| C | 0 | 27 | 0 |
| D | 0 | 28 | 0 |
| Mode SS | |||
|---|---|---|---|
| Quadrant | BADHDUFLAG | Total packets | Discarded packets |
| A | 0 | 112 | 0 |
| B | 0 | 112 | 0 |
| C | 0 | 112 | 0 |
| D | 0 | 112 | 0 |
| Mode M0 | |||
|---|---|---|---|
| Quadrant | BADHDUFLAG | Total packets | Discarded packets |
| A | 0 | 12390 | 3 |
| B | 0 | 12212 | 2 |
| C | 0 | 13190 | 2 |
| D | 0 | 15724 | 2 |
| Quadrant | Total seconds | Saturated seconds | Saturation percentage |
|---|---|---|---|
| A | 5527 | 75 | 1.356975% |
| B | 5527 | 91 | 1.646463% |
| C | 5527 | 113 | 2.044509% |
| D | 5527 | 480 | 8.684639% |
Noise dominated data is calculated using 1-second bins in cleaned event files. If a bin has >2000 counts, and if more than 50% of those come from <1% of pixels, then it is considered to be noise-dominated and hence unusable.
| Quadrant | # 1 sec bins | Bins with >0 counts | Bins with >2000 counts | High rate bins dominated by noise | Noise dominated (total time) | Noise dominated (detector-on time) | Marked lightcurve |
|---|---|---|---|---|---|---|---|
| A | 7200 | 5528 | 75 | 75 | 1.04% | 1.36% | 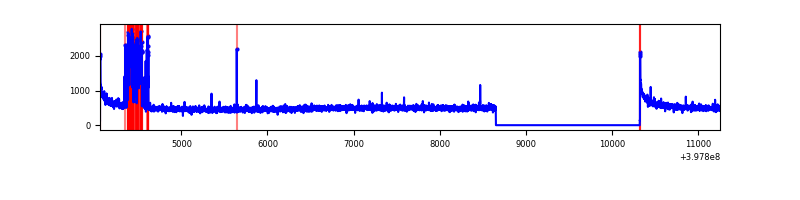 |
| B | 7200 | 5528 | 57 | 57 | 0.79% | 1.03% | 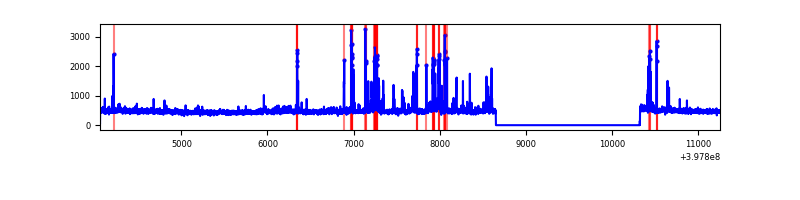 |
| C | 7200 | 5528 | 99 | 99 | 1.38% | 1.79% | 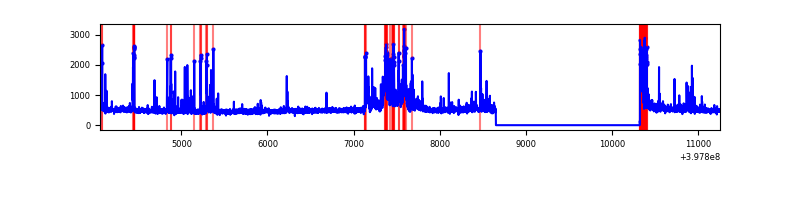 |
| D | 7200 | 5528 | 477 | 477 | 6.62% | 8.63% | 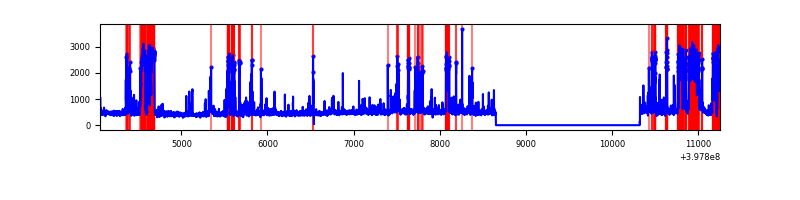 |
Top three noisy pixels from each quadrant. If the there are fewer than three noisy pixels in the level2.evt file, extra rows are filled as -1
| Pixel properties | Quadrant properties | ||||||
|---|---|---|---|---|---|---|---|
| Quadrant | DetID | PixID | Counts | Sigma | Mean | Median | Sigma |
| A | 10 | 83 | 257680 | 1956.73 | 643 | 629 | 131.4 |
| A | 15 | 174 | 236793 | 1797.73 | 643 | 629 | 131.4 |
| A | 9 | 143 | 43552 | 326.74 | 643 | 629 | 131.4 |
| B | 5 | 172 | 265333 | 2155.44 | 635 | 619 | 122.8 |
| B | 5 | 184 | 73589 | 594.16 | 635 | 619 | 122.8 |
| B | 0 | 229 | 35187 | 281.47 | 635 | 619 | 122.8 |
| C | 14 | 254 | 555533 | 3833.42 | 619 | 623 | 144.8 |
| C | 15 | 214 | 239607 | 1650.94 | 619 | 623 | 144.8 |
| C | 0 | 10 | 95179 | 653.21 | 619 | 623 | 144.8 |
| D | 12 | 17 | 1123910 | 7616.72 | 602 | 585 | 147.5 |
| D | 13 | 249 | 239546 | 1620.28 | 602 | 585 | 147.5 |
| D | 2 | 250 | 118560 | 799.93 | 602 | 585 | 147.5 |
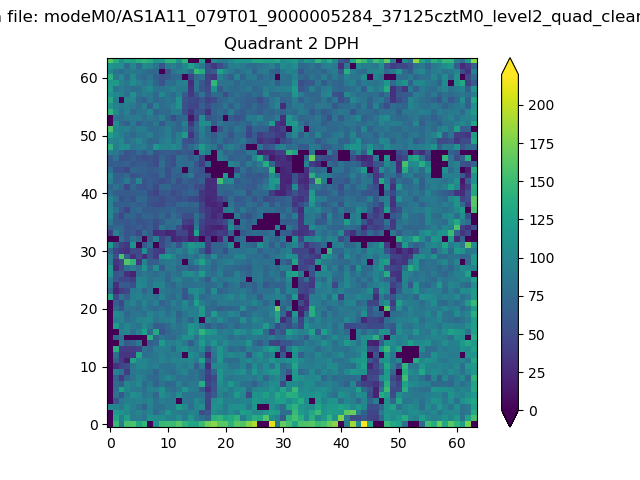
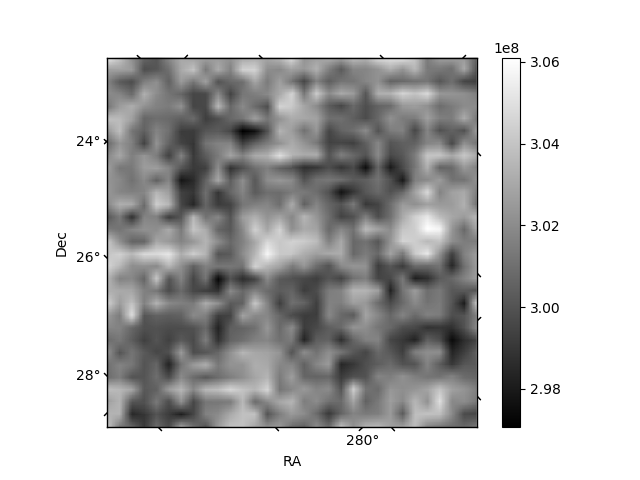
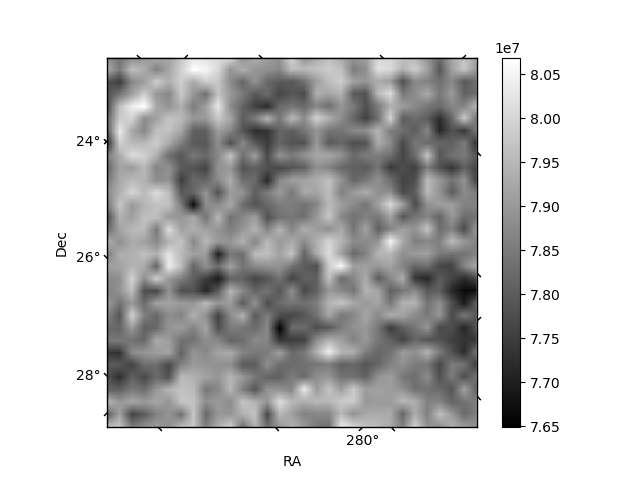
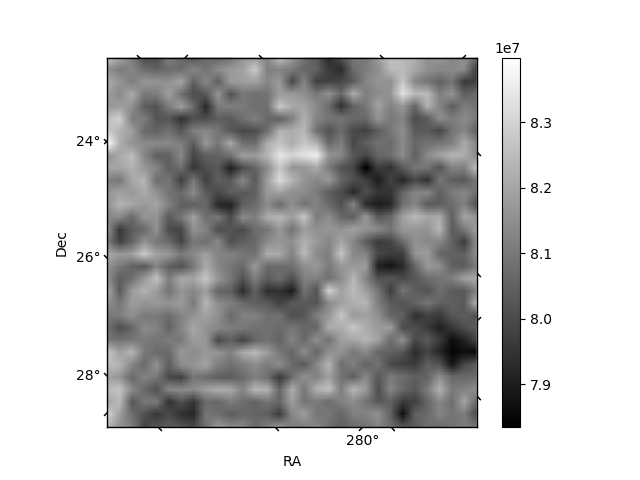
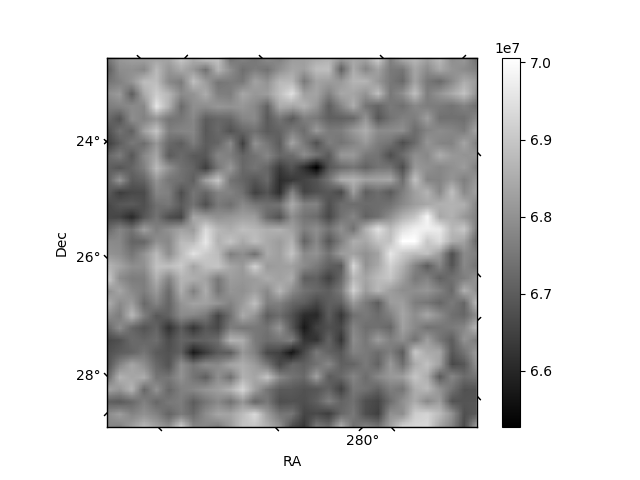
Histogram calculated using DETX and DETY for each event in the final _common_clean file
| Quadrant A | 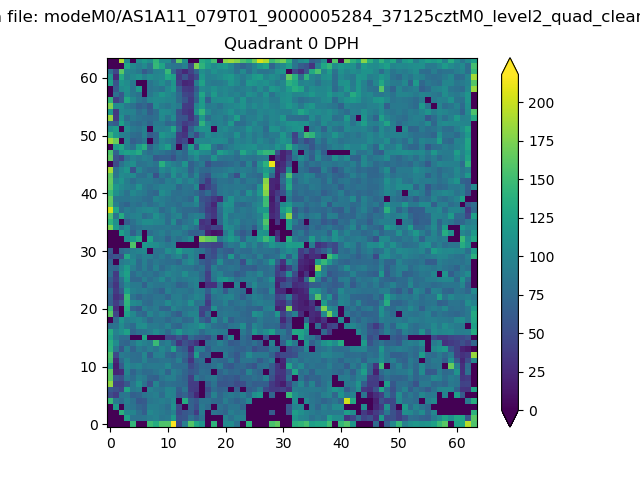 |
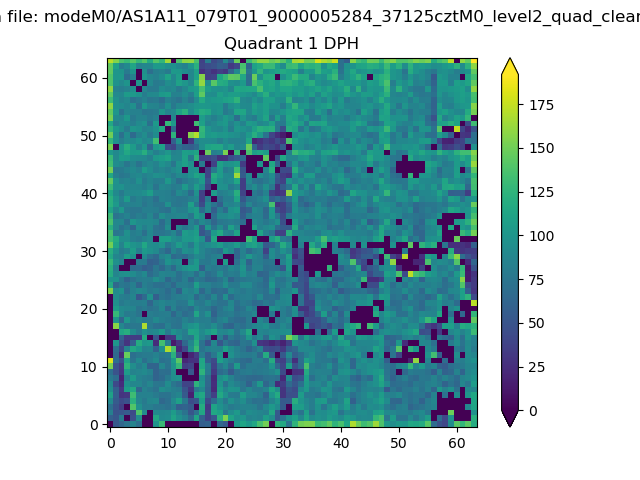 |
Quadrant B |
|---|---|---|---|
| Quadrant D | 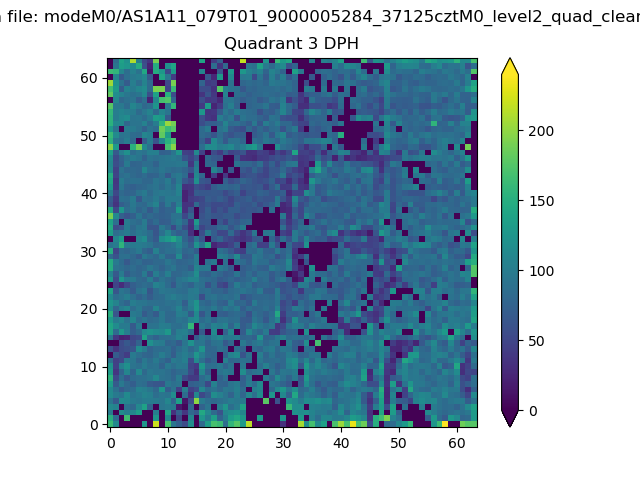 |
 |
Quadrant C |
| Plot type | Count rate plots | Images |
|---|---|---|
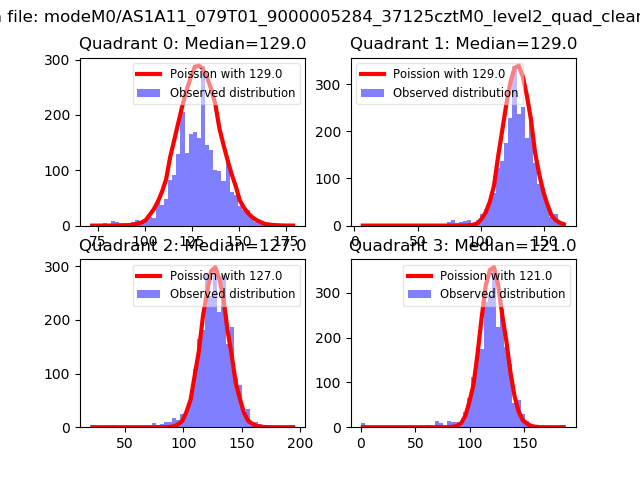
| Comparison with Poisson distribution Blue bars denote a histogram of data divided into 1 sec bins. Red curve is a Poisson curve with rate = median count rate of data. |
 |
 |
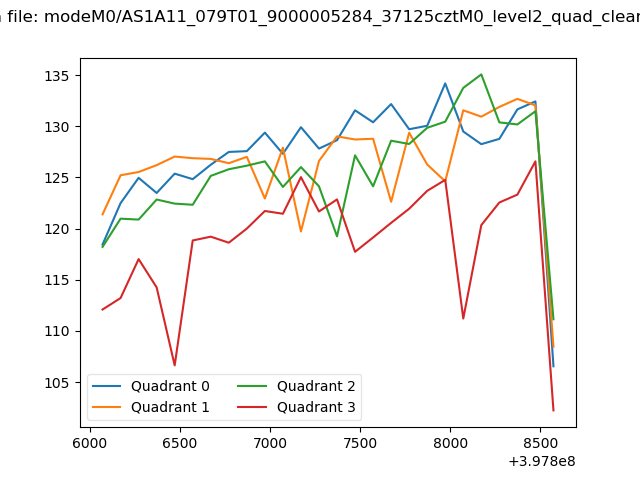
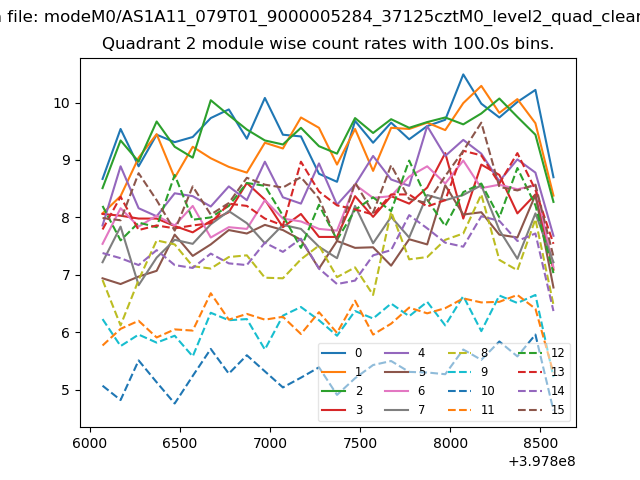
| Quadrant-wise count rates Data is divided into 100 sec bins |
 |
|
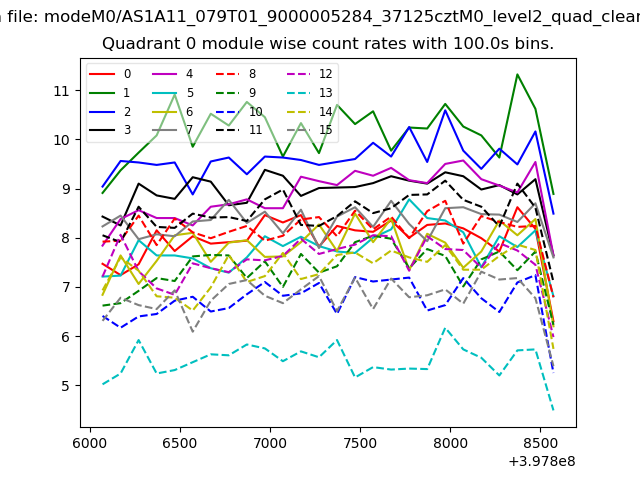
| Module-wise count rates for Quadrant A Data is divided into 100 sec bins |
 |
 |
| Module-wise count rates for Quadrant B Data is divided into 100 sec bins |
 |
 |
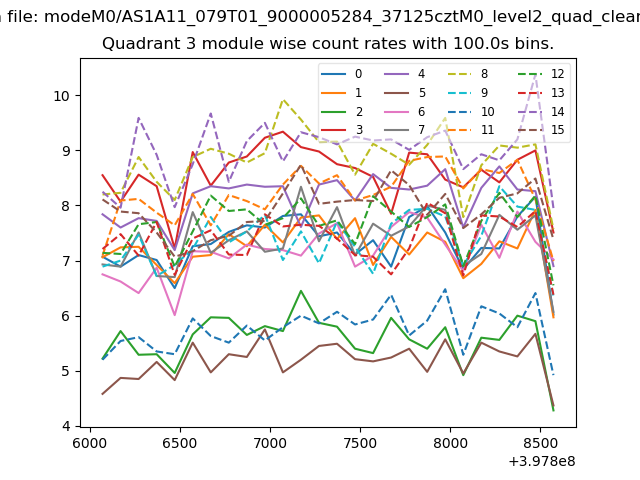
| Module-wise count rates for Quadrant C Data is divided into 100 sec bins |
 |
 |
| Module-wise count rates for Quadrant D Data is divided into 100 sec bins |
 |
 |
| Parameter | Plot |
|---|---|
| CZT HV Monitor |  |
| D_VDD | 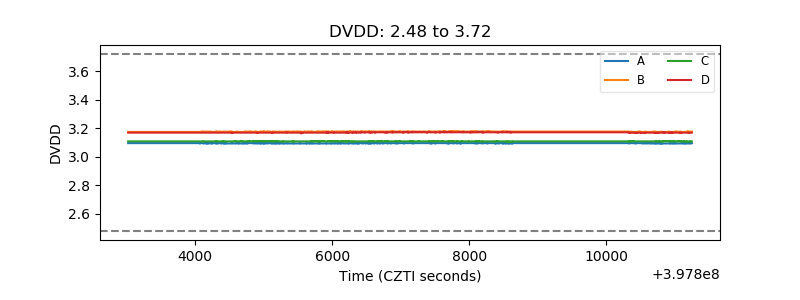 |
| Temperature 1 | 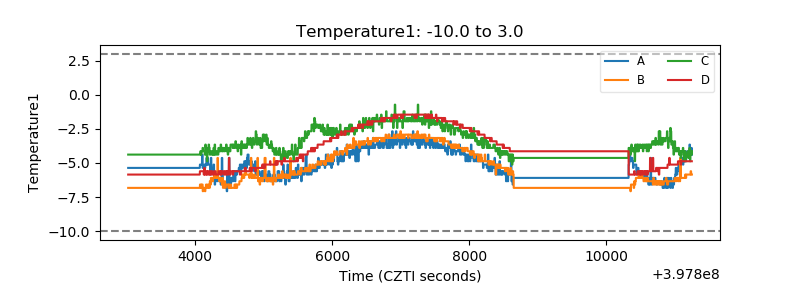 |
| Veto HV Monitor | 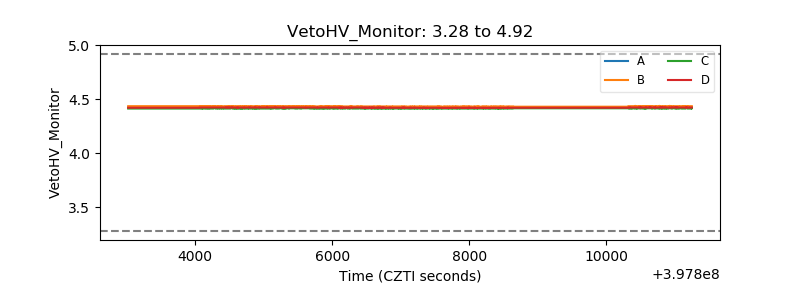 |
| Veto LLD | 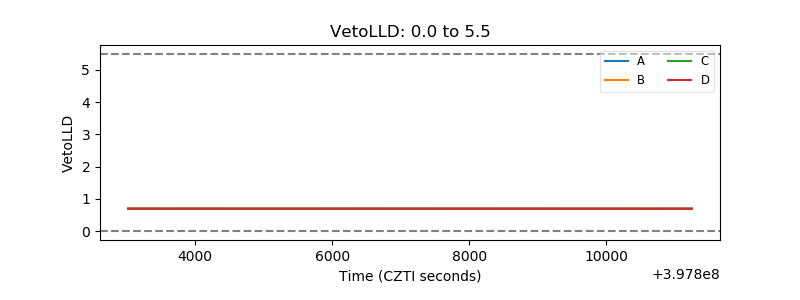 |
| Alpha Counter | 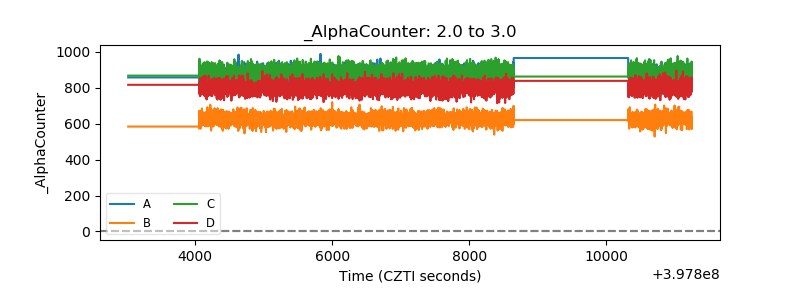 |
| _CPM_Rate | 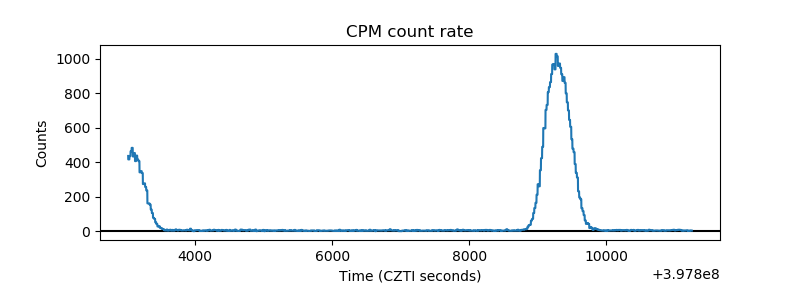 |
| CZT Counter | 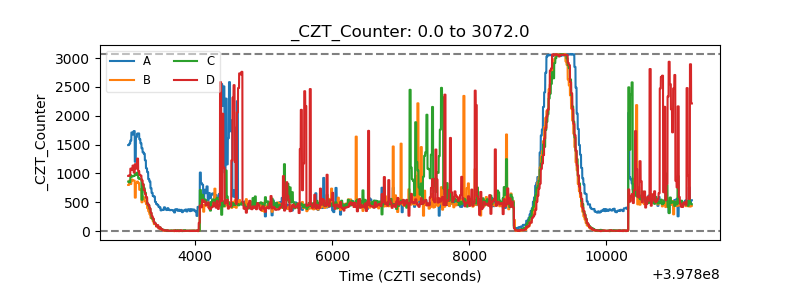 |
| +2.5 Volts monitor | 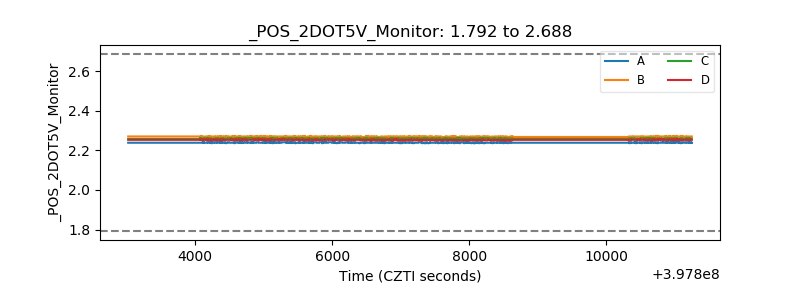 |
| +5 Volts monitor | 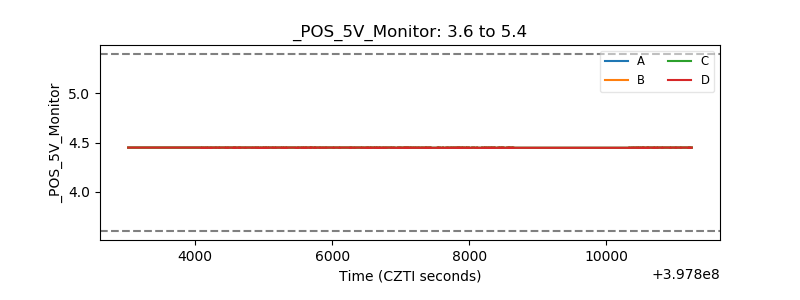 |
| _ROLL_ROT | 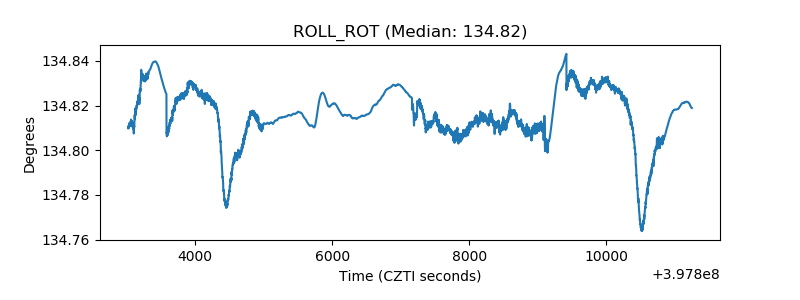 |
| _Roll_DEC | 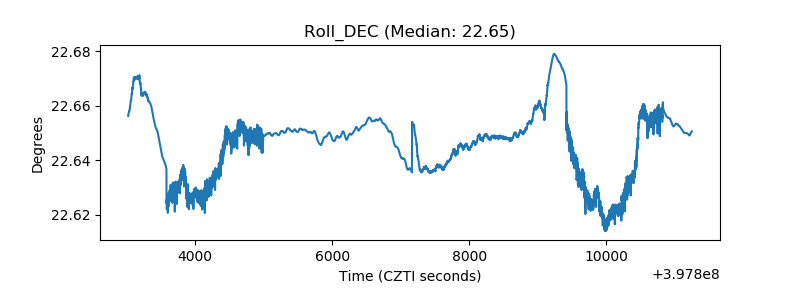 |
| _Roll_RA | 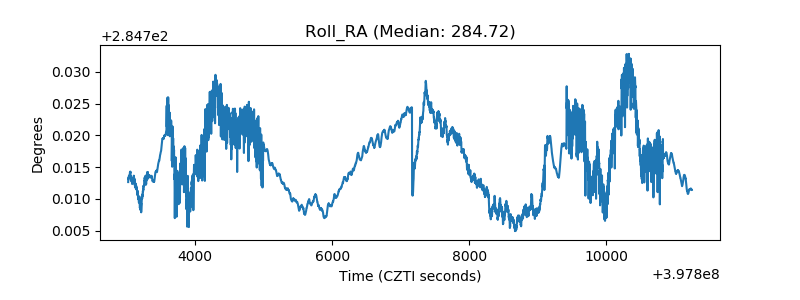 |
| Veto Counter | 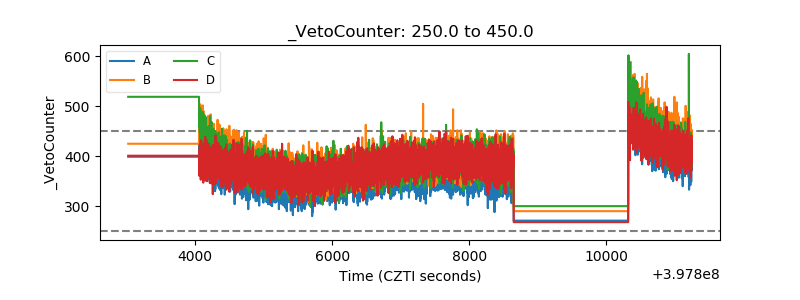 |