| Param | Original file | Final file |
|---|---|---|
| Filename | modeM0/AS1A11_079T01_9000005284_37127cztM0_level2.evt | modeM0/AS1A11_079T01_9000005284_37127cztM0_level2_quad_clean.evt |
| Size (bytes) | 457,018,560 | 66,458,880 |
| Size | 435.8 MB | 63.4 MB |
| Events in quadrant A | 2,889,994 | 414,355 |
| Events in quadrant B | 3,469,809 | 408,812 |
| Events in quadrant C | 3,090,984 | 410,565 |
| Events in quadrant D | 4,011,261 | 388,324 |
| Mode M9 | |||
|---|---|---|---|
| Quadrant | BADHDUFLAG | Total packets | Discarded packets |
| A | 0 | 35 | 0 |
| B | 0 | 35 | 0 |
| C | 0 | 35 | 0 |
| D | 0 | 35 | 0 |
| Mode SS | |||
|---|---|---|---|
| Quadrant | BADHDUFLAG | Total packets | Discarded packets |
| A | 0 | 114 | 0 |
| B | 0 | 114 | 0 |
| C | 0 | 114 | 0 |
| D | 0 | 114 | 0 |
| Mode M0 | |||
|---|---|---|---|
| Quadrant | BADHDUFLAG | Total packets | Discarded packets |
| A | 0 | 11888 | 3 |
| B | 0 | 13901 | 2 |
| C | 0 | 12362 | 2 |
| D | 0 | 15461 | 2 |
| Quadrant | Total seconds | Saturated seconds | Saturation percentage |
|---|---|---|---|
| A | 5582 | 9 | 0.161233% |
| B | 5582 | 179 | 3.206736% |
| C | 5582 | 84 | 1.504837% |
| D | 5582 | 362 | 6.485131% |
Noise dominated data is calculated using 1-second bins in cleaned event files. If a bin has >2000 counts, and if more than 50% of those come from <1% of pixels, then it is considered to be noise-dominated and hence unusable.
| Quadrant | # 1 sec bins | Bins with >0 counts | Bins with >2000 counts | High rate bins dominated by noise | Noise dominated (total time) | Noise dominated (detector-on time) | Marked lightcurve |
|---|---|---|---|---|---|---|---|
| A | 9078 | 5584 | 3 | 3 | 0.03% | 0.05% |  |
| B | 9078 | 5584 | 123 | 123 | 1.35% | 2.20% | 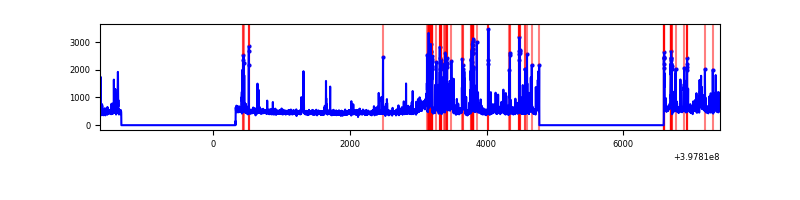 |
| C | 9078 | 5584 | 72 | 72 | 0.79% | 1.29% | 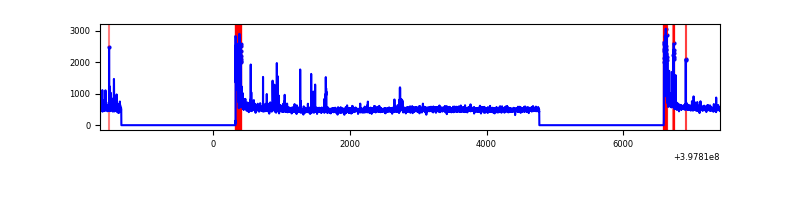 |
| D | 9078 | 5584 | 368 | 368 | 4.05% | 6.59% | 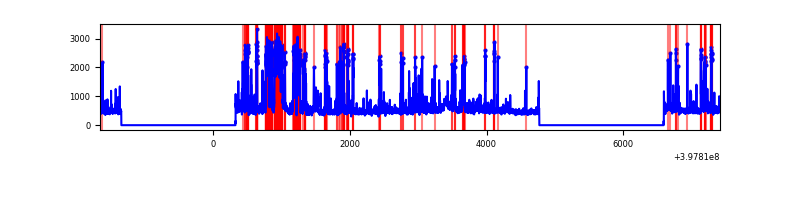 |
Top three noisy pixels from each quadrant. If the there are fewer than three noisy pixels in the level2.evt file, extra rows are filled as -1
| Pixel properties | Quadrant properties | ||||||
|---|---|---|---|---|---|---|---|
| Quadrant | DetID | PixID | Counts | Sigma | Mean | Median | Sigma |
| A | 10 | 83 | 264244 | 1954.86 | 674 | 661 | 134.8 |
| A | 13 | 6 | 9138 | 62.87 | 674 | 661 | 134.8 |
| A | 13 | 254 | 8491 | 58.07 | 674 | 661 | 134.8 |
| B | 5 | 172 | 538127 | 4242.72 | 660 | 644 | 126.7 |
| B | 5 | 184 | 316545 | 2493.62 | 660 | 644 | 126.7 |
| B | 12 | 111 | 15588 | 117.96 | 660 | 644 | 126.7 |
| C | 15 | 214 | 241582 | 1597.91 | 647 | 654 | 150.8 |
| C | 0 | 10 | 167647 | 1107.55 | 647 | 654 | 150.8 |
| C | 14 | 254 | 157452 | 1039.94 | 647 | 654 | 150.8 |
| D | 12 | 17 | 846368 | 5452.86 | 637 | 619 | 155.1 |
| D | 13 | 249 | 231414 | 1488.02 | 637 | 619 | 155.1 |
| D | 2 | 250 | 87226 | 558.39 | 637 | 619 | 155.1 |
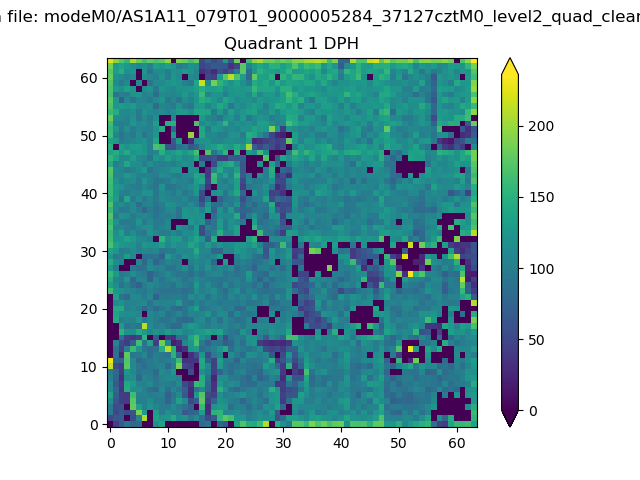
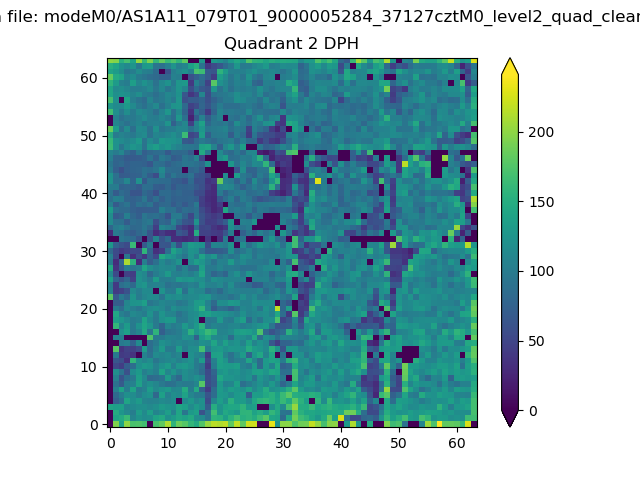
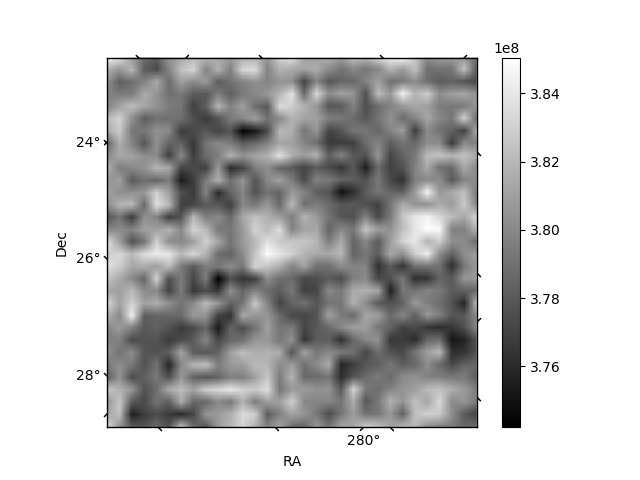
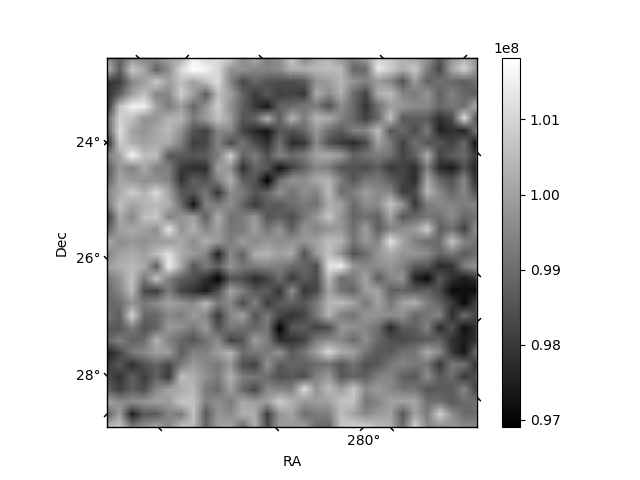
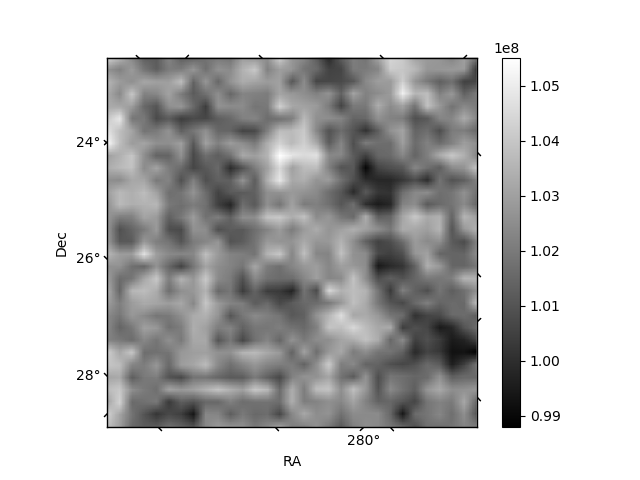
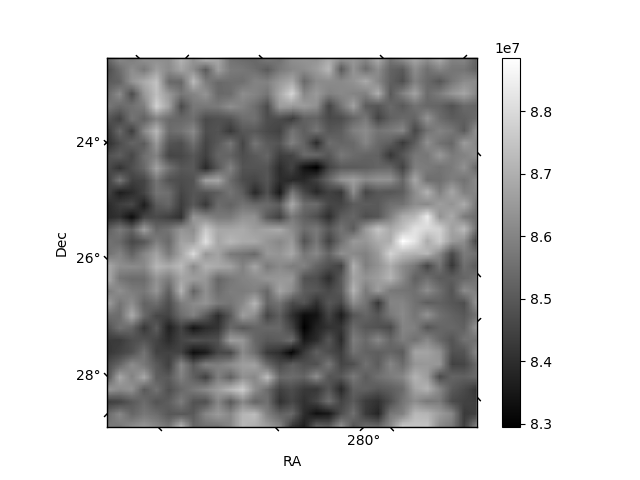
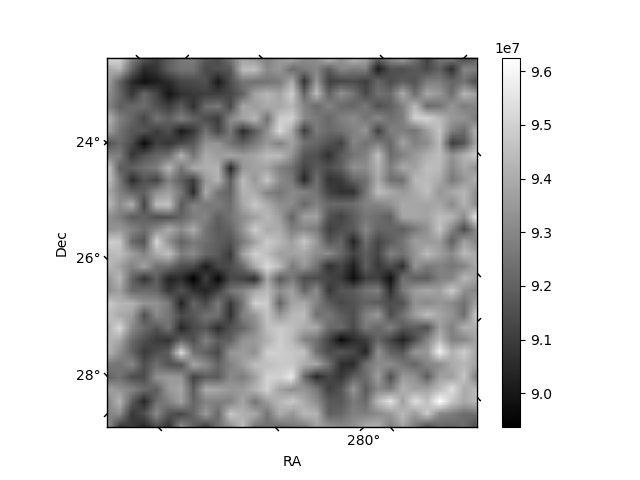
Histogram calculated using DETX and DETY for each event in the final _common_clean file
| Quadrant A | 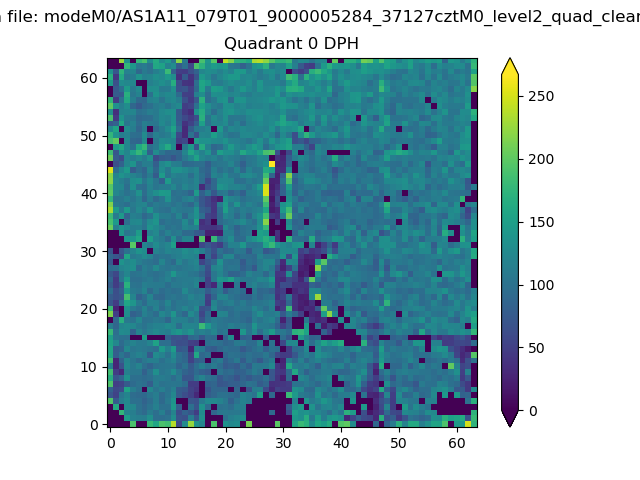 |
 |
Quadrant B |
|---|---|---|---|
| Quadrant D | 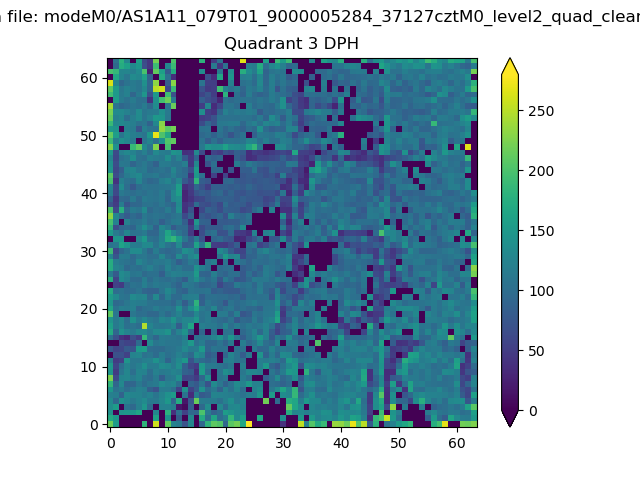 |
 |
Quadrant C |
| Plot type | Count rate plots | Images |
|---|---|---|
| Comparison with Poisson distribution Blue bars denote a histogram of data divided into 1 sec bins. Red curve is a Poisson curve with rate = median count rate of data. |
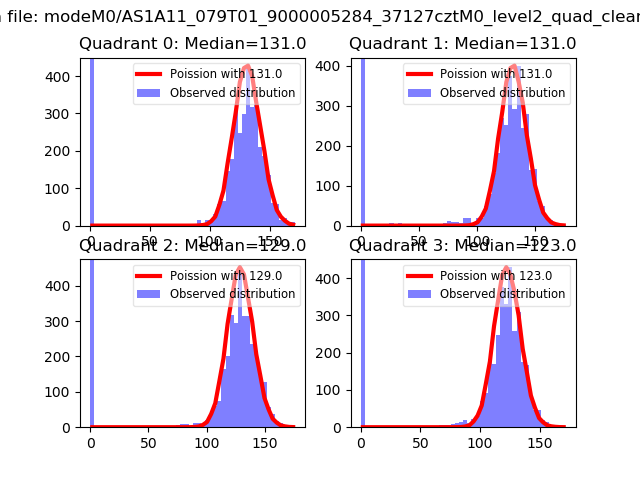 |
 |
| Quadrant-wise count rates Data is divided into 100 sec bins |
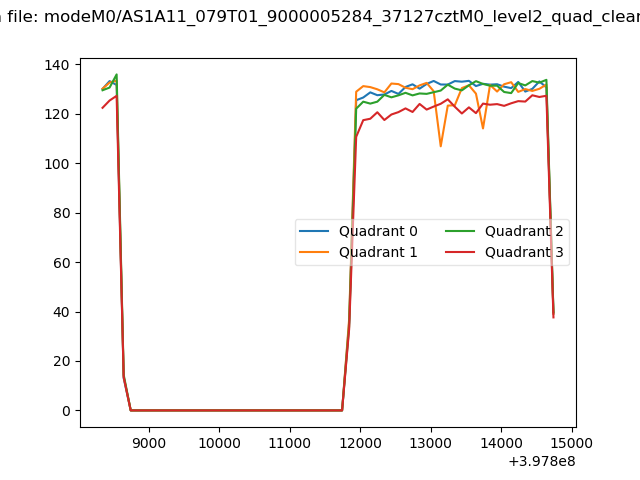 |
|
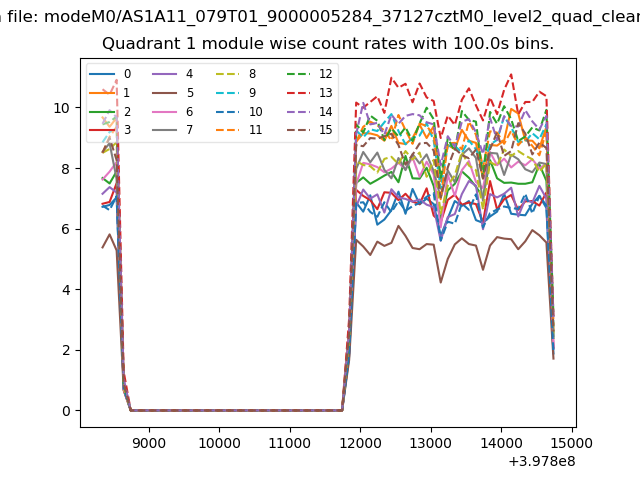
| Module-wise count rates for Quadrant A Data is divided into 100 sec bins |
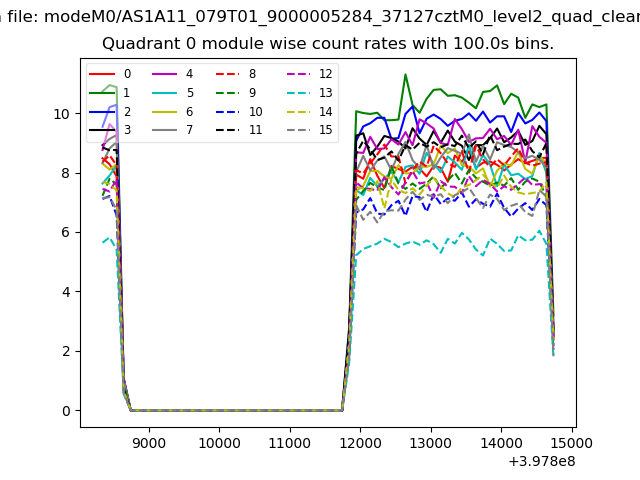 |
 |
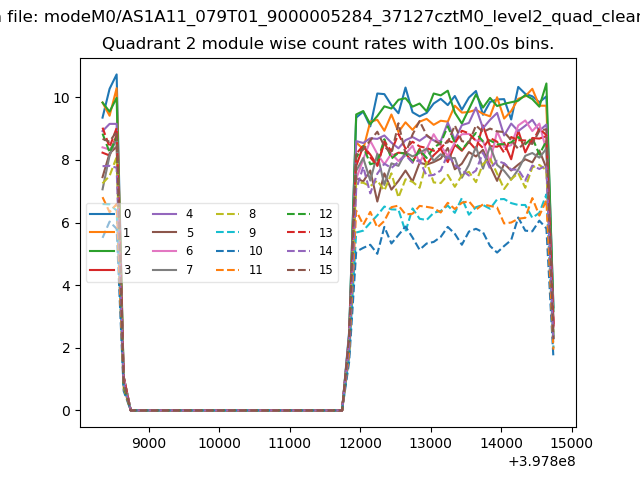
| Module-wise count rates for Quadrant B Data is divided into 100 sec bins |
 |
 |
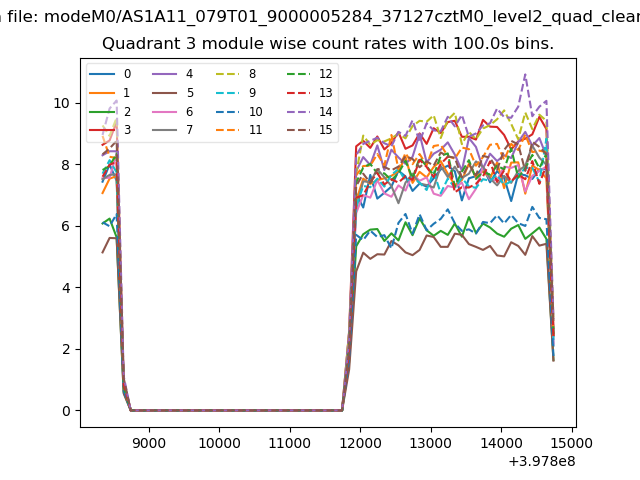
| Module-wise count rates for Quadrant C Data is divided into 100 sec bins |
 |
 |
| Module-wise count rates for Quadrant D Data is divided into 100 sec bins |
 |
 |
| Parameter | Plot |
|---|---|
| CZT HV Monitor | 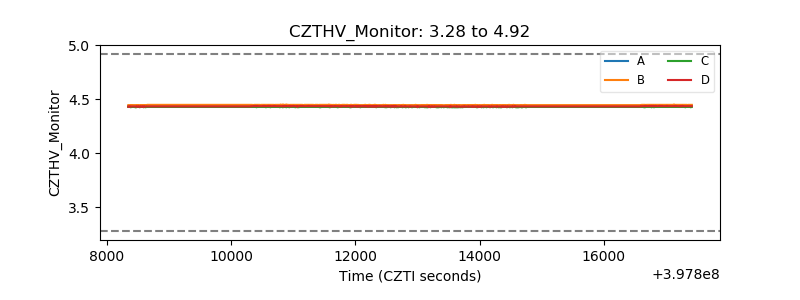 |
| D_VDD | 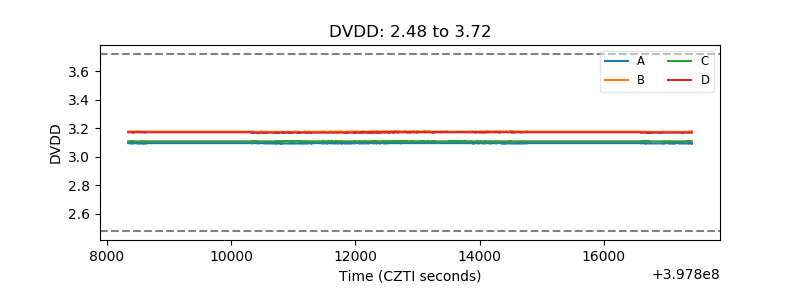 |
| Temperature 1 | 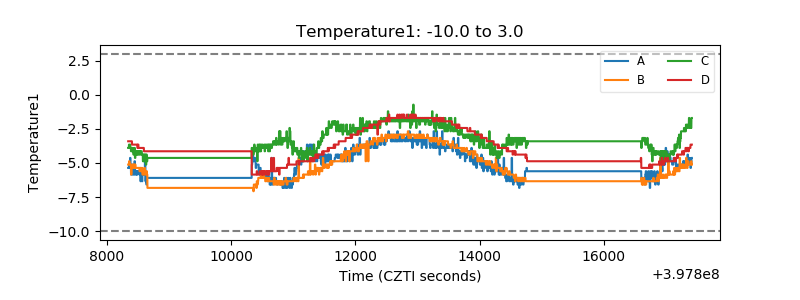 |
| Veto HV Monitor | 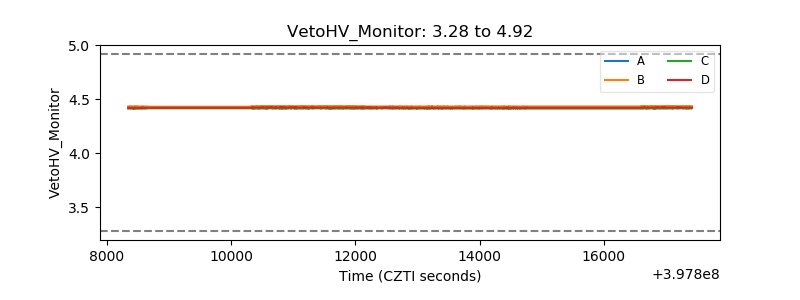 |
| Veto LLD | 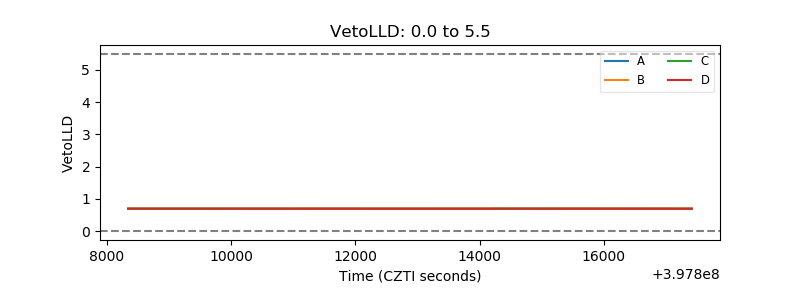 |
| Alpha Counter | 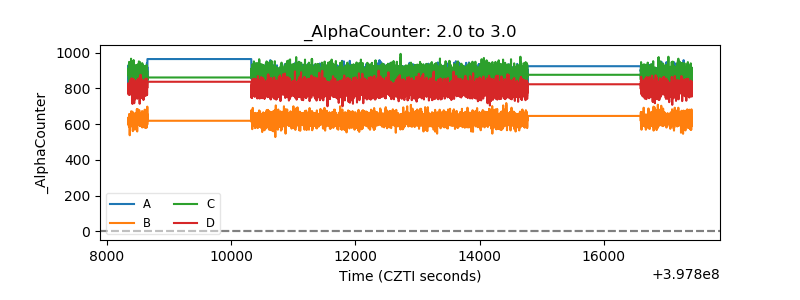 |
| _CPM_Rate | 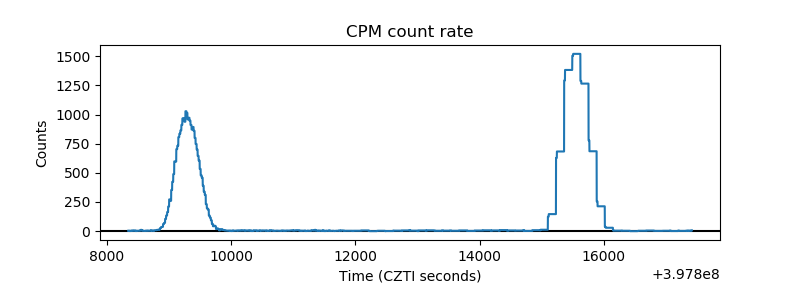 |
| CZT Counter | 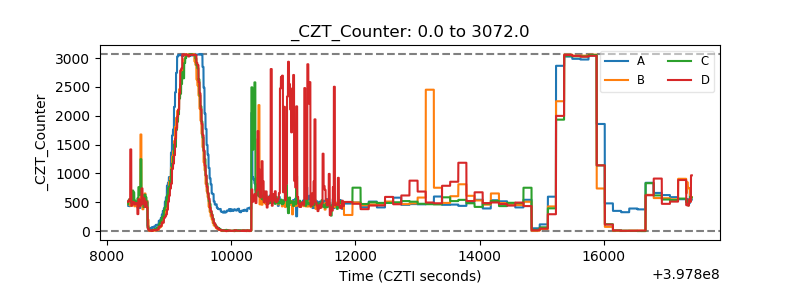 |
| +2.5 Volts monitor | 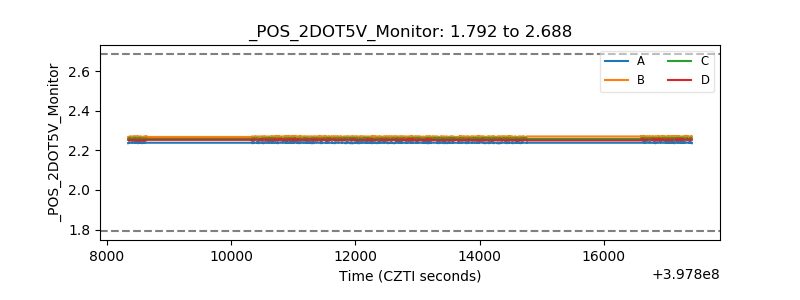 |
| +5 Volts monitor | 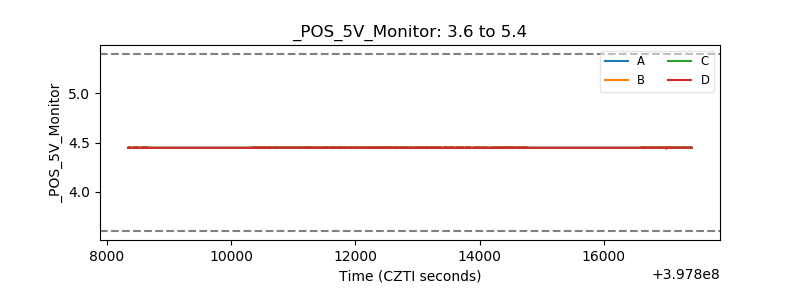 |
| _ROLL_ROT | 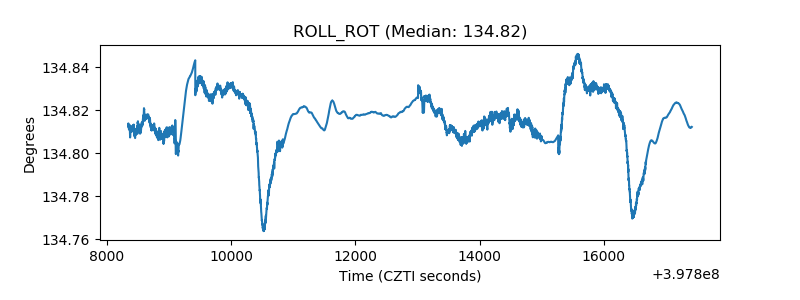 |
| _Roll_DEC | 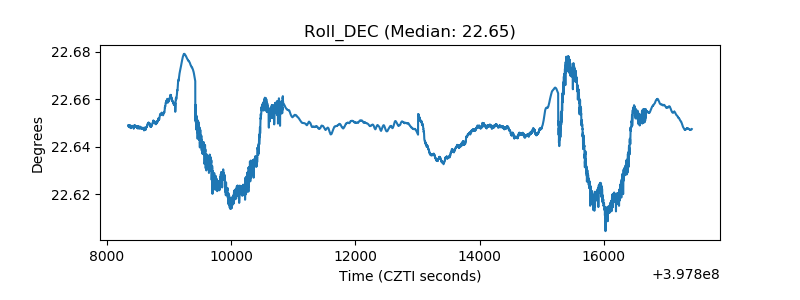 |
| _Roll_RA | 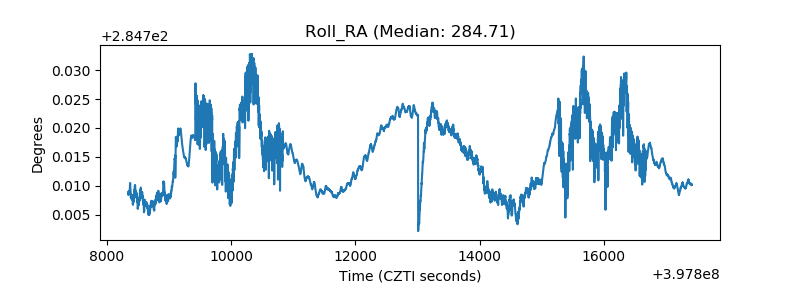 |
| Veto Counter | 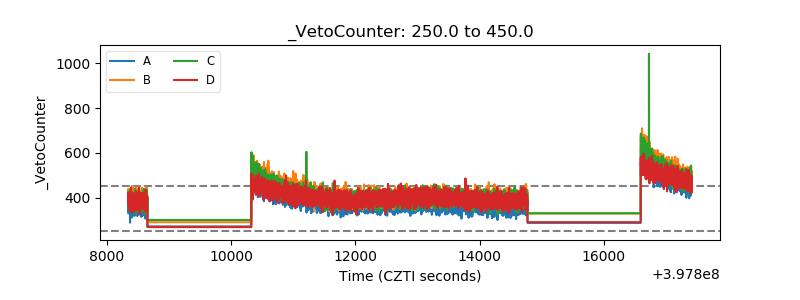 |