| Param | Original file | Final file |
|---|---|---|
| Filename | modeM0/AS1A11_079T01_9000005284_37128cztM0_level2.evt | modeM0/AS1A11_079T01_9000005284_37128cztM0_level2_quad_clean.evt |
| Size (bytes) | 441,691,200 | 75,104,640 |
| Size | 421.2 MB | 71.6 MB |
| Events in quadrant A | 2,943,736 | 488,874 |
| Events in quadrant B | 3,711,529 | 479,503 |
| Events in quadrant C | 3,134,042 | 474,407 |
| Events in quadrant D | 3,220,733 | 453,314 |
| Mode M9 | |||
|---|---|---|---|
| Quadrant | BADHDUFLAG | Total packets | Discarded packets |
| A | 0 | 31 | 0 |
| B | 0 | 31 | 0 |
| C | 0 | 31 | 0 |
| D | 0 | 32 | 0 |
| Mode SS | |||
|---|---|---|---|
| Quadrant | BADHDUFLAG | Total packets | Discarded packets |
| A | 0 | 112 | 0 |
| B | 0 | 112 | 0 |
| C | 0 | 112 | 0 |
| D | 0 | 112 | 0 |
| Mode M0 | |||
|---|---|---|---|
| Quadrant | BADHDUFLAG | Total packets | Discarded packets |
| A | 0 | 11871 | 3 |
| B | 0 | 14392 | 2 |
| C | 0 | 12416 | 2 |
| D | 0 | 12861 | 2 |
| Quadrant | Total seconds | Saturated seconds | Saturation percentage |
|---|---|---|---|
| A | 5393 | 12 | 0.222511% |
| B | 5393 | 241 | 4.468756% |
| C | 5393 | 66 | 1.223809% |
| D | 5393 | 63 | 1.168181% |
Noise dominated data is calculated using 1-second bins in cleaned event files. If a bin has >2000 counts, and if more than 50% of those come from <1% of pixels, then it is considered to be noise-dominated and hence unusable.
| Quadrant | # 1 sec bins | Bins with >0 counts | Bins with >2000 counts | High rate bins dominated by noise | Noise dominated (total time) | Noise dominated (detector-on time) | Marked lightcurve |
|---|---|---|---|---|---|---|---|
| A | 7336 | 5394 | 0 | 0 | 0.00% | 0.00% | 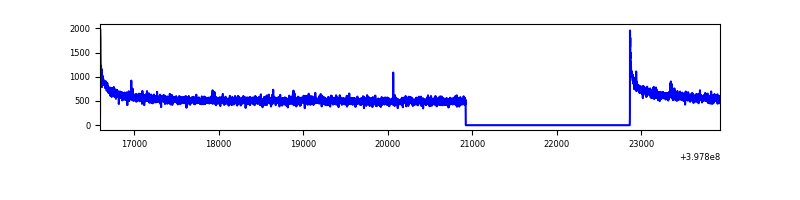 |
| B | 7336 | 5394 | 187 | 187 | 2.55% | 3.47% | 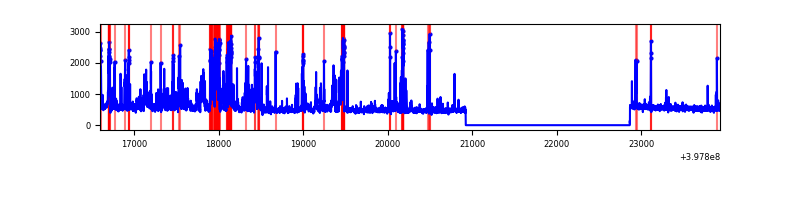 |
| C | 7336 | 5394 | 64 | 64 | 0.87% | 1.19% | 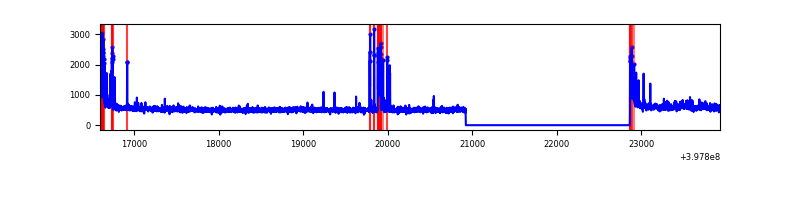 |
| D | 7336 | 5394 | 48 | 48 | 0.65% | 0.89% | 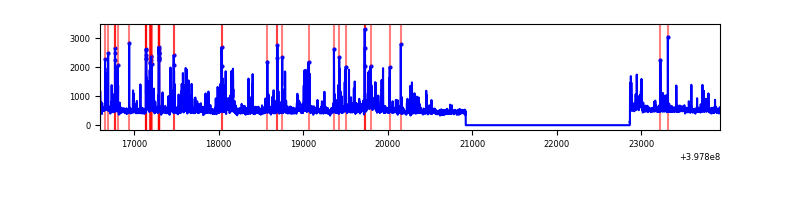 |
Top three noisy pixels from each quadrant. If the there are fewer than three noisy pixels in the level2.evt file, extra rows are filled as -1
| Pixel properties | Quadrant properties | ||||||
|---|---|---|---|---|---|---|---|
| Quadrant | DetID | PixID | Counts | Sigma | Mean | Median | Sigma |
| A | 10 | 83 | 254389 | 1850.1 | 689 | 677 | 137.1 |
| A | 13 | 6 | 20173 | 142.17 | 689 | 677 | 137.1 |
| A | 9 | 143 | 7821 | 52.1 | 689 | 677 | 137.1 |
| B | 5 | 184 | 671483 | 5299.22 | 667 | 650 | 126.6 |
| B | 5 | 172 | 353278 | 2785.57 | 667 | 650 | 126.6 |
| B | 5 | 255 | 22811 | 175.06 | 667 | 650 | 126.6 |
| C | 15 | 214 | 238303 | 1554.03 | 655 | 660 | 152.9 |
| C | 0 | 10 | 190868 | 1243.84 | 655 | 660 | 152.9 |
| C | 14 | 254 | 152522 | 993.08 | 655 | 660 | 152.9 |
| D | 13 | 249 | 132105 | 829.56 | 659 | 643 | 158.5 |
| D | 12 | 17 | 93831 | 588.04 | 659 | 643 | 158.5 |
| D | 2 | 250 | 90347 | 566.06 | 659 | 643 | 158.5 |
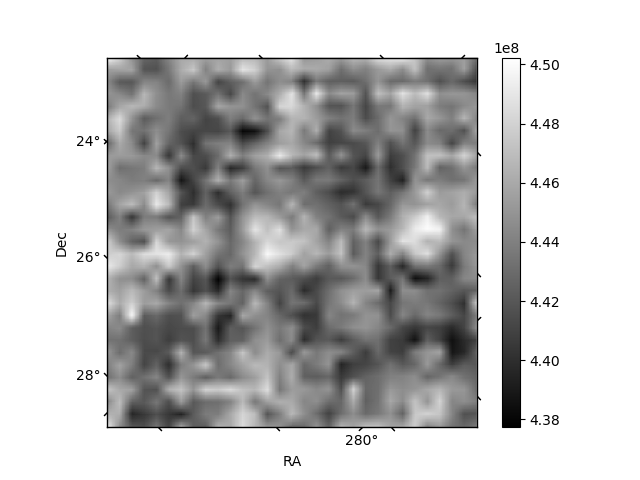
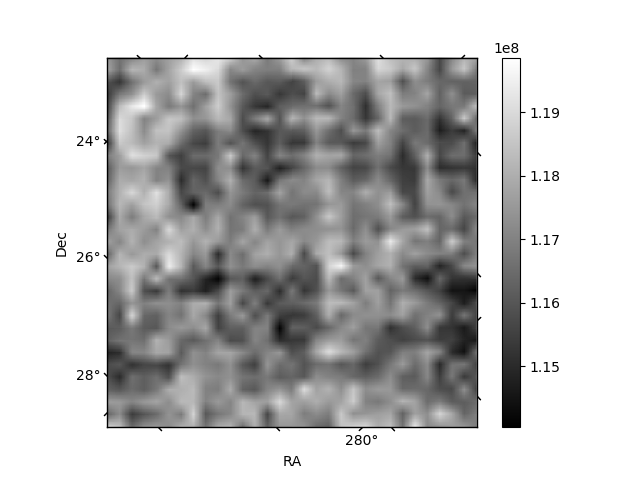
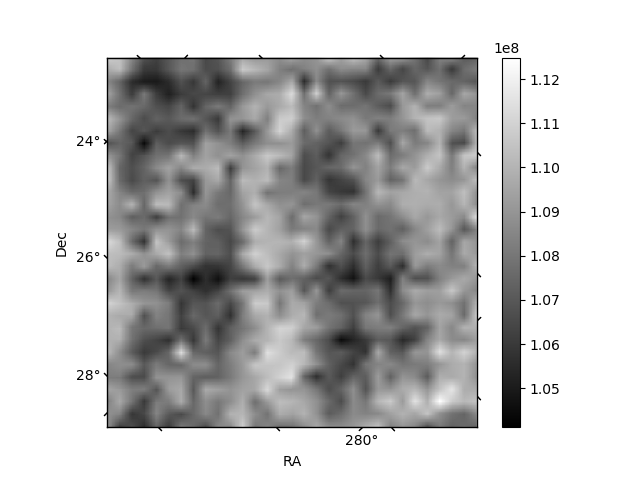
Histogram calculated using DETX and DETY for each event in the final _common_clean file
| Quadrant A | 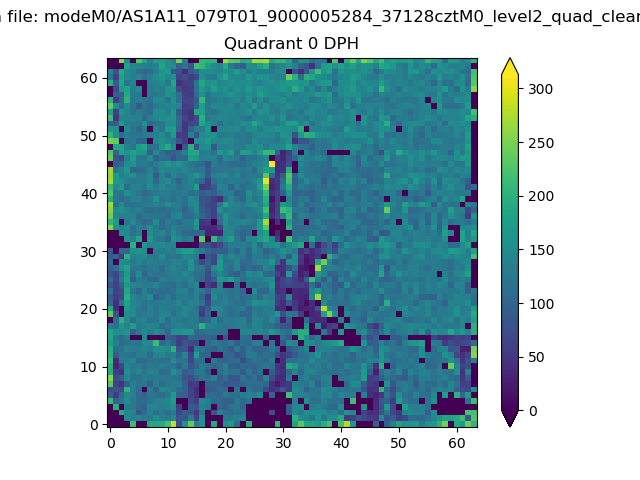 |
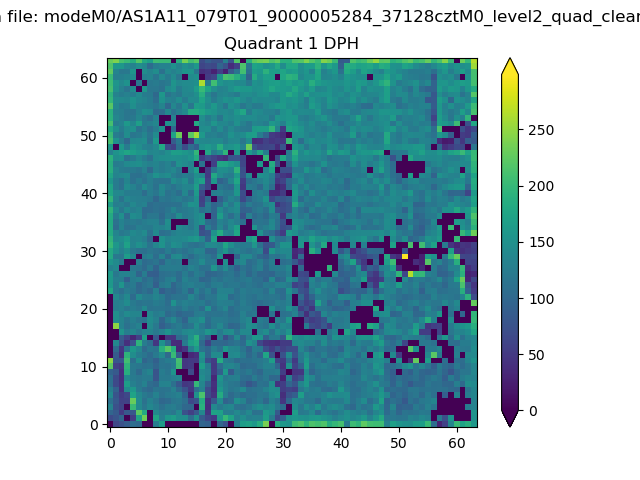 |
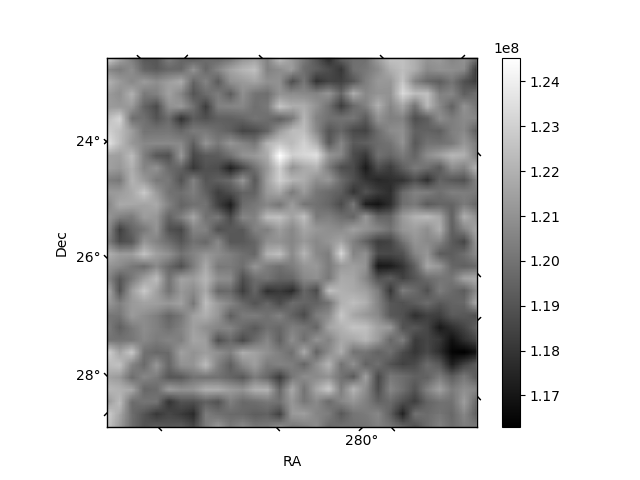
Quadrant B |
|---|---|---|---|
| Quadrant D | 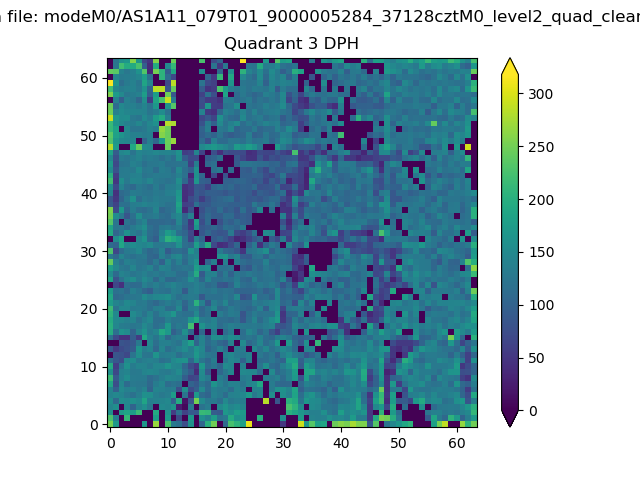 |
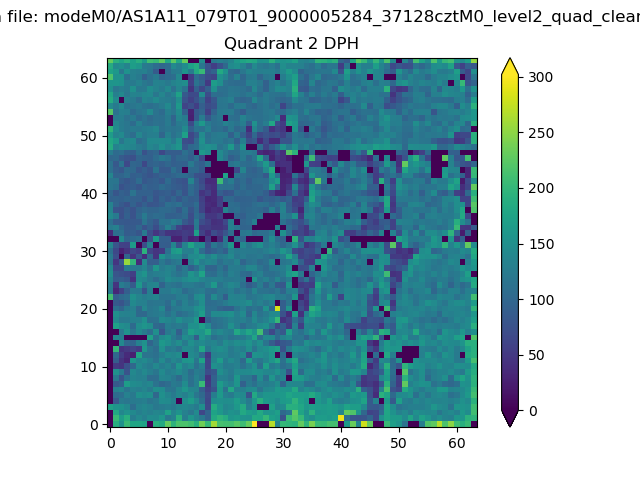 |
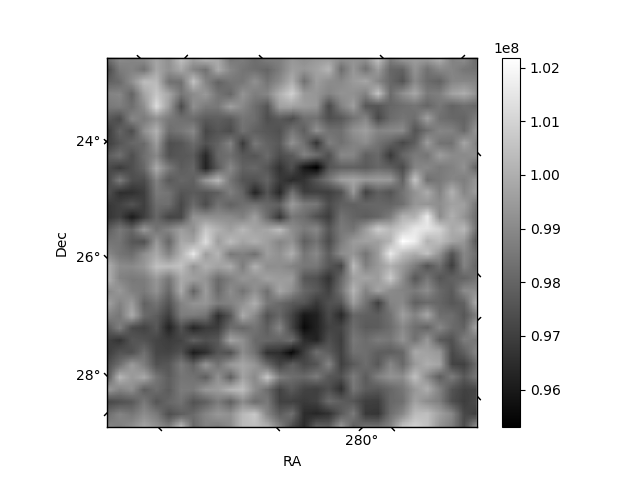
Quadrant C |
| Plot type | Count rate plots | Images |
|---|---|---|
| Comparison with Poisson distribution Blue bars denote a histogram of data divided into 1 sec bins. Red curve is a Poisson curve with rate = median count rate of data. |
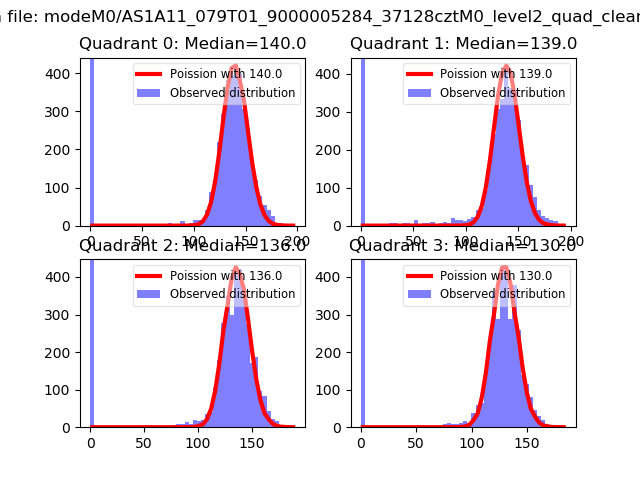 |
 |
| Quadrant-wise count rates Data is divided into 100 sec bins |
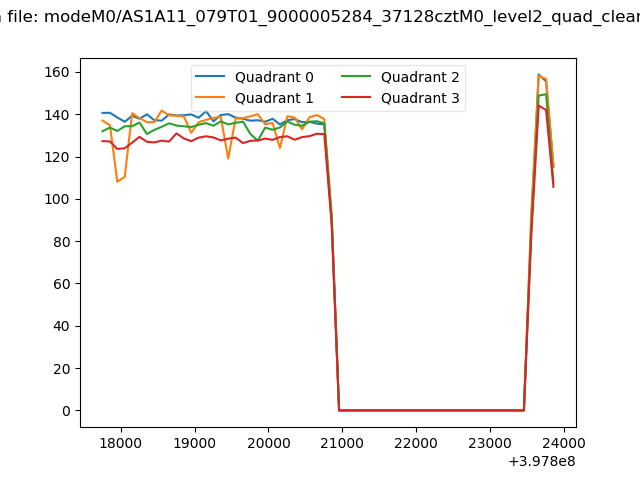 |
|
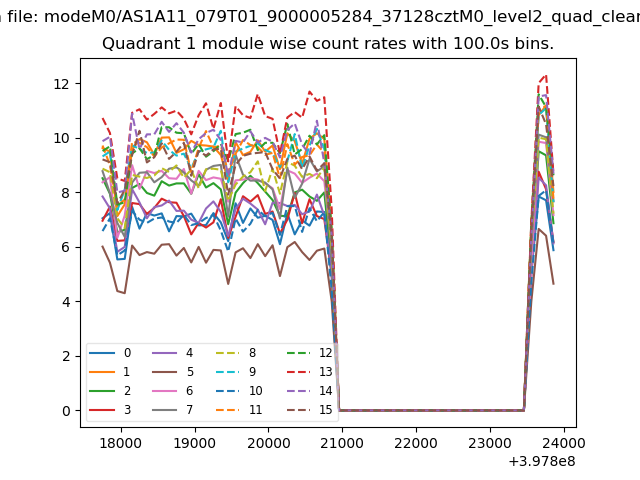
| Module-wise count rates for Quadrant A Data is divided into 100 sec bins |
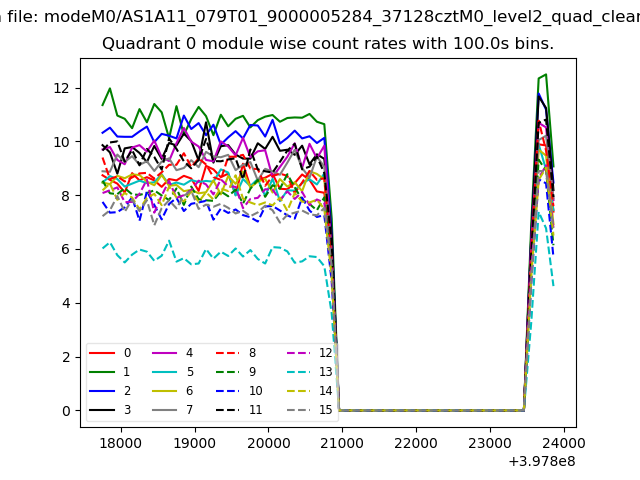 |
 |
| Module-wise count rates for Quadrant B Data is divided into 100 sec bins |
 |
 |
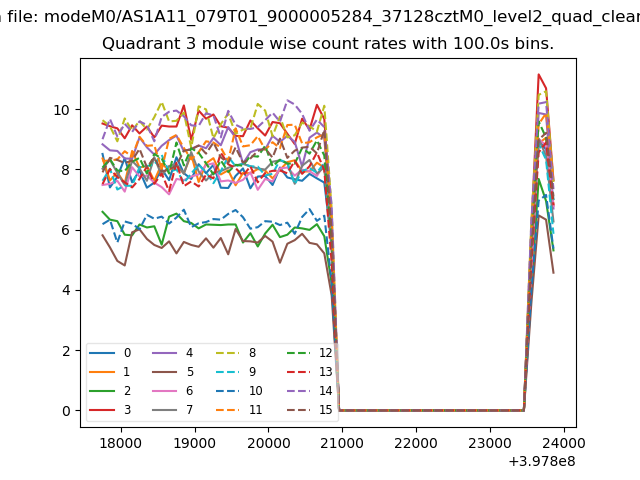
| Module-wise count rates for Quadrant C Data is divided into 100 sec bins |
 |
 |
| Module-wise count rates for Quadrant D Data is divided into 100 sec bins |
 |
 |
| Parameter | Plot |
|---|---|
| CZT HV Monitor | 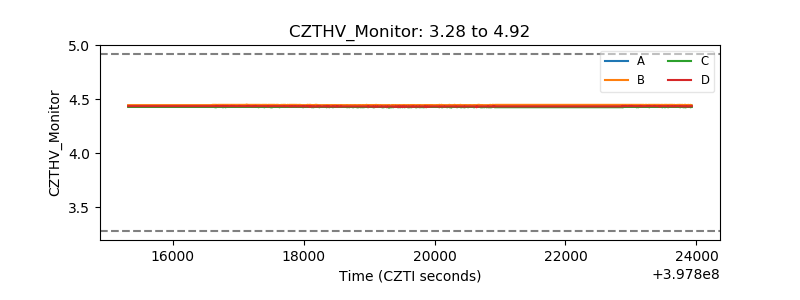 |
| D_VDD | 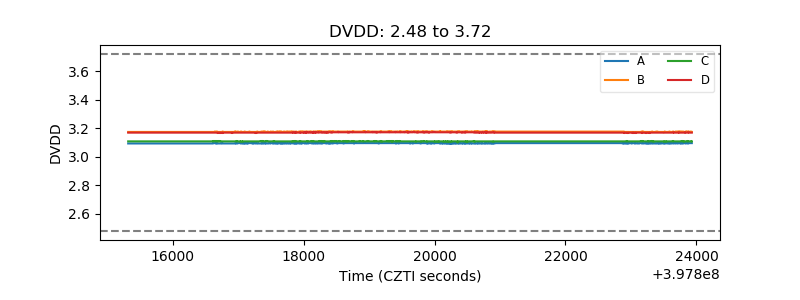 |
| Temperature 1 | 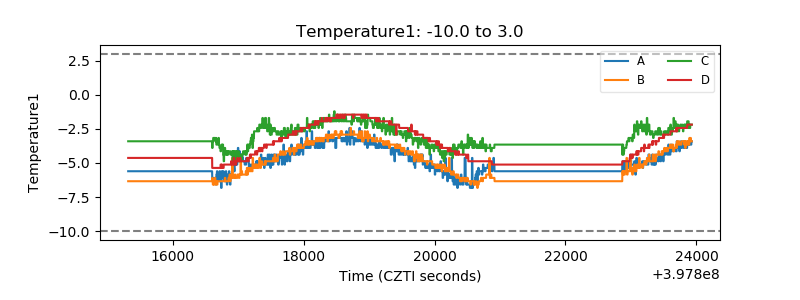 |
| Veto HV Monitor | 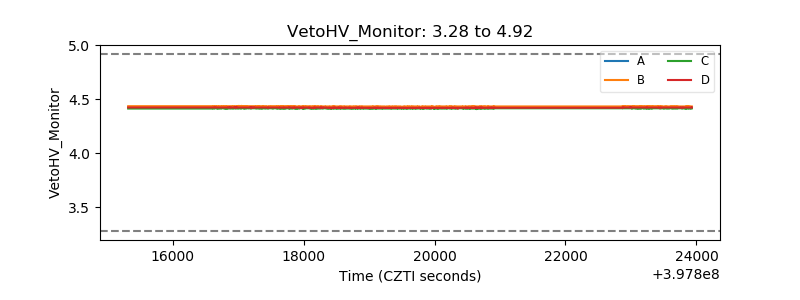 |
| Veto LLD | 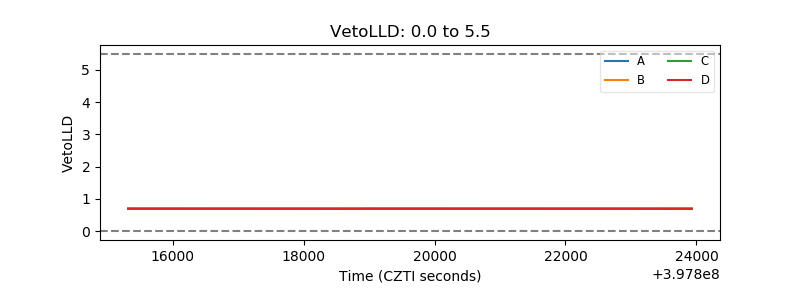 |
| Alpha Counter | 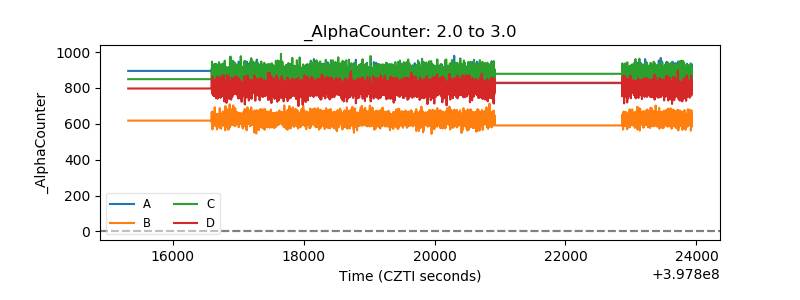 |
| _CPM_Rate | 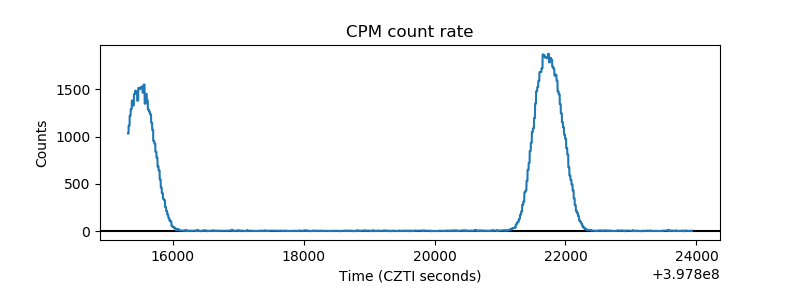 |
| CZT Counter | 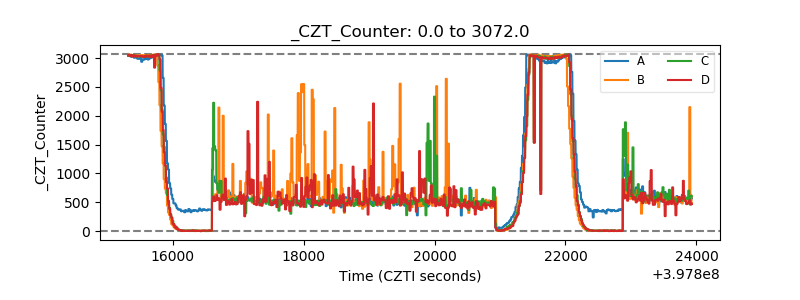 |
| +2.5 Volts monitor | 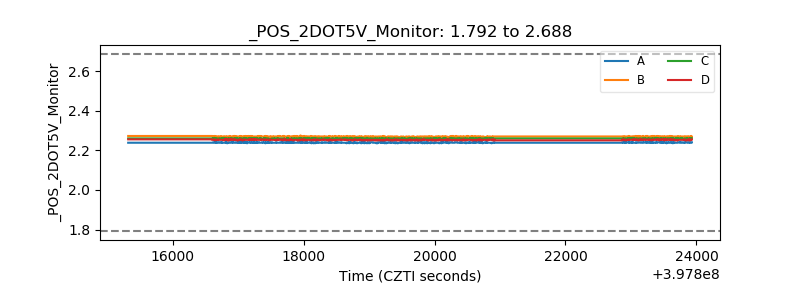 |
| +5 Volts monitor | 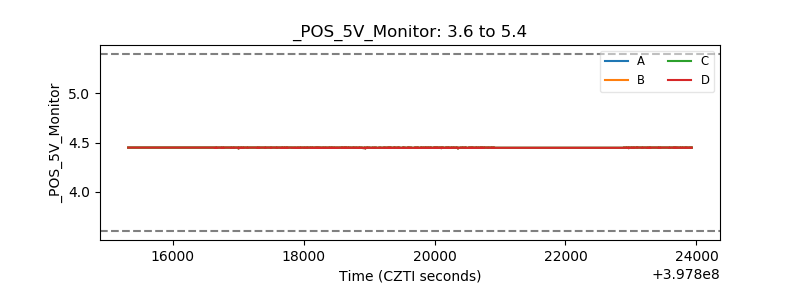 |
| _ROLL_ROT | 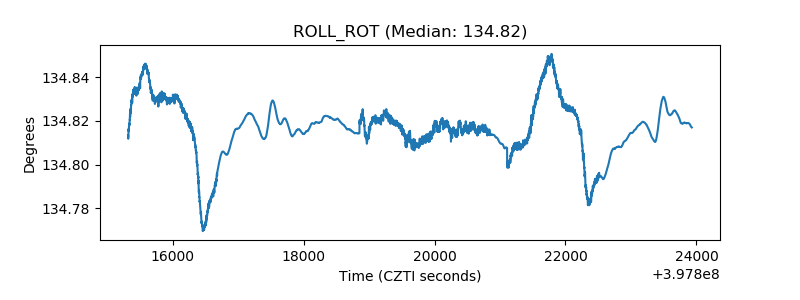 |
| _Roll_DEC | 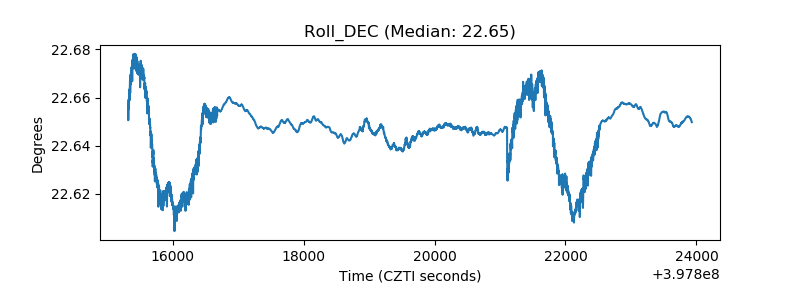 |
| _Roll_RA | 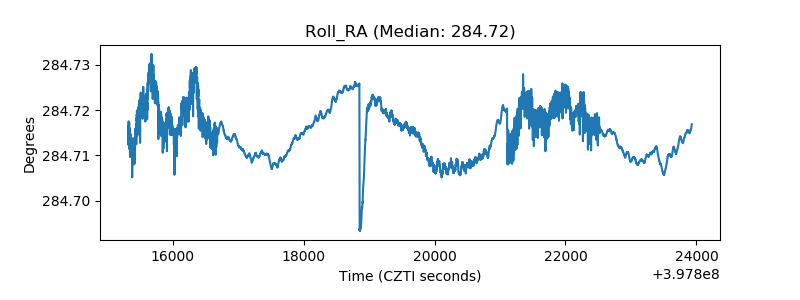 |
| Veto Counter | 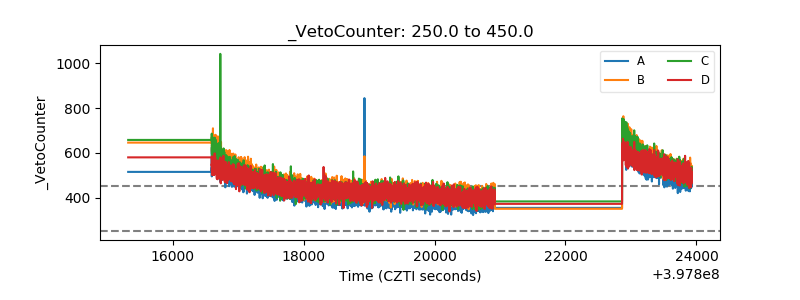 |