| Param | Original file | Final file |
|---|---|---|
| Filename | modeM0/AS1A11_079T01_9000005284_37129cztM0_level2.evt | modeM0/AS1A11_079T01_9000005284_37129cztM0_level2_quad_clean.evt |
| Size (bytes) | 429,013,440 | 92,586,240 |
| Size | 409.1 MB | 88.3 MB |
| Events in quadrant A | 2,945,175 | 628,418 |
| Events in quadrant B | 3,310,867 | 621,470 |
| Events in quadrant C | 3,070,379 | 609,783 |
| Events in quadrant D | 3,309,053 | 575,699 |
| Mode M9 | |||
|---|---|---|---|
| Quadrant | BADHDUFLAG | Total packets | Discarded packets |
| A | 0 | 27 | 0 |
| B | 0 | 27 | 0 |
| C | 0 | 27 | 0 |
| D | 0 | 28 | 0 |
| Mode SS | |||
|---|---|---|---|
| Quadrant | BADHDUFLAG | Total packets | Discarded packets |
| A | 0 | 106 | 0 |
| B | 0 | 106 | 0 |
| C | 0 | 106 | 0 |
| D | 0 | 106 | 0 |
| Mode M0 | |||
|---|---|---|---|
| Quadrant | BADHDUFLAG | Total packets | Discarded packets |
| A | 0 | 11909 | 3 |
| B | 0 | 13087 | 2 |
| C | 0 | 12269 | 2 |
| D | 0 | 12955 | 2 |
| Quadrant | Total seconds | Saturated seconds | Saturation percentage |
|---|---|---|---|
| A | 5266 | 9 | 0.170908% |
| B | 5266 | 126 | 2.392708% |
| C | 5266 | 21 | 0.398785% |
| D | 5266 | 121 | 2.297759% |
Noise dominated data is calculated using 1-second bins in cleaned event files. If a bin has >2000 counts, and if more than 50% of those come from <1% of pixels, then it is considered to be noise-dominated and hence unusable.
| Quadrant | # 1 sec bins | Bins with >0 counts | Bins with >2000 counts | High rate bins dominated by noise | Noise dominated (total time) | Noise dominated (detector-on time) | Marked lightcurve |
|---|---|---|---|---|---|---|---|
| A | 7329 | 5267 | 2 | 2 | 0.03% | 0.04% | 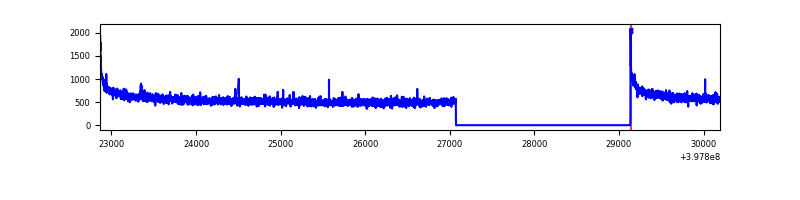 |
| B | 7329 | 5267 | 103 | 103 | 1.41% | 1.96% |  |
| C | 7329 | 5267 | 15 | 15 | 0.20% | 0.28% | 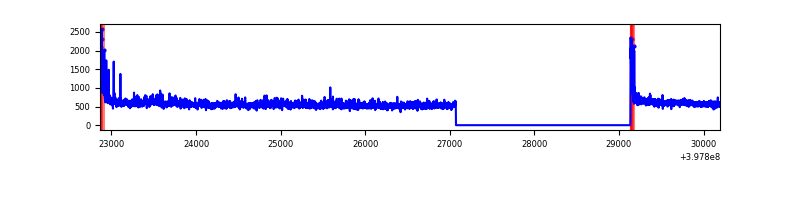 |
| D | 7329 | 5267 | 120 | 120 | 1.64% | 2.28% | 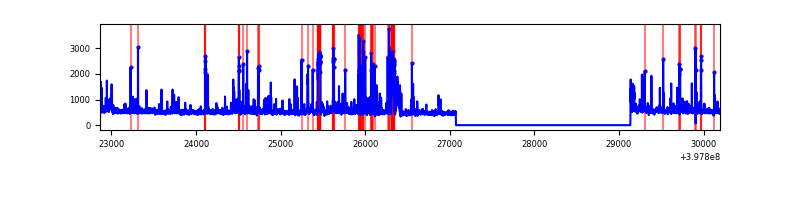 |
Top three noisy pixels from each quadrant. If the there are fewer than three noisy pixels in the level2.evt file, extra rows are filled as -1
| Pixel properties | Quadrant properties | ||||||
|---|---|---|---|---|---|---|---|
| Quadrant | DetID | PixID | Counts | Sigma | Mean | Median | Sigma |
| A | 10 | 83 | 254024 | 1849.67 | 692 | 681 | 137.0 |
| A | 9 | 143 | 10429 | 71.17 | 692 | 681 | 137.0 |
| A | 13 | 6 | 7412 | 49.14 | 692 | 681 | 137.0 |
| B | 5 | 172 | 587334 | 4625.71 | 671 | 656 | 126.8 |
| B | 5 | 200 | 23926 | 183.47 | 671 | 656 | 126.8 |
| B | 5 | 255 | 21268 | 162.52 | 671 | 656 | 126.8 |
| C | 15 | 214 | 244754 | 1602.18 | 658 | 665 | 152.3 |
| C | 0 | 10 | 236886 | 1550.54 | 658 | 665 | 152.3 |
| C | 14 | 254 | 14796 | 92.75 | 658 | 665 | 152.3 |
| D | 13 | 249 | 338107 | 2107.29 | 663 | 648 | 160.1 |
| D | 7 | 102 | 75561 | 467.8 | 663 | 648 | 160.1 |
| D | 12 | 235 | 52828 | 325.84 | 663 | 648 | 160.1 |
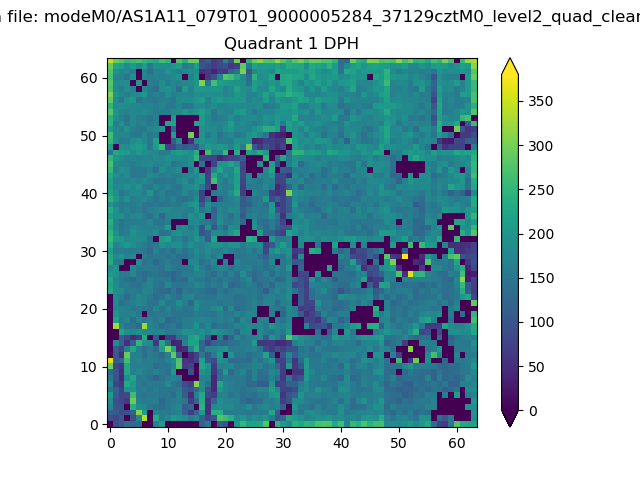
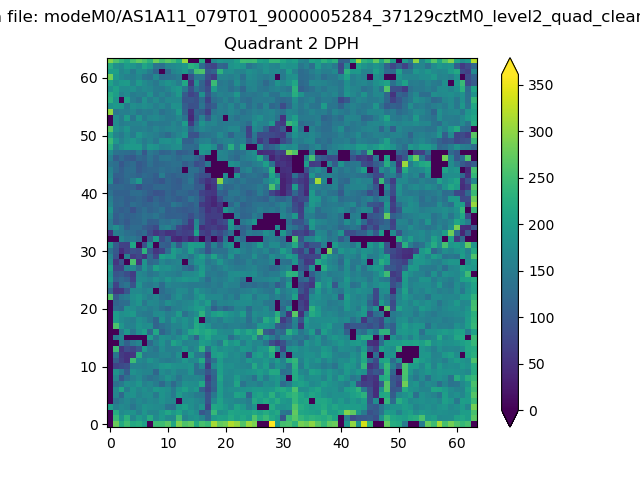
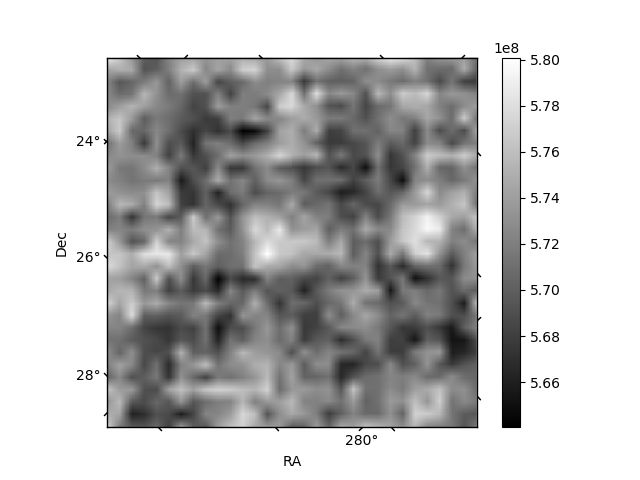
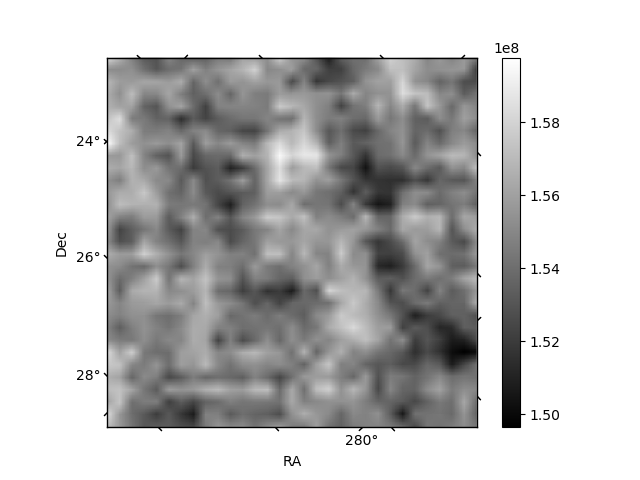
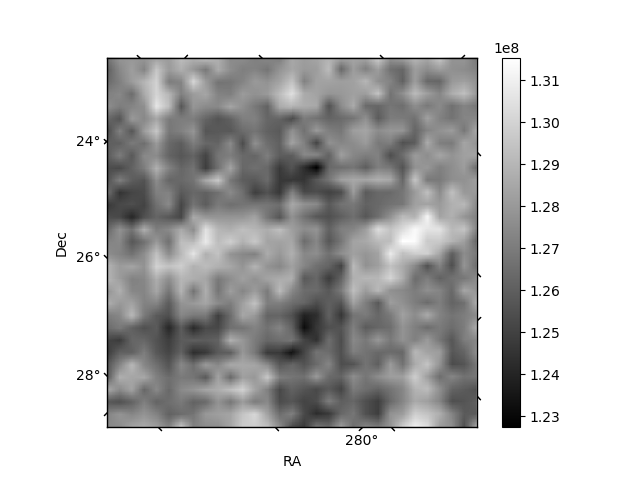
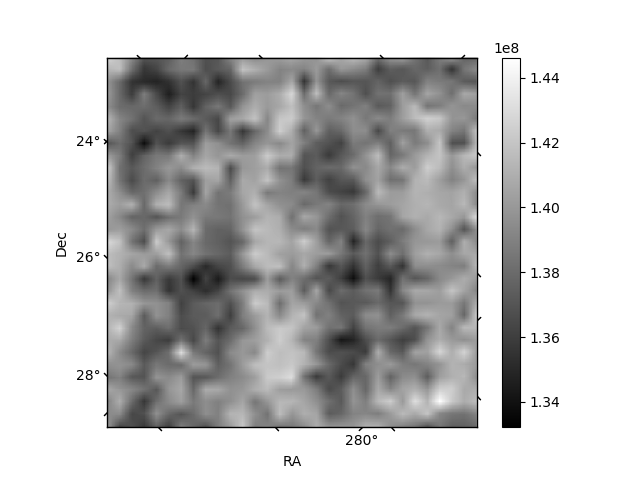
Histogram calculated using DETX and DETY for each event in the final _common_clean file
| Quadrant A | 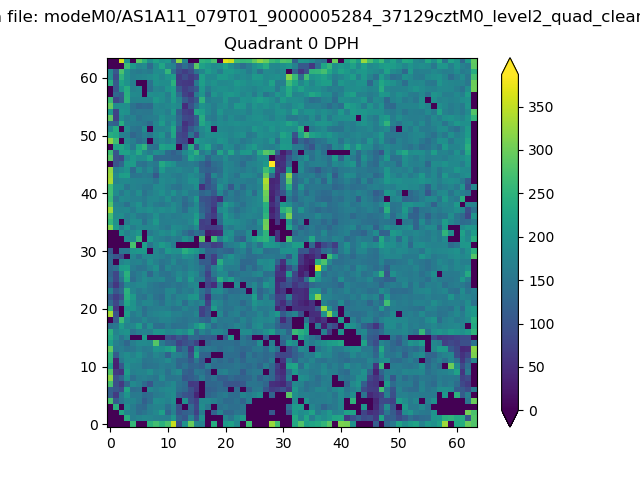 |
 |
Quadrant B |
|---|---|---|---|
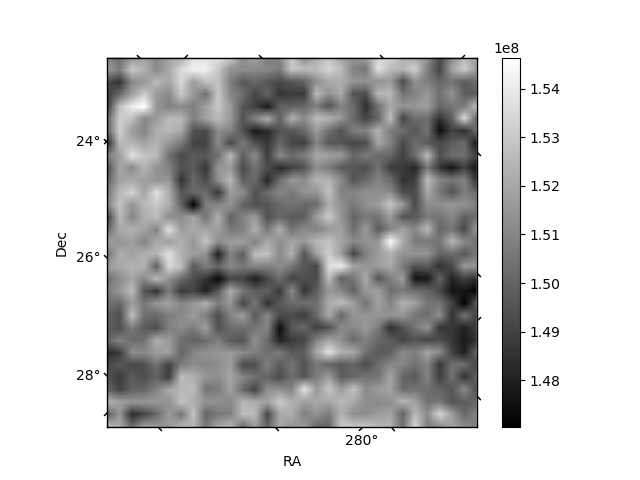
| Quadrant D | 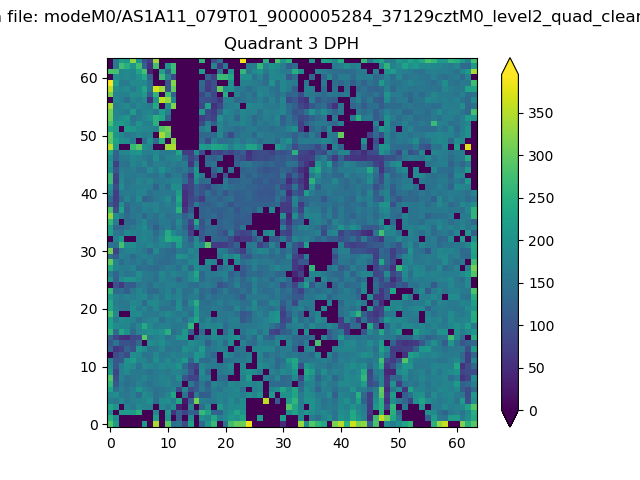 |
 |
Quadrant C |
| Plot type | Count rate plots | Images |
|---|---|---|
| Comparison with Poisson distribution Blue bars denote a histogram of data divided into 1 sec bins. Red curve is a Poisson curve with rate = median count rate of data. |
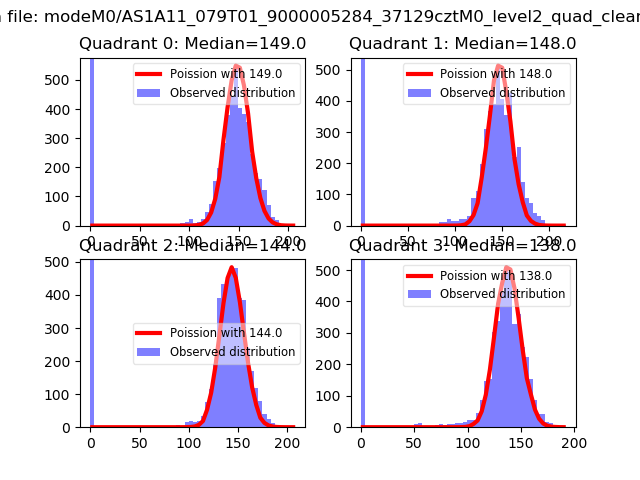 |
 |
| Quadrant-wise count rates Data is divided into 100 sec bins |
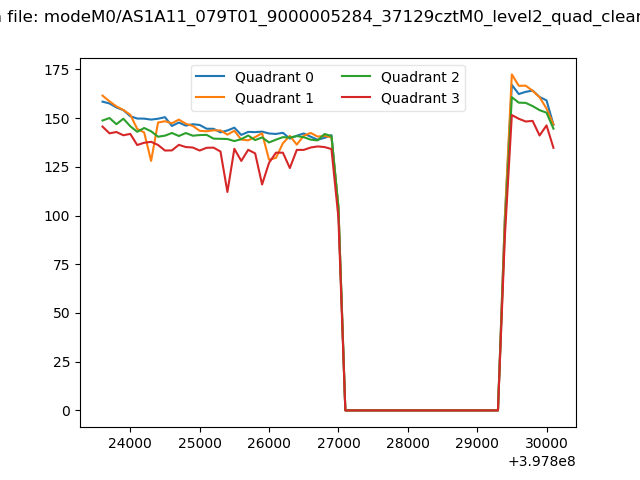 |
|
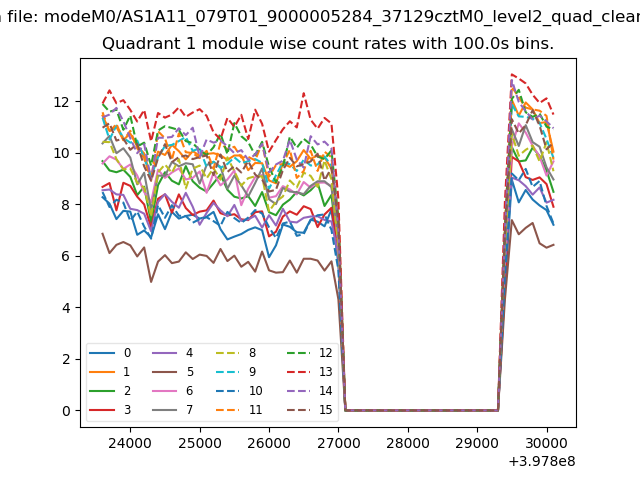
| Module-wise count rates for Quadrant A Data is divided into 100 sec bins |
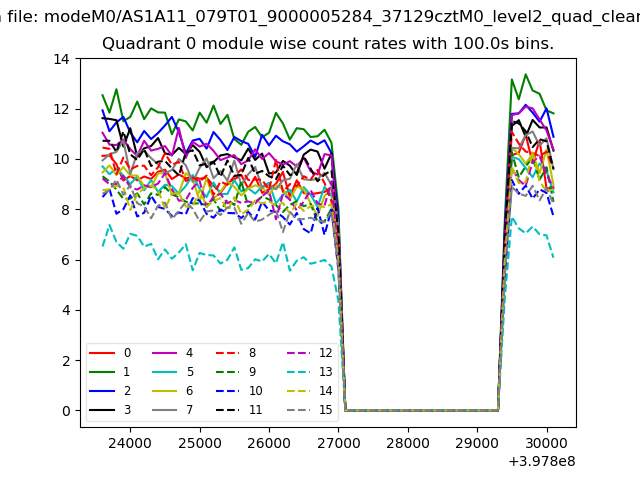 |
 |
| Module-wise count rates for Quadrant B Data is divided into 100 sec bins |
 |
 |
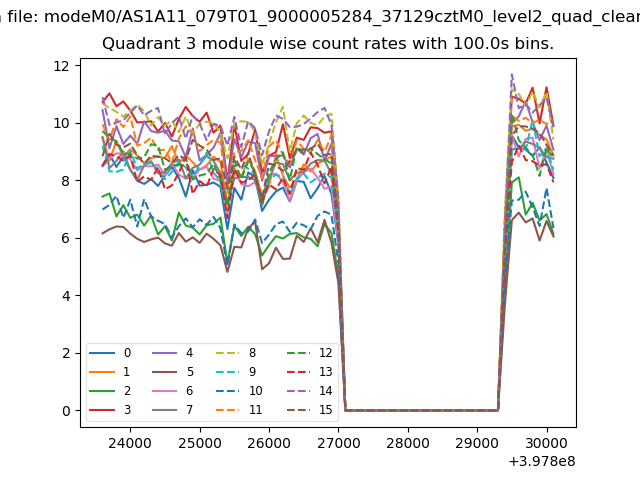
| Module-wise count rates for Quadrant C Data is divided into 100 sec bins |
 |
 |
| Module-wise count rates for Quadrant D Data is divided into 100 sec bins |
 |
 |
| Parameter | Plot |
|---|---|
| CZT HV Monitor | 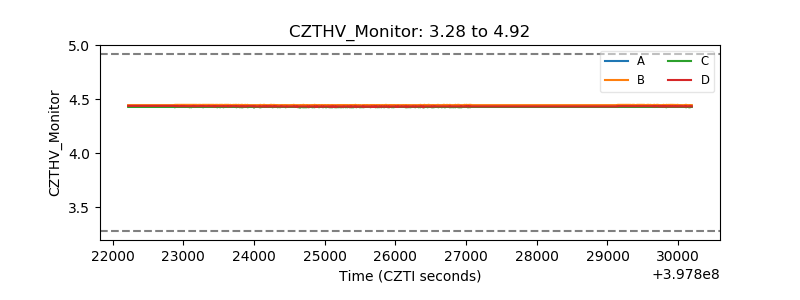 |
| D_VDD | 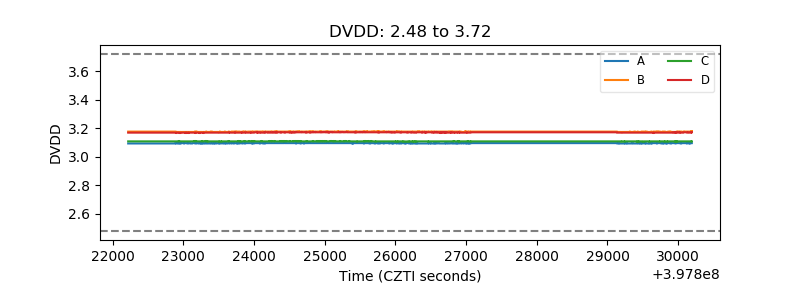 |
| Temperature 1 | 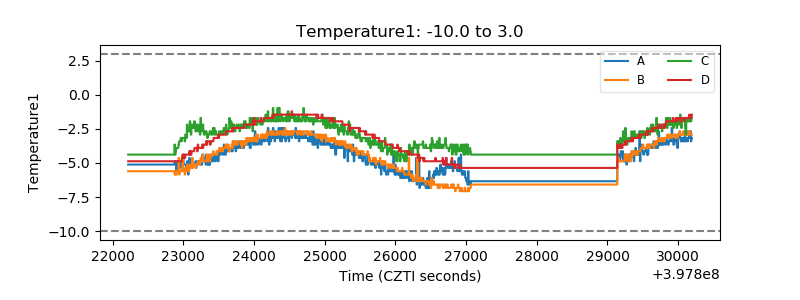 |
| Veto HV Monitor | 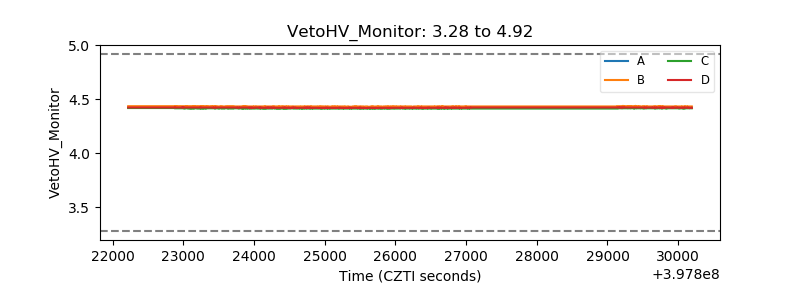 |
| Veto LLD | 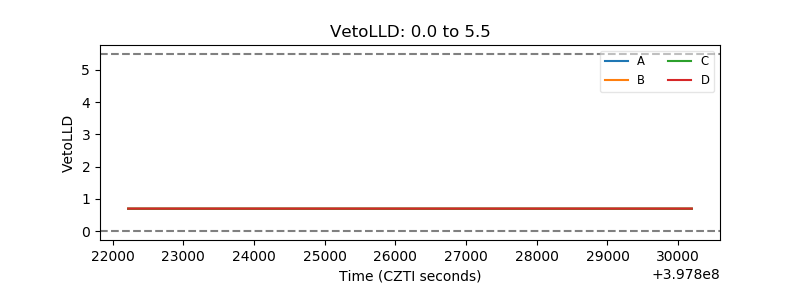 |
| Alpha Counter | 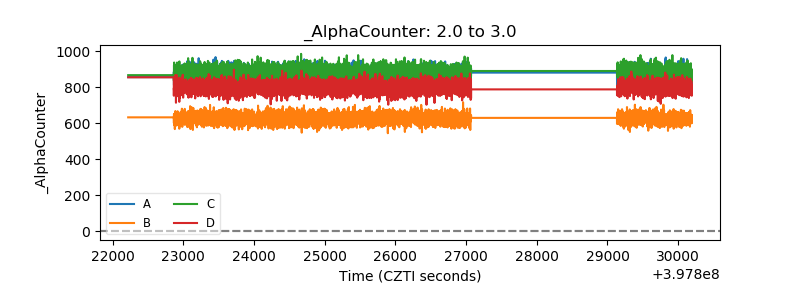 |
| _CPM_Rate | 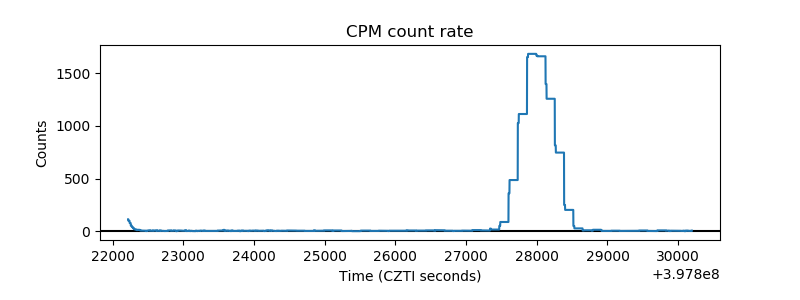 |
| CZT Counter | 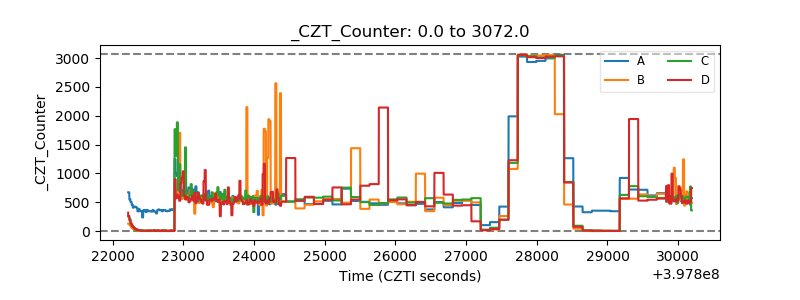 |
| +2.5 Volts monitor | 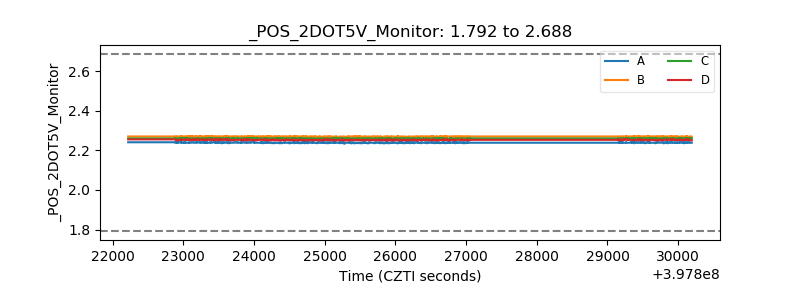 |
| +5 Volts monitor | 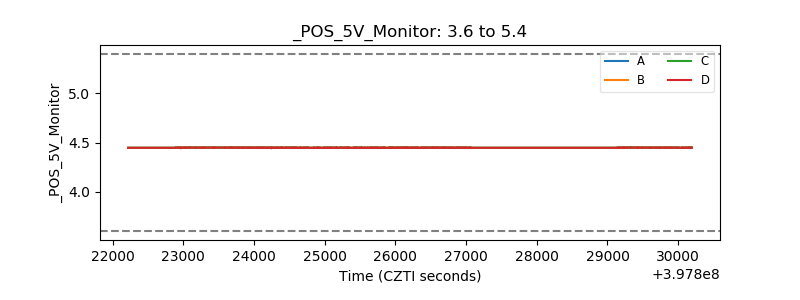 |
| _ROLL_ROT | 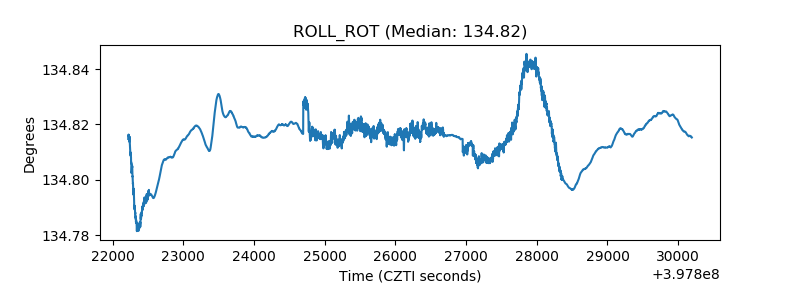 |
| _Roll_DEC | 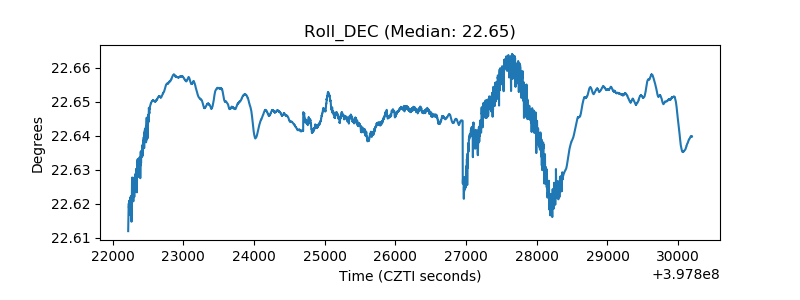 |
| _Roll_RA | 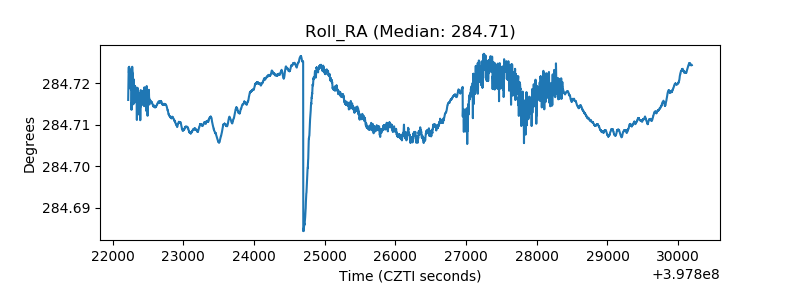 |
| Veto Counter | 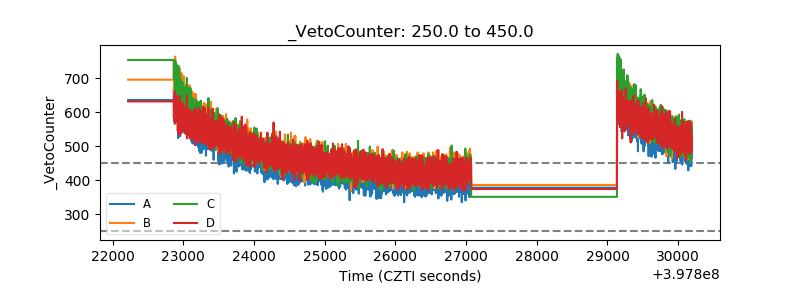 |