| Param | Original file | Final file |
|---|---|---|
| Filename | modeM0/AS1A11_079T01_9000005284_37130cztM0_level2.evt | modeM0/AS1A11_079T01_9000005284_37130cztM0_level2_quad_clean.evt |
| Size (bytes) | 417,617,280 | 99,840,960 |
| Size | 398.3 MB | 95.2 MB |
| Events in quadrant A | 2,980,457 | 685,313 |
| Events in quadrant B | 3,289,537 | 675,640 |
| Events in quadrant C | 2,911,456 | 668,480 |
| Events in quadrant D | 3,117,650 | 634,923 |
| Mode M9 | |||
|---|---|---|---|
| Quadrant | BADHDUFLAG | Total packets | Discarded packets |
| A | 0 | 35 | 0 |
| B | 0 | 35 | 0 |
| C | 0 | 35 | 0 |
| D | 0 | 36 | 0 |
| Mode SS | |||
|---|---|---|---|
| Quadrant | BADHDUFLAG | Total packets | Discarded packets |
| A | 0 | 104 | 0 |
| B | 0 | 104 | 0 |
| C | 0 | 104 | 0 |
| D | 0 | 104 | 0 |
| Mode M0 | |||
|---|---|---|---|
| Quadrant | BADHDUFLAG | Total packets | Discarded packets |
| A | 0 | 11955 | 3 |
| B | 0 | 12976 | 2 |
| C | 0 | 11666 | 2 |
| D | 0 | 12455 | 2 |
| Quadrant | Total seconds | Saturated seconds | Saturation percentage |
|---|---|---|---|
| A | 5130 | 58 | 1.130604% |
| B | 5130 | 165 | 3.216374% |
| C | 5130 | 17 | 0.331384% |
| D | 5130 | 107 | 2.085770% |
Noise dominated data is calculated using 1-second bins in cleaned event files. If a bin has >2000 counts, and if more than 50% of those come from <1% of pixels, then it is considered to be noise-dominated and hence unusable.
| Quadrant | # 1 sec bins | Bins with >0 counts | Bins with >2000 counts | High rate bins dominated by noise | Noise dominated (total time) | Noise dominated (detector-on time) | Marked lightcurve |
|---|---|---|---|---|---|---|---|
| A | 7253 | 5131 | 38 | 38 | 0.52% | 0.74% | 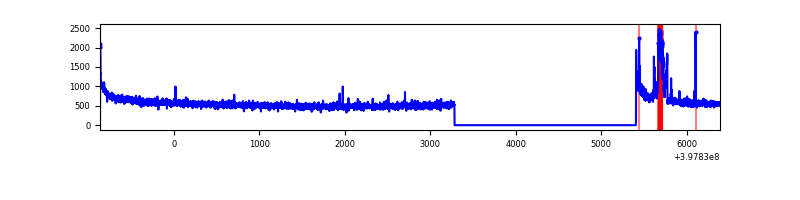 |
| B | 7253 | 5131 | 148 | 148 | 2.04% | 2.88% | 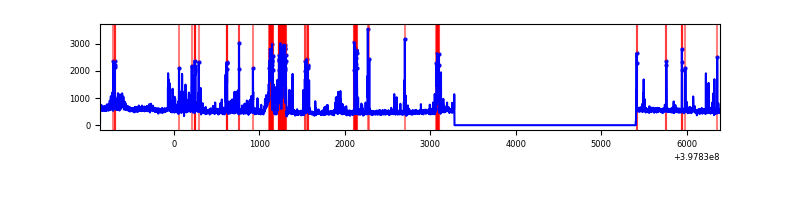 |
| C | 7253 | 5131 | 12 | 12 | 0.17% | 0.23% | 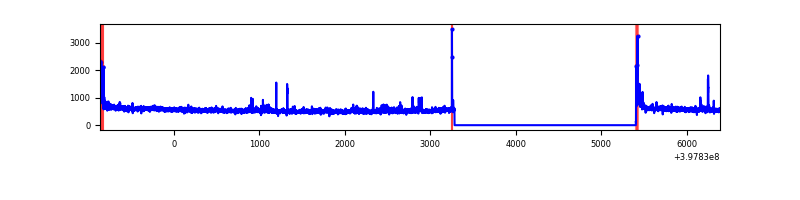 |
| D | 7253 | 5131 | 87 | 87 | 1.20% | 1.70% | 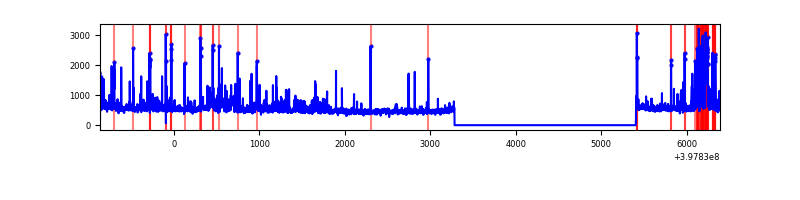 |
Top three noisy pixels from each quadrant. If the there are fewer than three noisy pixels in the level2.evt file, extra rows are filled as -1
| Pixel properties | Quadrant properties | ||||||
|---|---|---|---|---|---|---|---|
| Quadrant | DetID | PixID | Counts | Sigma | Mean | Median | Sigma |
| A | 10 | 83 | 246534 | 1874.5 | 665 | 655 | 131.2 |
| A | 15 | 174 | 134784 | 1022.56 | 665 | 655 | 131.2 |
| A | 9 | 143 | 21518 | 159.05 | 665 | 655 | 131.2 |
| B | 5 | 172 | 641151 | 5277.49 | 640 | 626 | 121.4 |
| B | 5 | 200 | 82248 | 672.51 | 640 | 626 | 121.4 |
| B | 0 | 230 | 24980 | 200.66 | 640 | 626 | 121.4 |
| C | 15 | 214 | 239055 | 1617.45 | 636 | 642 | 147.4 |
| C | 0 | 10 | 115946 | 782.25 | 636 | 642 | 147.4 |
| C | 10 | 49 | 50589 | 338.85 | 636 | 642 | 147.4 |
| D | 2 | 250 | 234919 | 1521.02 | 639 | 626 | 154.0 |
| D | 12 | 235 | 112158 | 724.06 | 639 | 626 | 154.0 |
| D | 13 | 249 | 103098 | 665.24 | 639 | 626 | 154.0 |
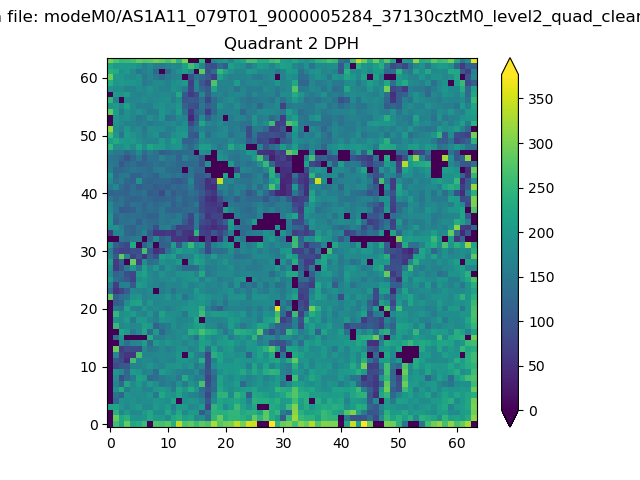
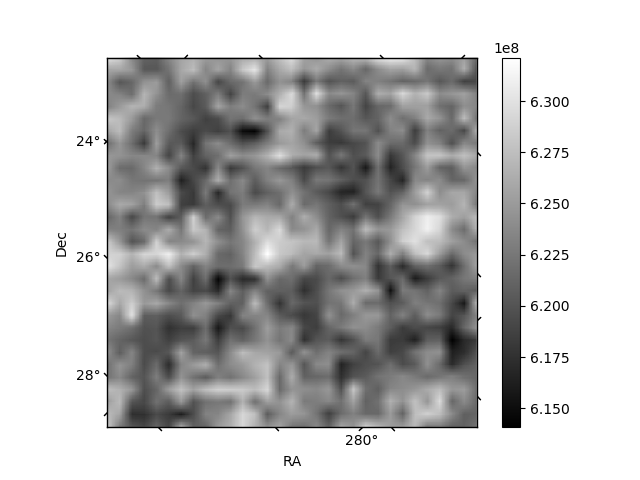
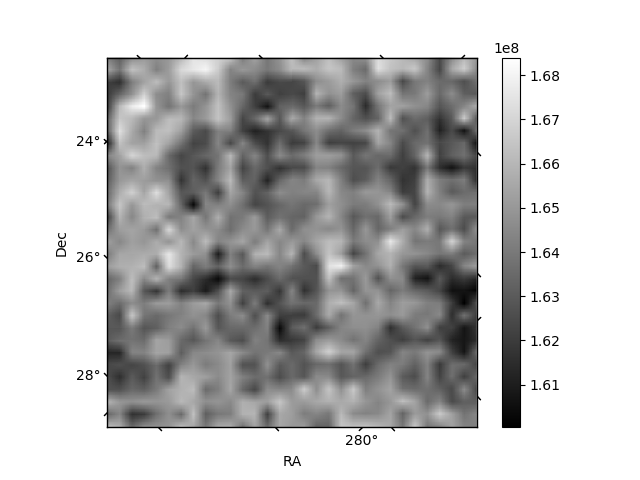
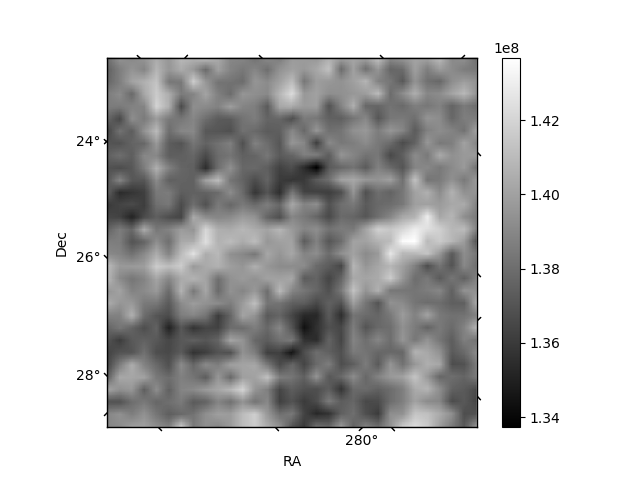
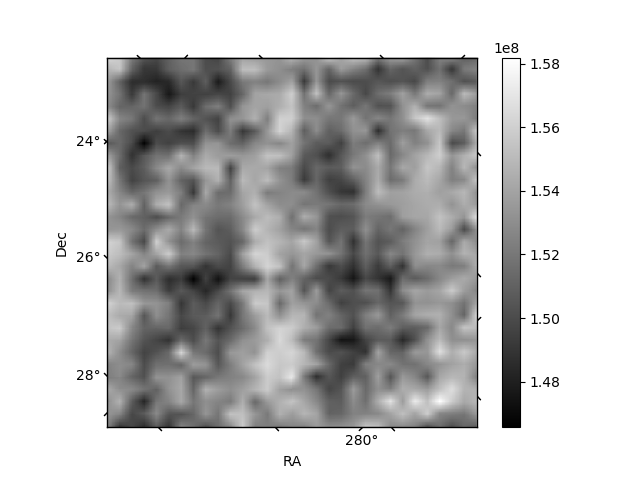
Histogram calculated using DETX and DETY for each event in the final _common_clean file
| Quadrant A | 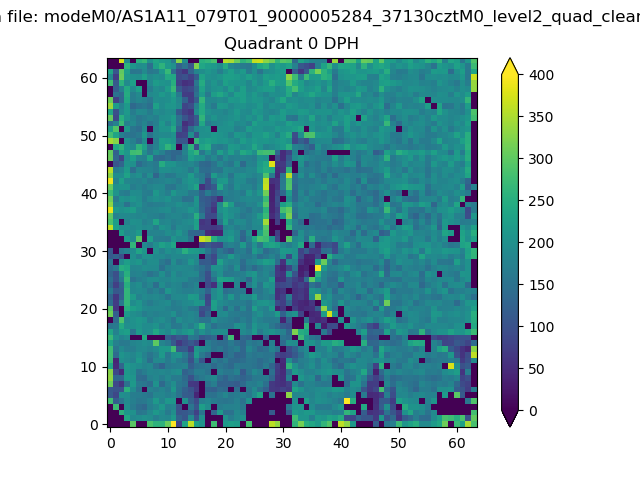 |
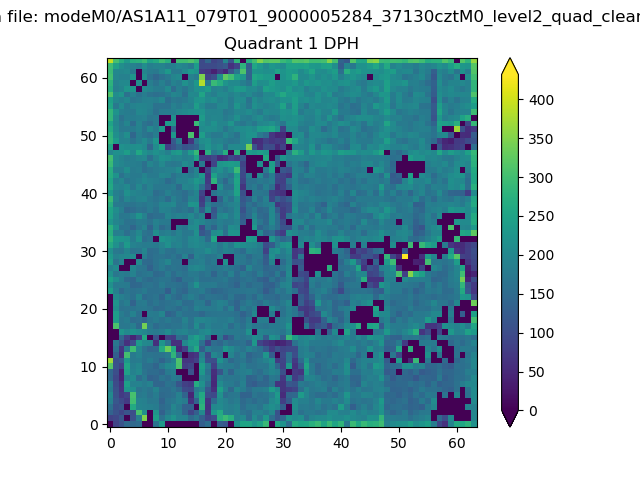 |
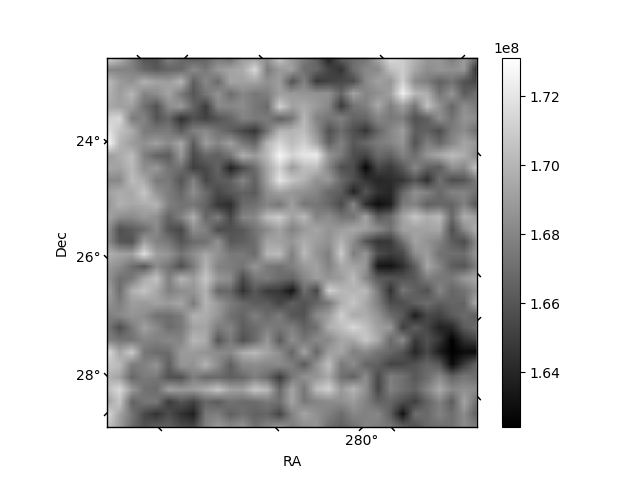
Quadrant B |
|---|---|---|---|
| Quadrant D | 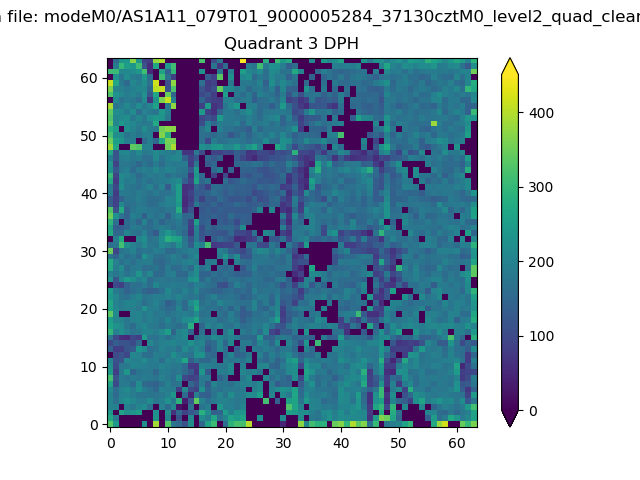 |
 |
Quadrant C |
| Plot type | Count rate plots | Images |
|---|---|---|
| Comparison with Poisson distribution Blue bars denote a histogram of data divided into 1 sec bins. Red curve is a Poisson curve with rate = median count rate of data. |
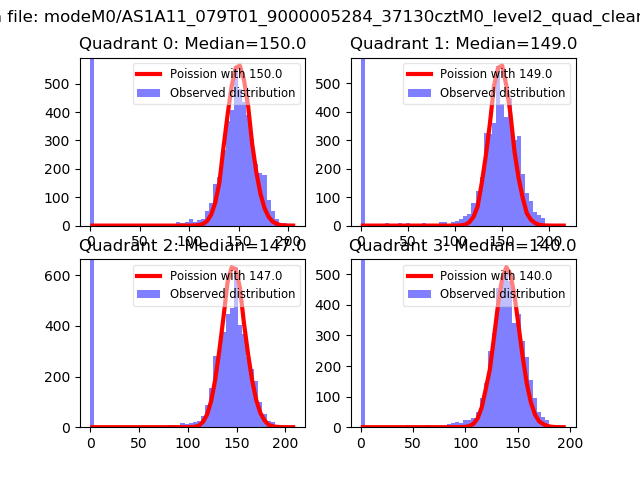 |
 |
| Quadrant-wise count rates Data is divided into 100 sec bins |
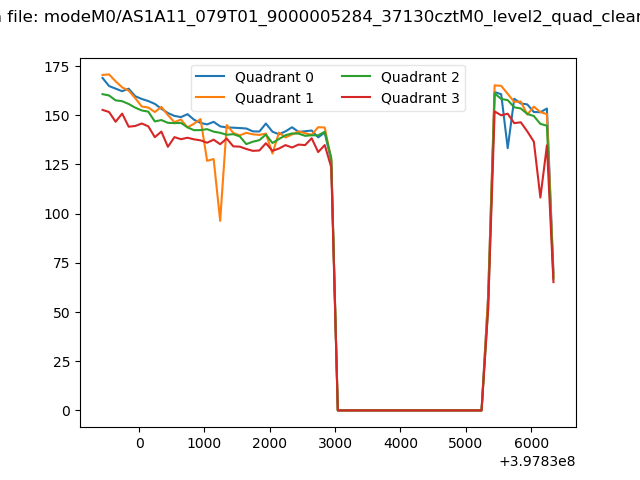 |
|
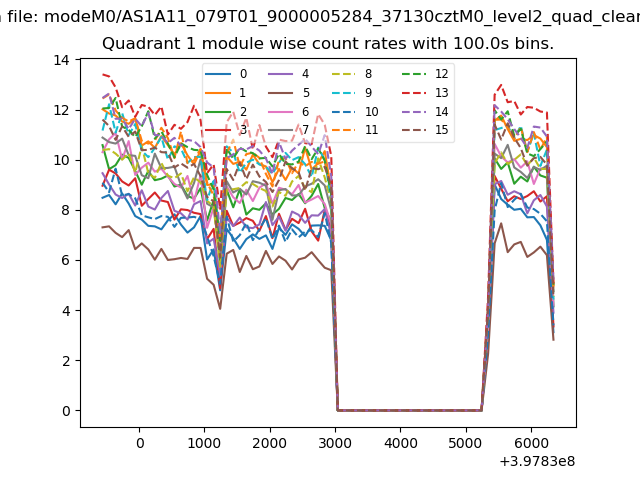
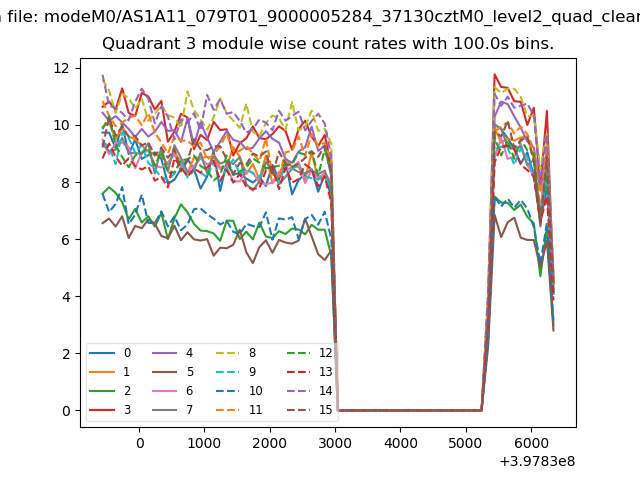
| Module-wise count rates for Quadrant A Data is divided into 100 sec bins |
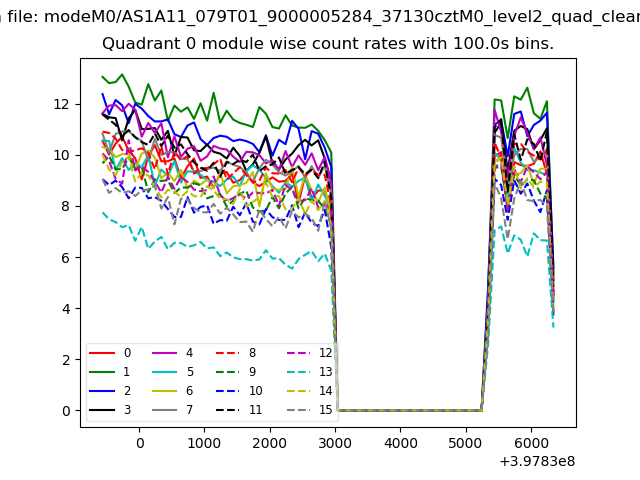 |
 |
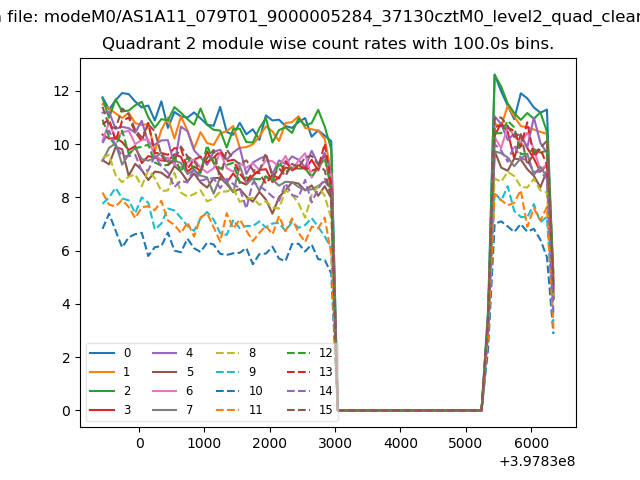
| Module-wise count rates for Quadrant B Data is divided into 100 sec bins |
 |
 |
| Module-wise count rates for Quadrant C Data is divided into 100 sec bins |
 |
 |
| Module-wise count rates for Quadrant D Data is divided into 100 sec bins |
 |
 |
| Parameter | Plot |
|---|---|
| CZT HV Monitor | 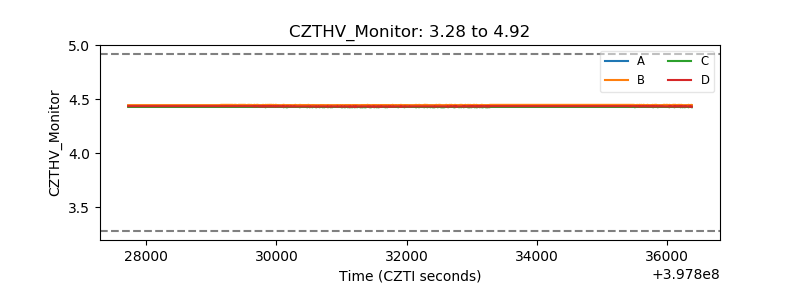 |
| D_VDD | 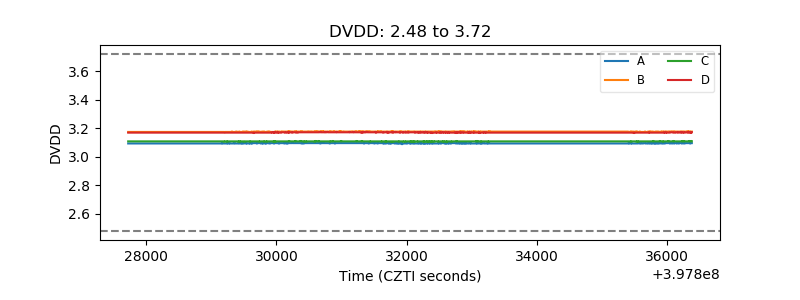 |
| Temperature 1 | 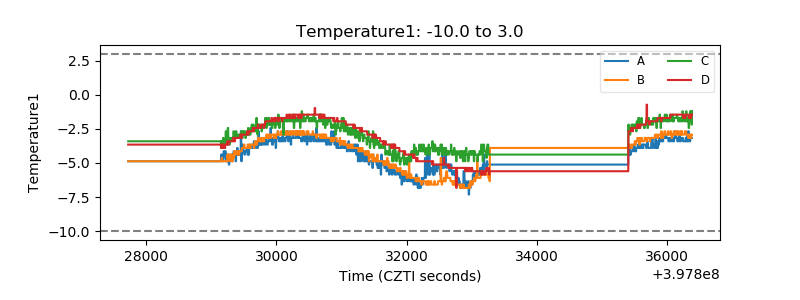 |
| Veto HV Monitor | 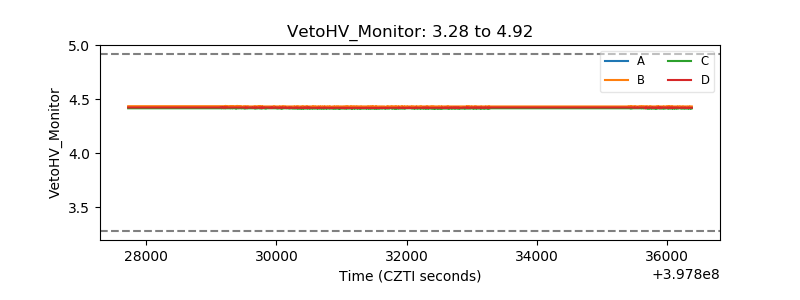 |
| Veto LLD | 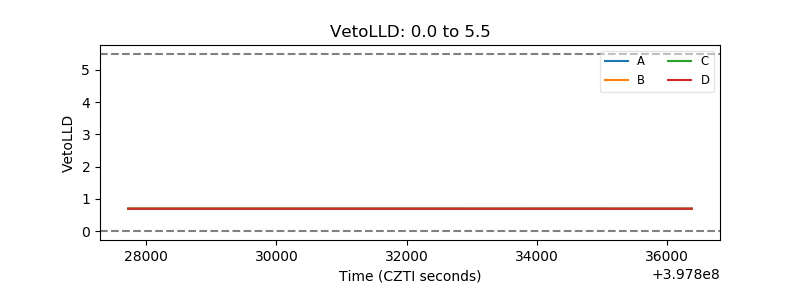 |
| Alpha Counter |  |
| _CPM_Rate | 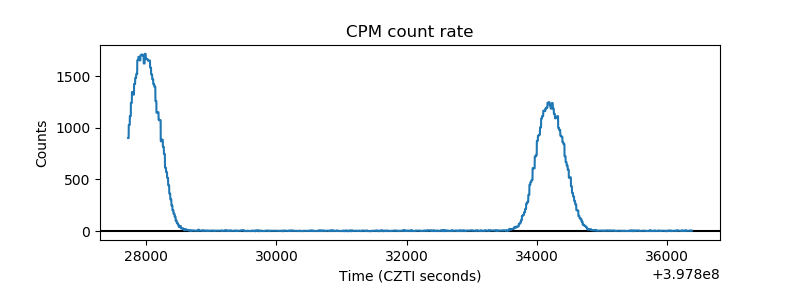 |
| CZT Counter | 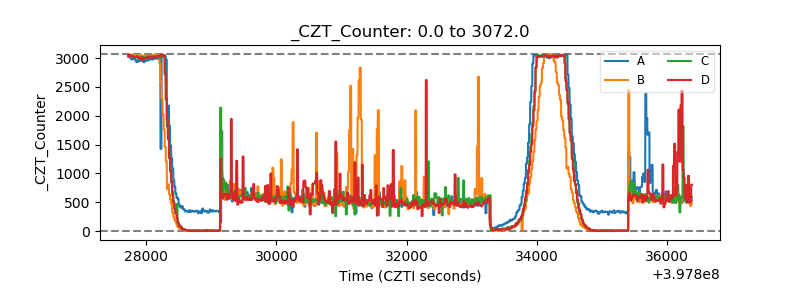 |
| +2.5 Volts monitor | 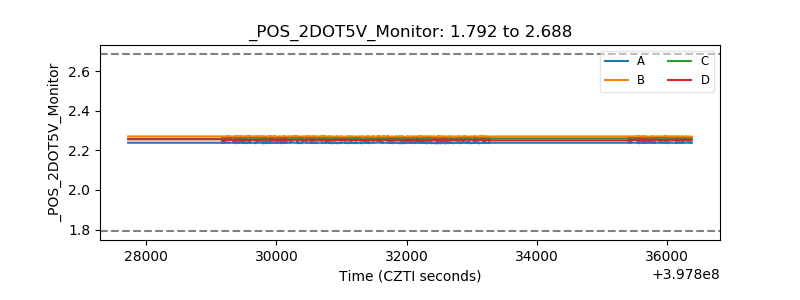 |
| +5 Volts monitor | 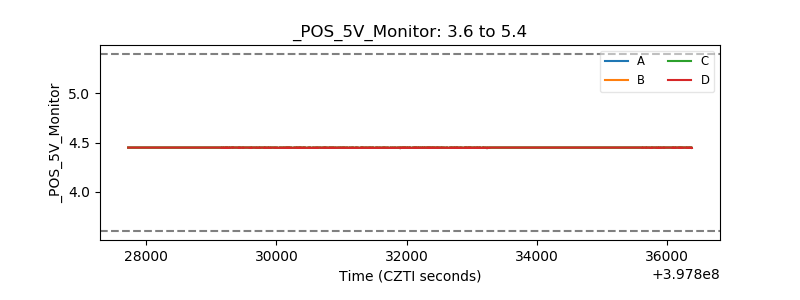 |
| _ROLL_ROT | 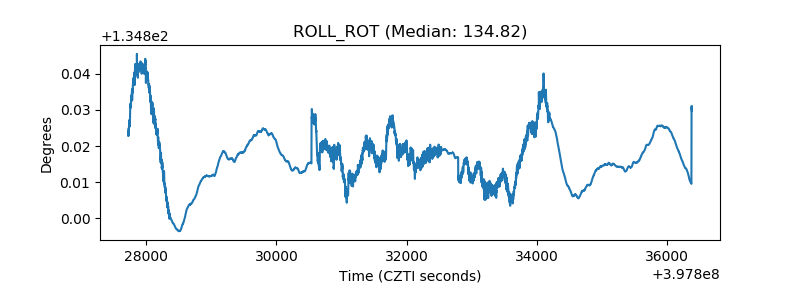 |
| _Roll_DEC | 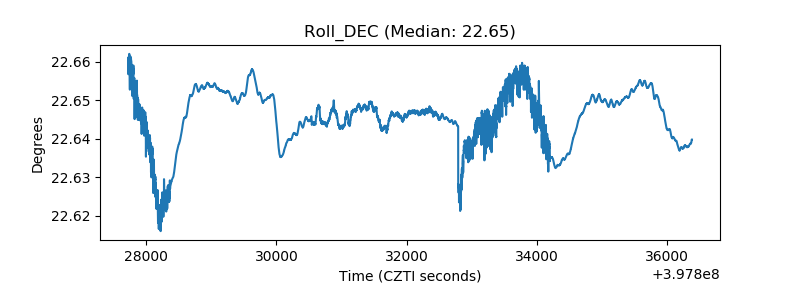 |
| _Roll_RA | 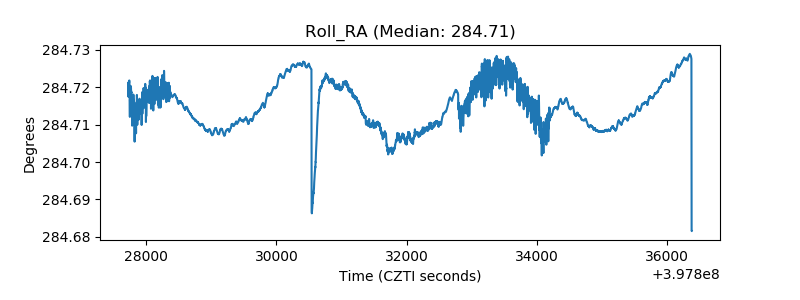 |
| Veto Counter | 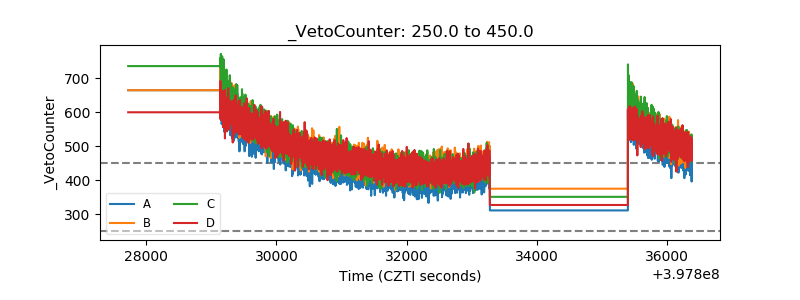 |