| Param | Original file | Final file |
|---|---|---|
| Filename | modeM0/AS1A11_079T01_9000005284_37132cztM0_level2.evt | modeM0/AS1A11_079T01_9000005284_37132cztM0_level2_quad_clean.evt |
| Size (bytes) | 377,873,280 | 79,441,920 |
| Size | 360.4 MB | 75.8 MB |
| Events in quadrant A | 2,584,770 | 523,417 |
| Events in quadrant B | 2,899,539 | 518,556 |
| Events in quadrant C | 2,876,196 | 513,750 |
| Events in quadrant D | 2,738,069 | 494,192 |
| Mode M9 | |||
|---|---|---|---|
| Quadrant | BADHDUFLAG | Total packets | Discarded packets |
| A | 0 | 21 | 0 |
| B | 0 | 21 | 0 |
| C | 0 | 21 | 0 |
| D | 0 | 22 | 0 |
| Mode SS | |||
|---|---|---|---|
| Quadrant | BADHDUFLAG | Total packets | Discarded packets |
| A | 0 | 102 | 0 |
| B | 0 | 102 | 0 |
| C | 0 | 102 | 0 |
| D | 0 | 102 | 0 |
| Mode M0 | |||
|---|---|---|---|
| Quadrant | BADHDUFLAG | Total packets | Discarded packets |
| A | 0 | 10880 | 3 |
| B | 0 | 11861 | 2 |
| C | 0 | 11582 | 2 |
| D | 0 | 11468 | 2 |
| Quadrant | Total seconds | Saturated seconds | Saturation percentage |
|---|---|---|---|
| A | 5082 | 8 | 0.157418% |
| B | 5082 | 112 | 2.203857% |
| C | 5082 | 51 | 1.003542% |
| D | 5082 | 39 | 0.767414% |
Noise dominated data is calculated using 1-second bins in cleaned event files. If a bin has >2000 counts, and if more than 50% of those come from <1% of pixels, then it is considered to be noise-dominated and hence unusable.
| Quadrant | # 1 sec bins | Bins with >0 counts | Bins with >2000 counts | High rate bins dominated by noise | Noise dominated (total time) | Noise dominated (detector-on time) | Marked lightcurve |
|---|---|---|---|---|---|---|---|
| A | 7116 | 5083 | 4 | 4 | 0.06% | 0.08% | 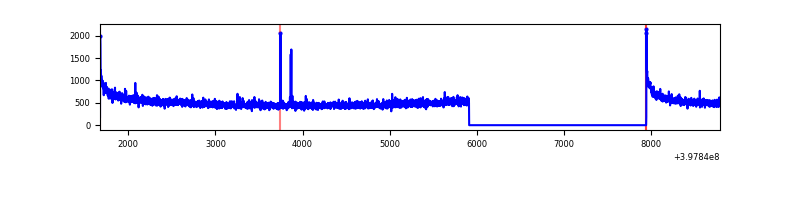 |
| B | 7116 | 5083 | 77 | 77 | 1.08% | 1.51% | 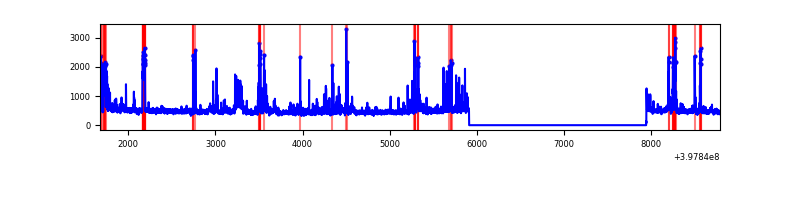 |
| C | 7116 | 5083 | 49 | 49 | 0.69% | 0.96% | 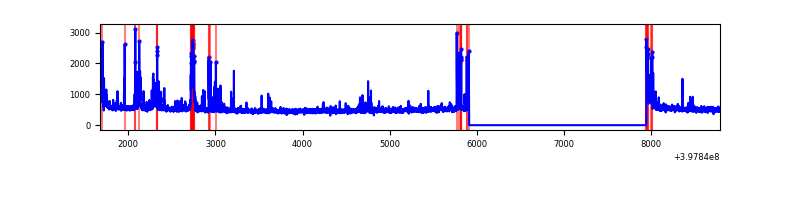 |
| D | 7116 | 5083 | 34 | 34 | 0.48% | 0.67% | 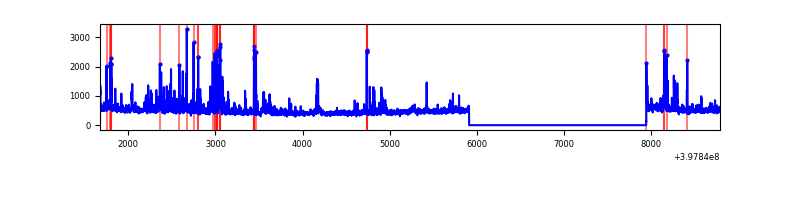 |
Top three noisy pixels from each quadrant. If the there are fewer than three noisy pixels in the level2.evt file, extra rows are filled as -1
| Pixel properties | Quadrant properties | ||||||
|---|---|---|---|---|---|---|---|
| Quadrant | DetID | PixID | Counts | Sigma | Mean | Median | Sigma |
| A | 10 | 83 | 251578 | 2077.22 | 596 | 585 | 120.8 |
| A | 13 | 6 | 9726 | 75.65 | 596 | 585 | 120.8 |
| A | 15 | 174 | 9617 | 74.75 | 596 | 585 | 120.8 |
| B | 5 | 172 | 256689 | 2294.48 | 584 | 570 | 111.6 |
| B | 5 | 200 | 168207 | 1501.8 | 584 | 570 | 111.6 |
| B | 15 | 32 | 91677 | 816.2 | 584 | 570 | 111.6 |
| C | 15 | 214 | 233544 | 1725.47 | 578 | 584 | 135.0 |
| C | 14 | 254 | 220705 | 1630.38 | 578 | 584 | 135.0 |
| C | 0 | 10 | 127234 | 938.06 | 578 | 584 | 135.0 |
| D | 12 | 233 | 123677 | 867.01 | 582 | 568 | 142.0 |
| D | 13 | 249 | 80278 | 561.37 | 582 | 568 | 142.0 |
| D | 2 | 153 | 51830 | 361.02 | 582 | 568 | 142.0 |
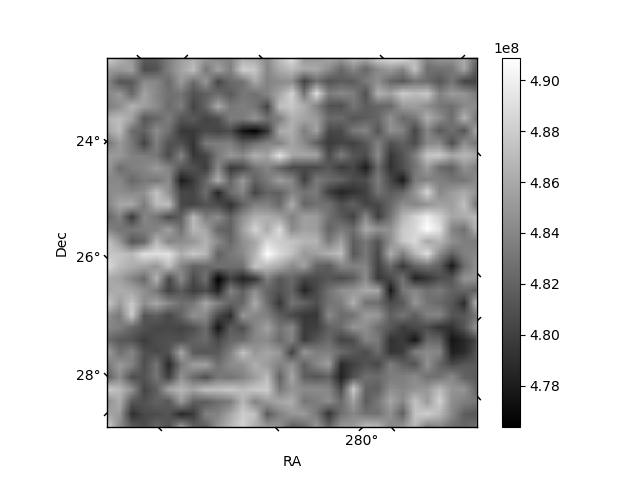
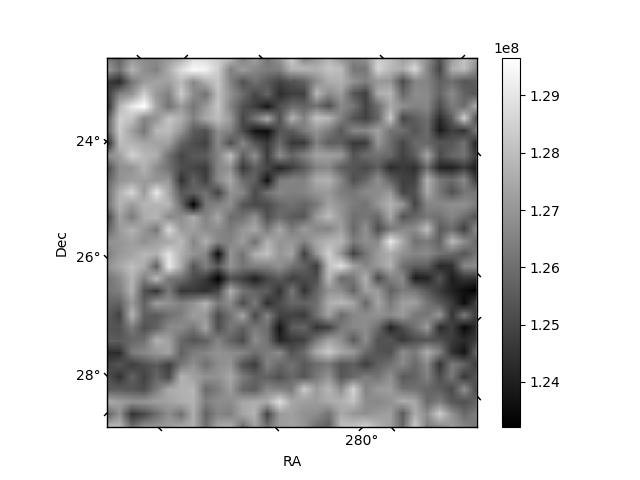
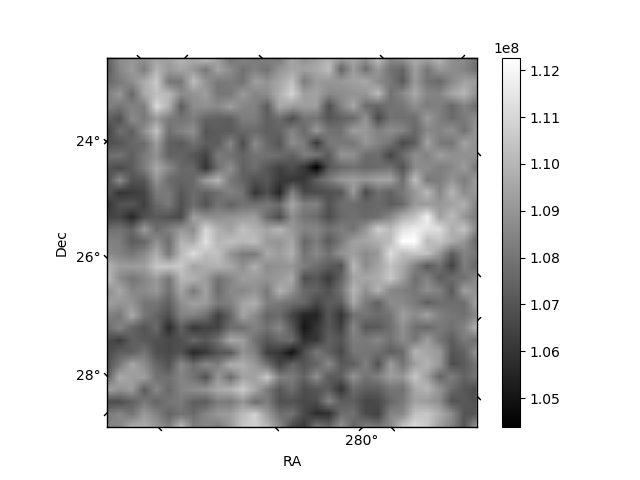
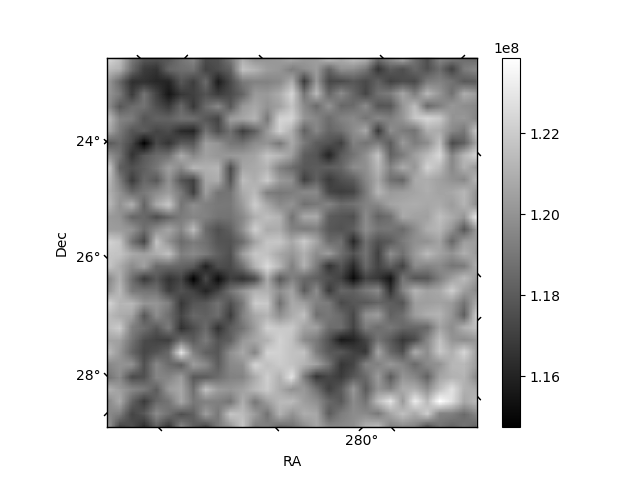
Histogram calculated using DETX and DETY for each event in the final _common_clean file
| Quadrant A | 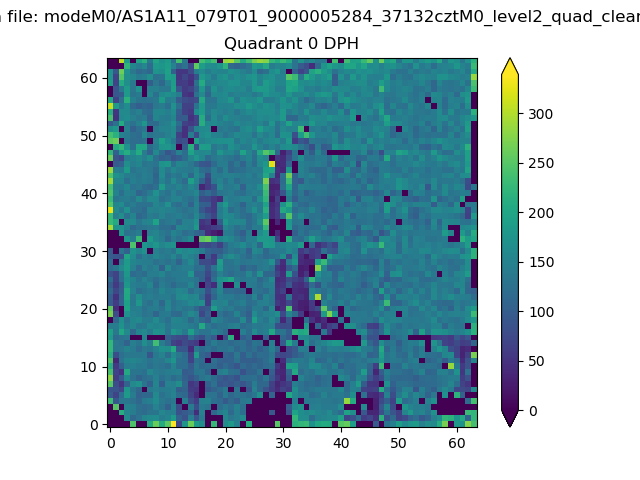 |
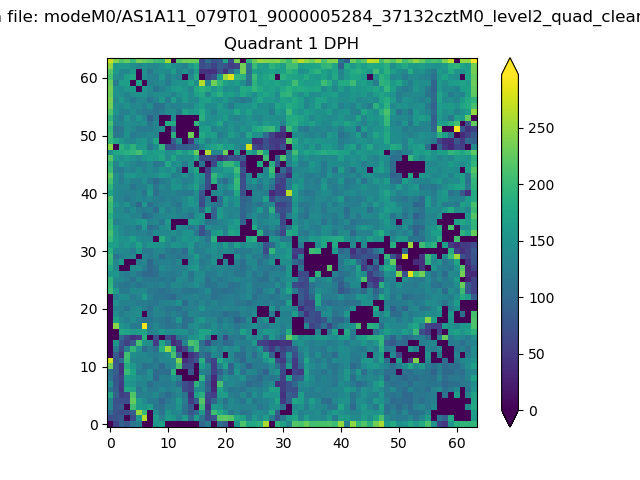 |
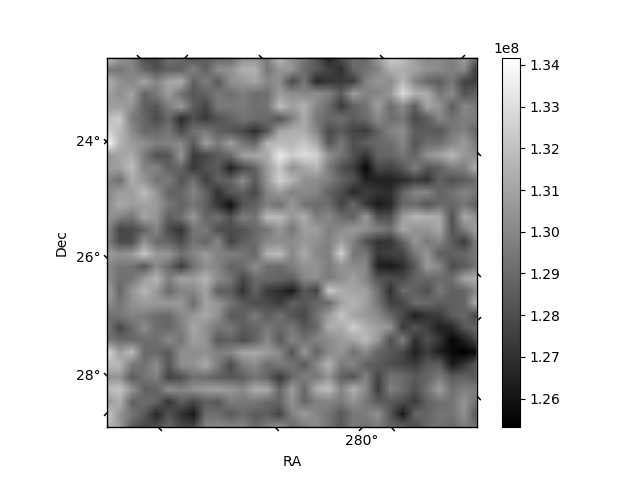
Quadrant B |
|---|---|---|---|
| Quadrant D | 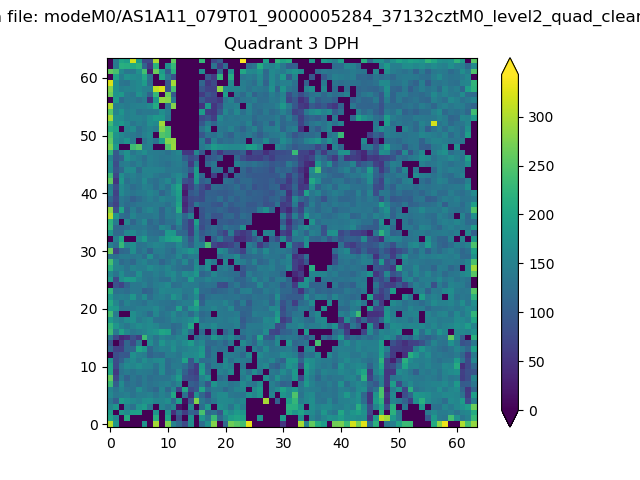 |
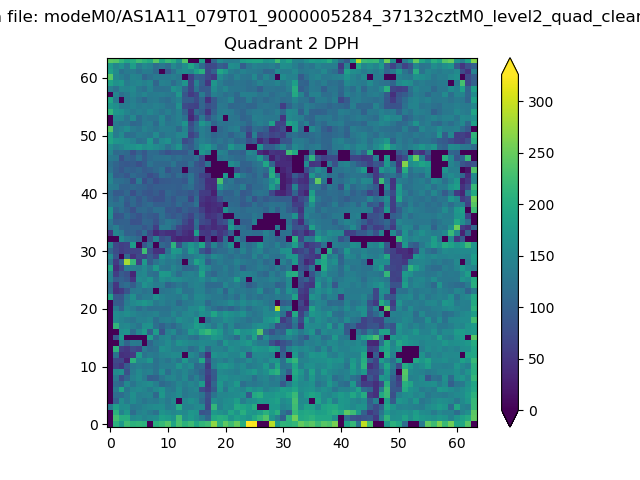 |
Quadrant C |
| Plot type | Count rate plots | Images |
|---|---|---|
| Comparison with Poisson distribution Blue bars denote a histogram of data divided into 1 sec bins. Red curve is a Poisson curve with rate = median count rate of data. |
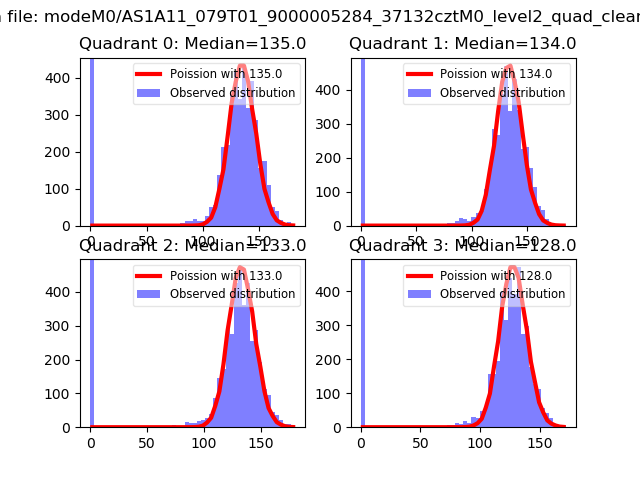 |
 |
| Quadrant-wise count rates Data is divided into 100 sec bins |
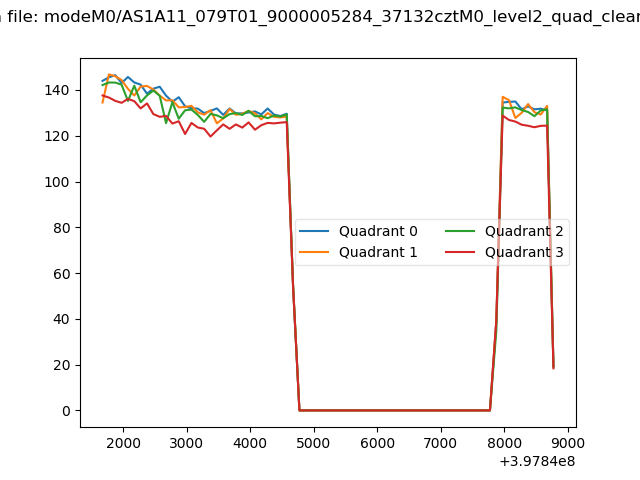 |
|
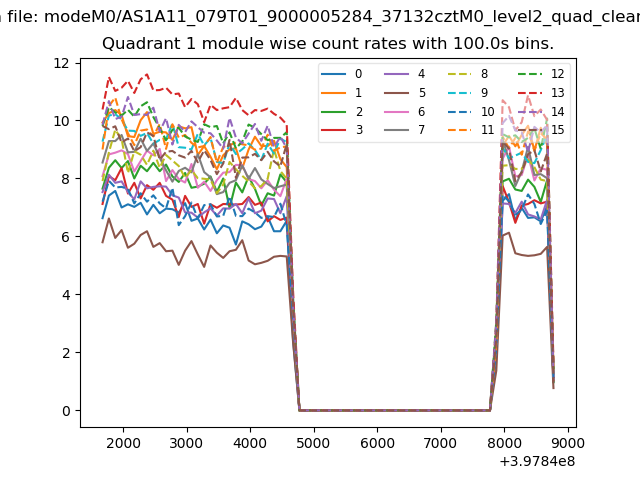
| Module-wise count rates for Quadrant A Data is divided into 100 sec bins |
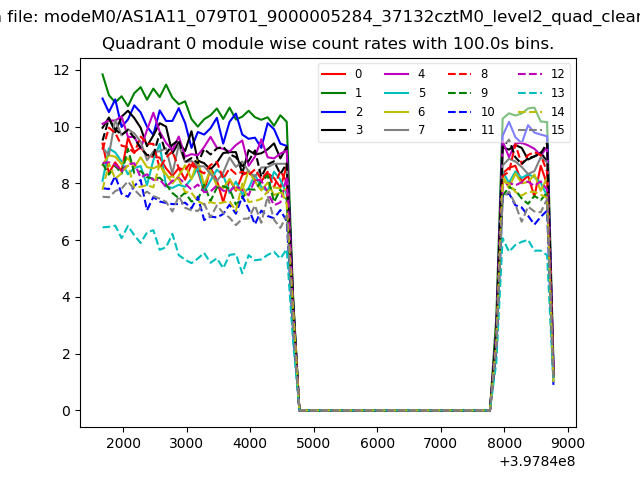 |
 |
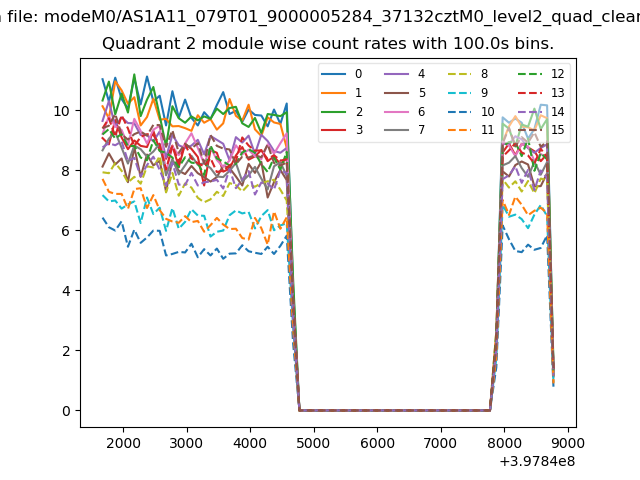
| Module-wise count rates for Quadrant B Data is divided into 100 sec bins |
 |
 |
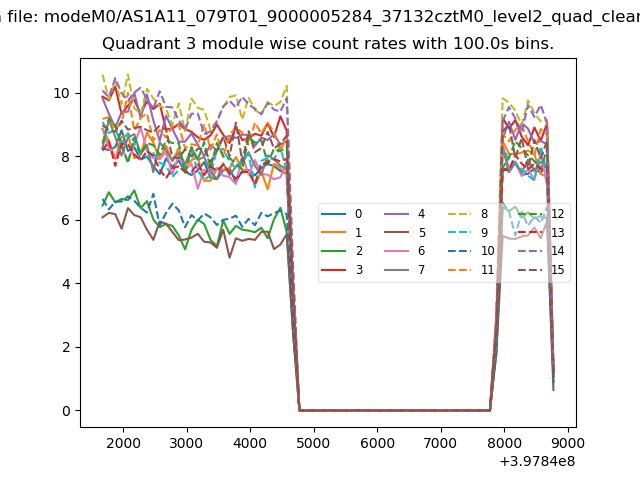
| Module-wise count rates for Quadrant C Data is divided into 100 sec bins |
 |
 |
| Module-wise count rates for Quadrant D Data is divided into 100 sec bins |
 |
 |
| Parameter | Plot |
|---|---|
| CZT HV Monitor | 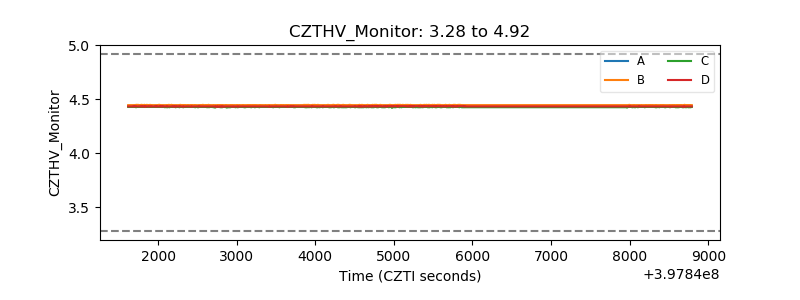 |
| D_VDD | 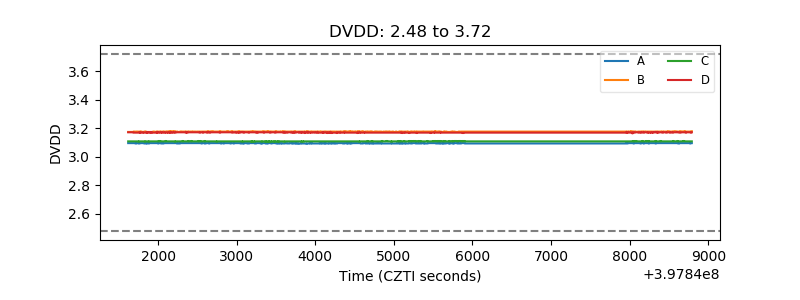 |
| Temperature 1 | 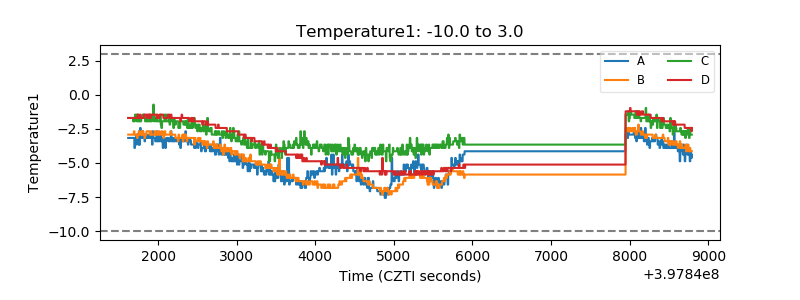 |
| Veto HV Monitor | 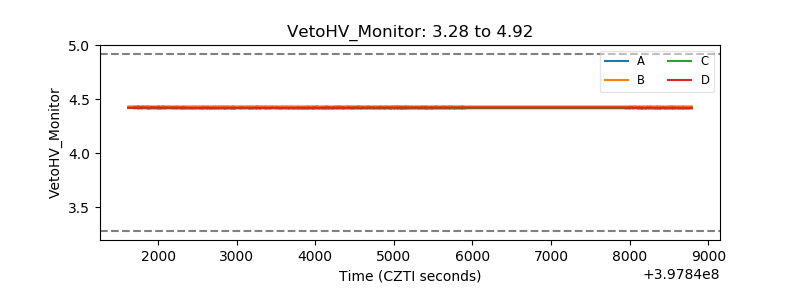 |
| Veto LLD | 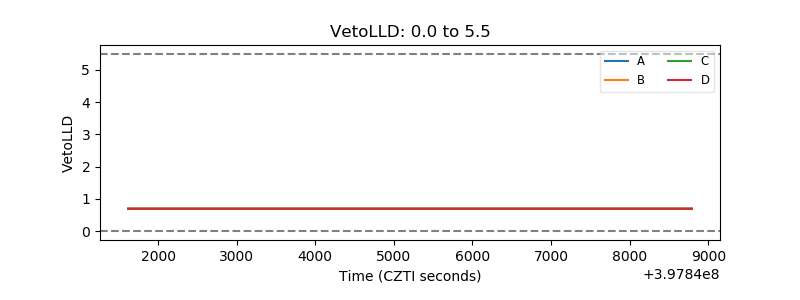 |
| Alpha Counter | 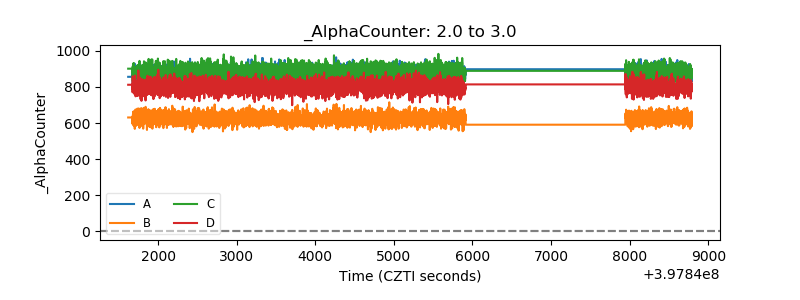 |
| _CPM_Rate | 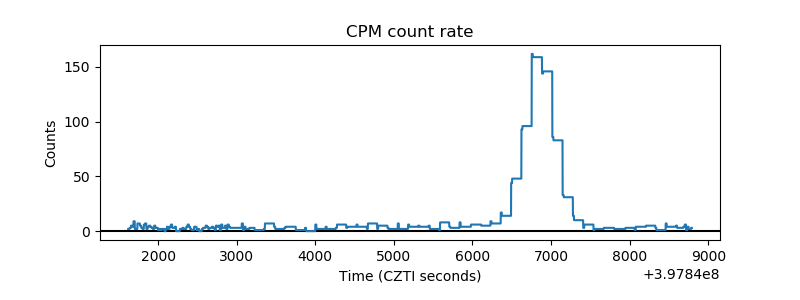 |
| CZT Counter | 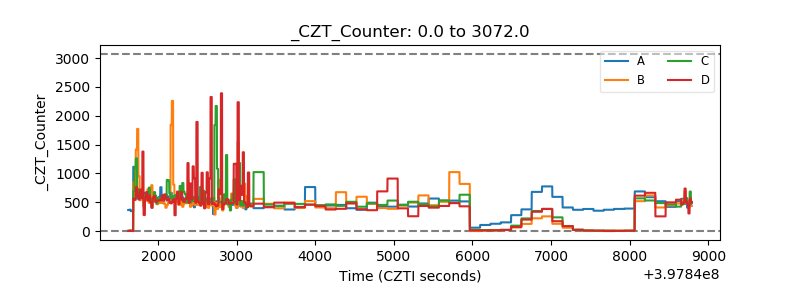 |
| +2.5 Volts monitor | 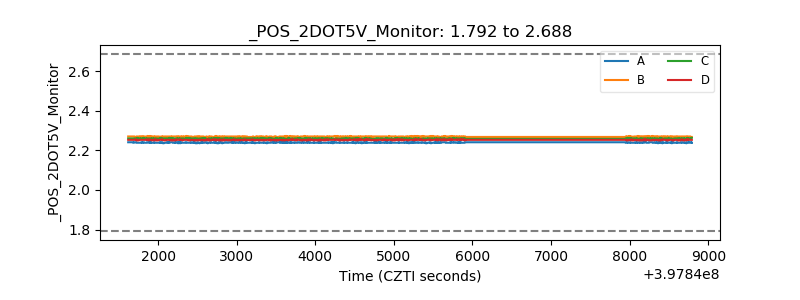 |
| +5 Volts monitor | 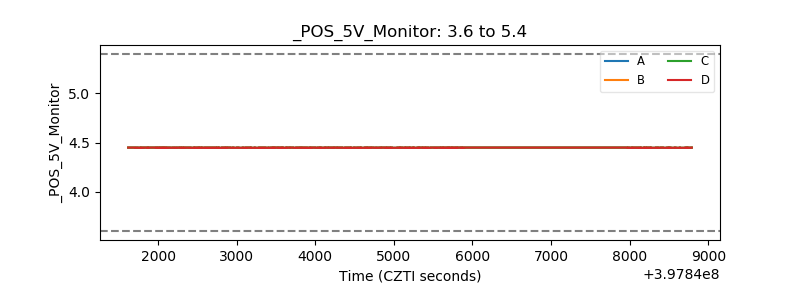 |
| _ROLL_ROT | 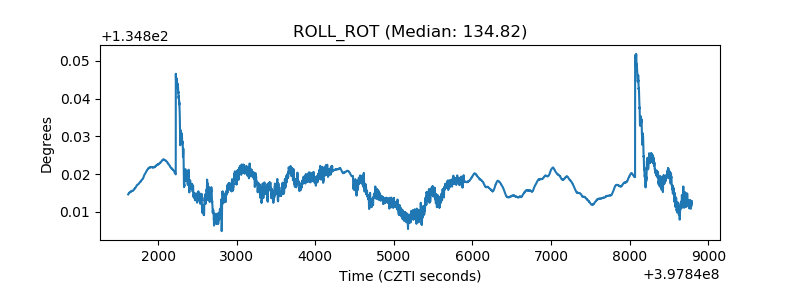 |
| _Roll_DEC | 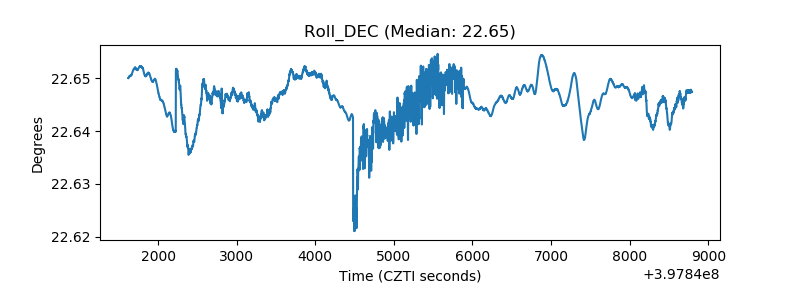 |
| _Roll_RA | 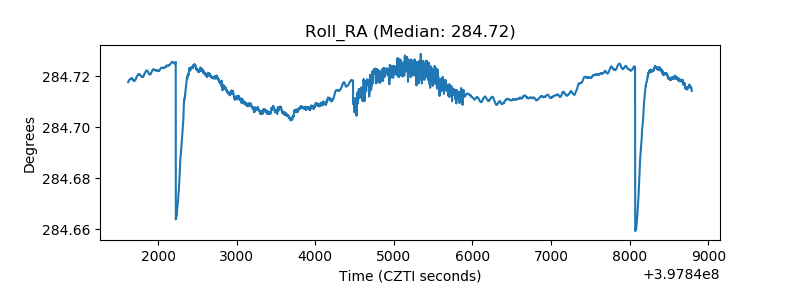 |
| Veto Counter | 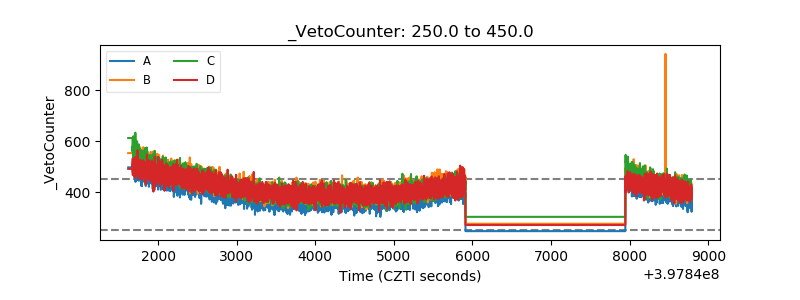 |