| Param | Original file | Final file |
|---|---|---|
| Filename | modeM0/AS1A11_079T01_9000005284_37133cztM0_level2.evt | modeM0/AS1A11_079T01_9000005284_37133cztM0_level2_quad_clean.evt |
| Size (bytes) | 411,788,160 | 69,128,640 |
| Size | 392.7 MB | 65.9 MB |
| Events in quadrant A | 2,692,767 | 437,849 |
| Events in quadrant B | 3,068,638 | 434,800 |
| Events in quadrant C | 3,133,118 | 432,161 |
| Events in quadrant D | 3,211,322 | 412,337 |
| Mode M9 | |||
|---|---|---|---|
| Quadrant | BADHDUFLAG | Total packets | Discarded packets |
| A | 0 | 22 | 0 |
| B | 0 | 22 | 0 |
| C | 0 | 22 | 0 |
| D | 0 | 23 | 0 |
| Mode SS | |||
|---|---|---|---|
| Quadrant | BADHDUFLAG | Total packets | Discarded packets |
| A | 0 | 110 | 0 |
| B | 0 | 110 | 0 |
| C | 0 | 110 | 0 |
| D | 0 | 110 | 0 |
| Mode M0 | |||
|---|---|---|---|
| Quadrant | BADHDUFLAG | Total packets | Discarded packets |
| A | 0 | 11484 | 3 |
| B | 0 | 12735 | 2 |
| C | 0 | 12584 | 2 |
| D | 0 | 13047 | 2 |
| Quadrant | Total seconds | Saturated seconds | Saturation percentage |
|---|---|---|---|
| A | 5368 | 19 | 0.353949% |
| B | 5368 | 179 | 3.334575% |
| C | 5368 | 90 | 1.676602% |
| D | 5368 | 128 | 2.384501% |
Noise dominated data is calculated using 1-second bins in cleaned event files. If a bin has >2000 counts, and if more than 50% of those come from <1% of pixels, then it is considered to be noise-dominated and hence unusable.
| Quadrant | # 1 sec bins | Bins with >0 counts | Bins with >2000 counts | High rate bins dominated by noise | Noise dominated (total time) | Noise dominated (detector-on time) | Marked lightcurve |
|---|---|---|---|---|---|---|---|
| A | 7100 | 5369 | 9 | 9 | 0.13% | 0.17% | 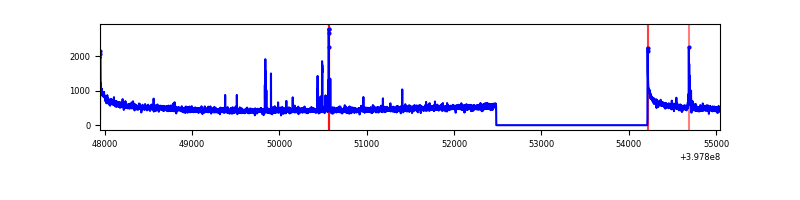 |
| B | 7100 | 5369 | 116 | 116 | 1.63% | 2.16% | 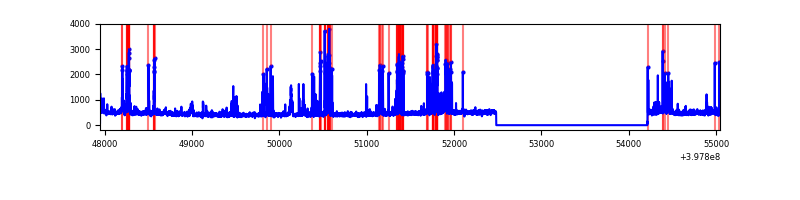 |
| C | 7100 | 5369 | 78 | 78 | 1.10% | 1.45% | 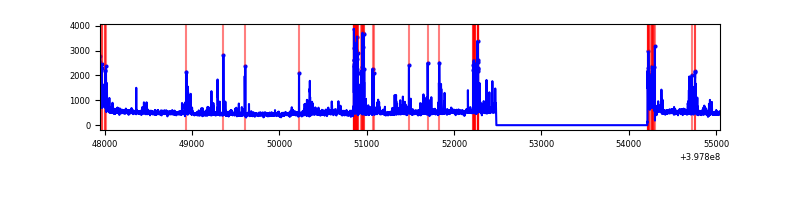 |
| D | 7100 | 5369 | 122 | 122 | 1.72% | 2.27% | 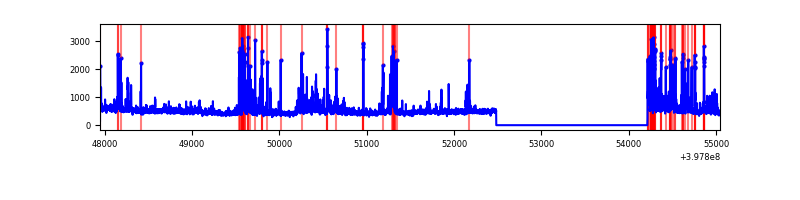 |
Top three noisy pixels from each quadrant. If the there are fewer than three noisy pixels in the level2.evt file, extra rows are filled as -1
| Pixel properties | Quadrant properties | ||||||
|---|---|---|---|---|---|---|---|
| Quadrant | DetID | PixID | Counts | Sigma | Mean | Median | Sigma |
| A | 10 | 83 | 258929 | 2096.22 | 608 | 596 | 123.2 |
| A | 9 | 143 | 71333 | 573.99 | 608 | 596 | 123.2 |
| A | 13 | 6 | 9830 | 74.93 | 608 | 596 | 123.2 |
| B | 5 | 172 | 556505 | 4820.61 | 595 | 579 | 115.3 |
| B | 5 | 200 | 74779 | 643.41 | 595 | 579 | 115.3 |
| B | 5 | 184 | 54335 | 466.14 | 595 | 579 | 115.3 |
| C | 14 | 254 | 325249 | 2351.59 | 590 | 594 | 138.1 |
| C | 15 | 214 | 245853 | 1776.5 | 590 | 594 | 138.1 |
| C | 0 | 10 | 168615 | 1217.04 | 590 | 594 | 138.1 |
| D | 2 | 249 | 246919 | 1705.03 | 589 | 573 | 144.5 |
| D | 13 | 249 | 204535 | 1411.68 | 589 | 573 | 144.5 |
| D | 12 | 235 | 190550 | 1314.88 | 589 | 573 | 144.5 |
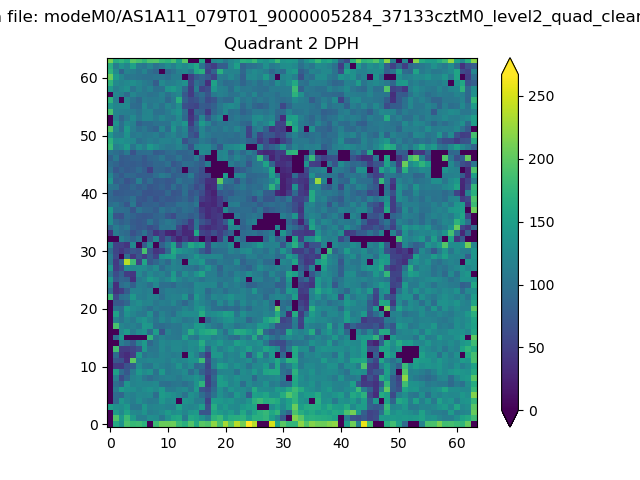
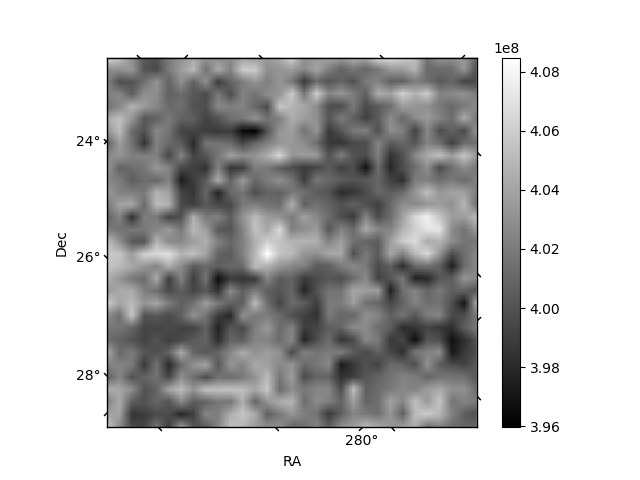
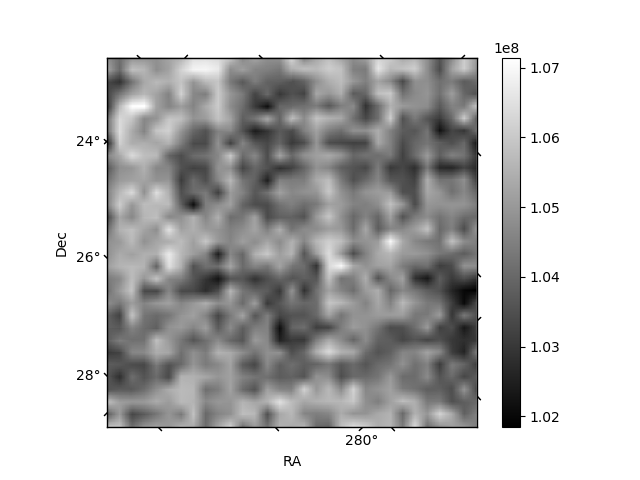
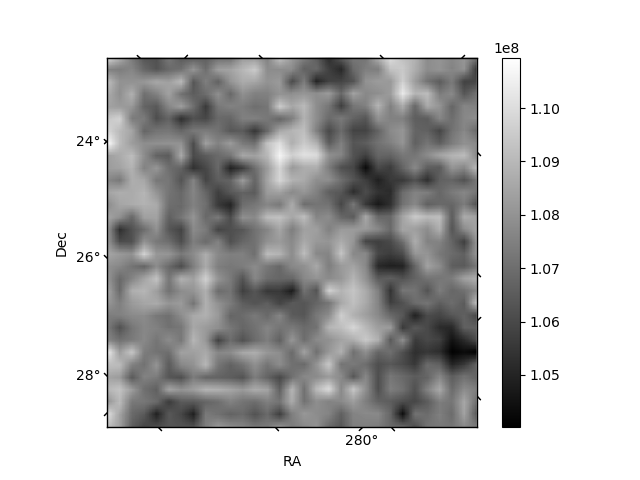
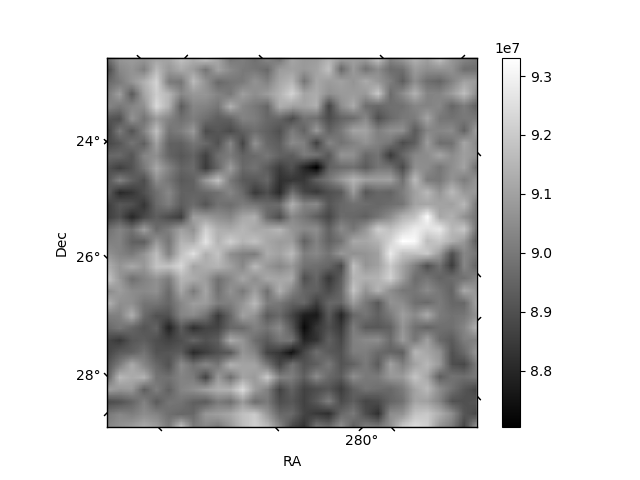
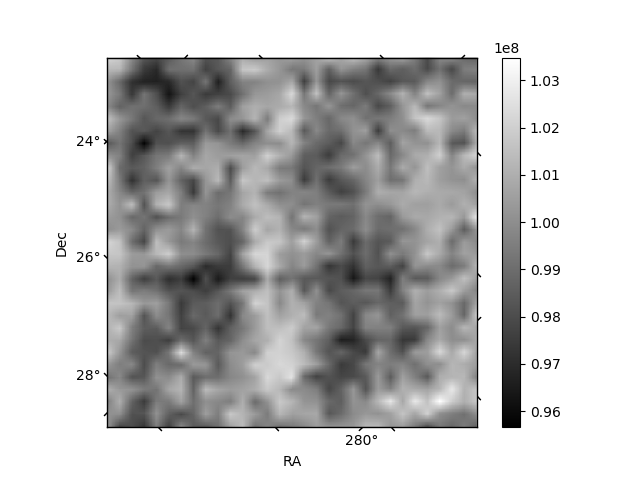
Histogram calculated using DETX and DETY for each event in the final _common_clean file
| Quadrant A | 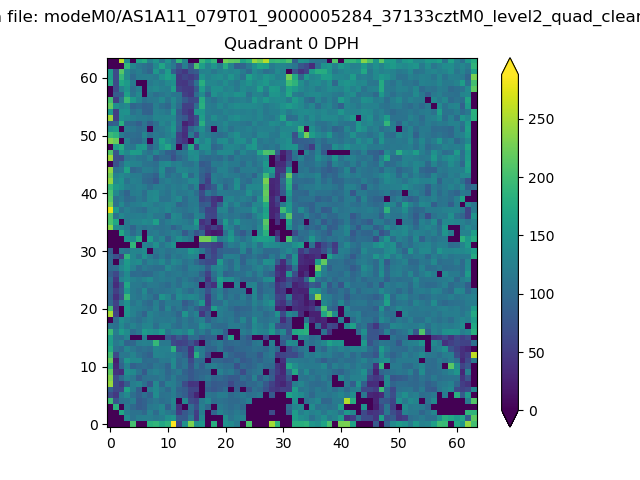 |
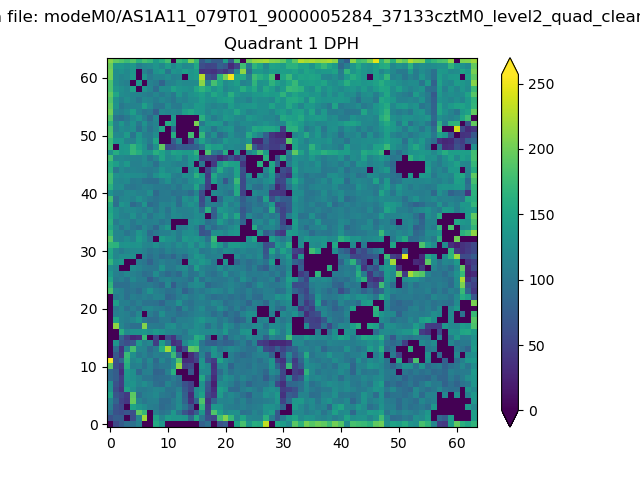 |
Quadrant B |
|---|---|---|---|
| Quadrant D | 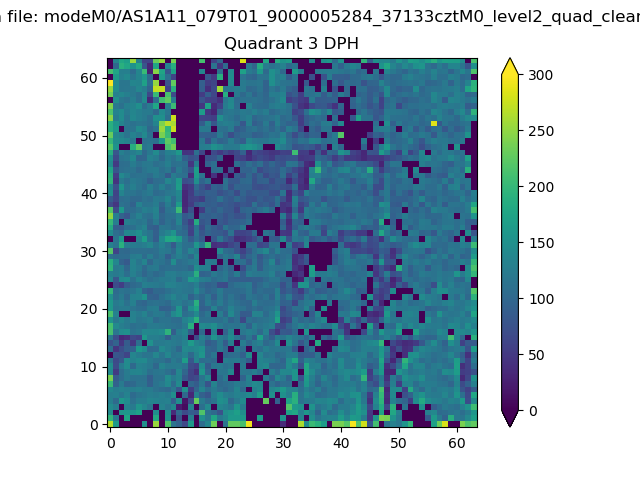 |
 |
Quadrant C |
| Plot type | Count rate plots | Images |
|---|---|---|
| Comparison with Poisson distribution Blue bars denote a histogram of data divided into 1 sec bins. Red curve is a Poisson curve with rate = median count rate of data. |
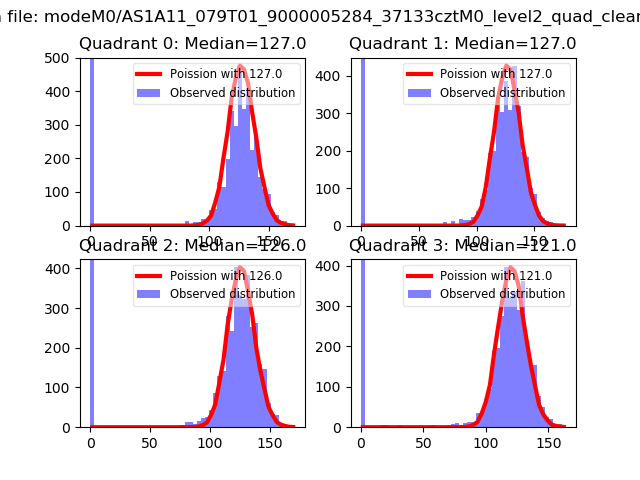 |
 |
| Quadrant-wise count rates Data is divided into 100 sec bins |
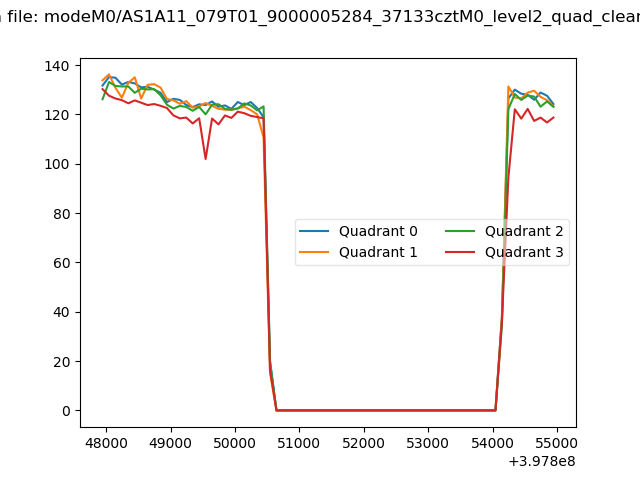 |
|
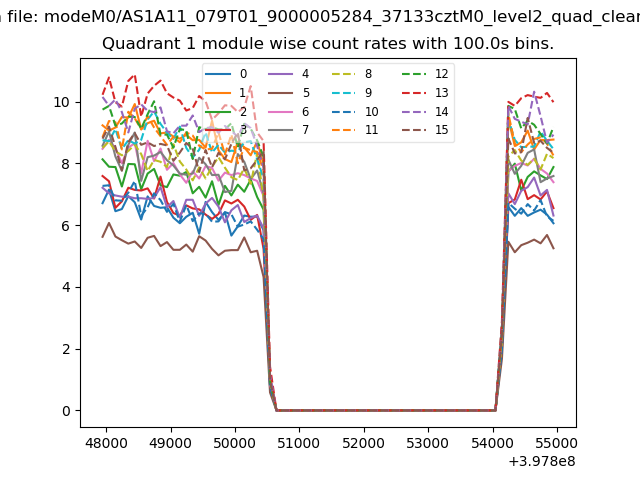
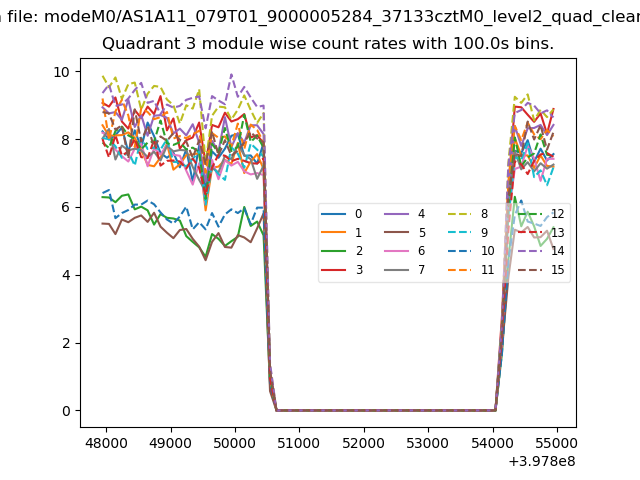
| Module-wise count rates for Quadrant A Data is divided into 100 sec bins |
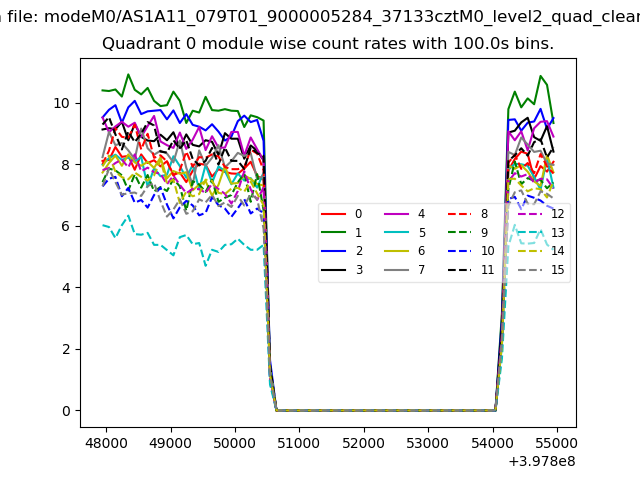 |
 |
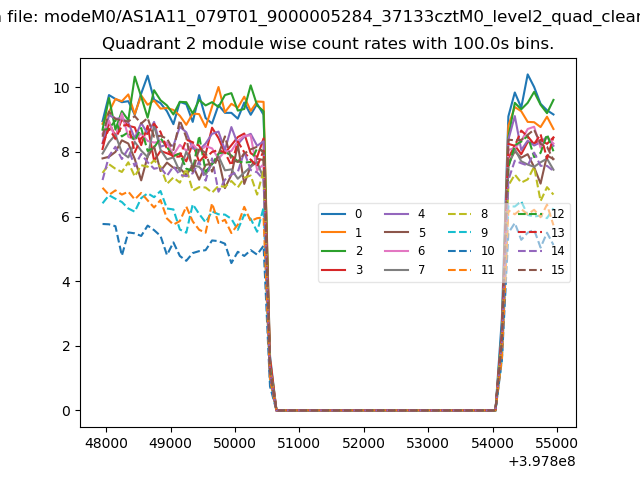
| Module-wise count rates for Quadrant B Data is divided into 100 sec bins |
 |
 |
| Module-wise count rates for Quadrant C Data is divided into 100 sec bins |
 |
 |
| Module-wise count rates for Quadrant D Data is divided into 100 sec bins |
 |
 |
| Parameter | Plot |
|---|---|
| CZT HV Monitor | 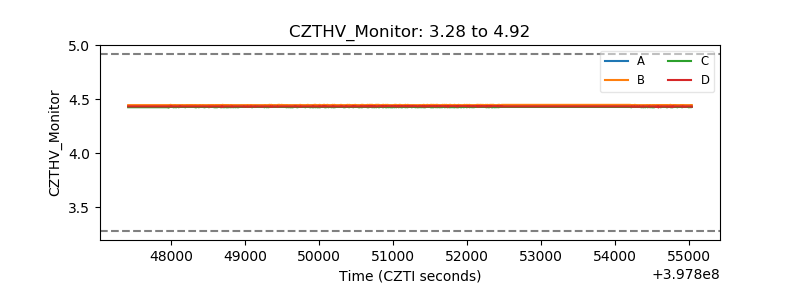 |
| D_VDD | 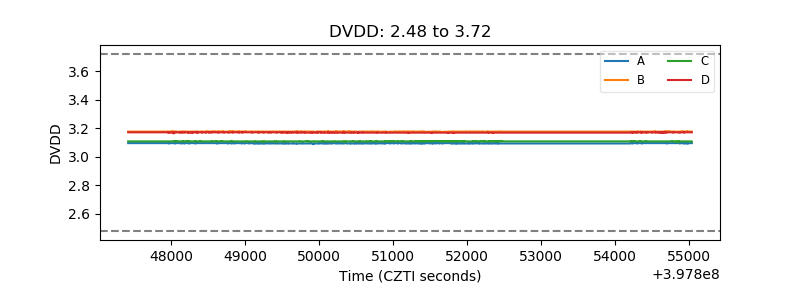 |
| Temperature 1 | 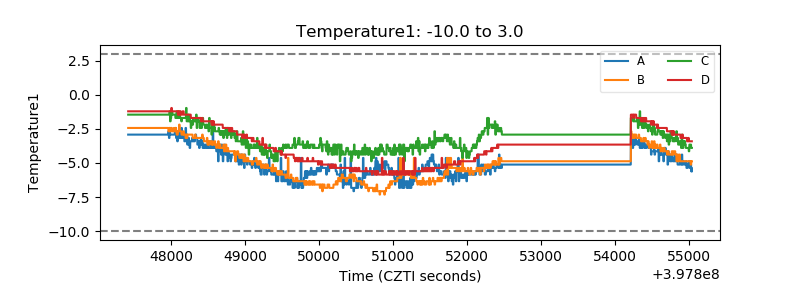 |
| Veto HV Monitor | 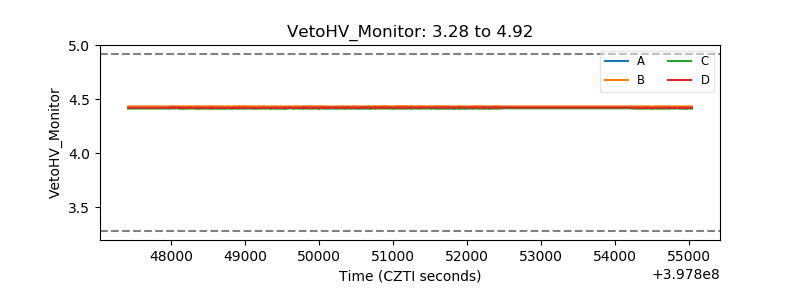 |
| Veto LLD | 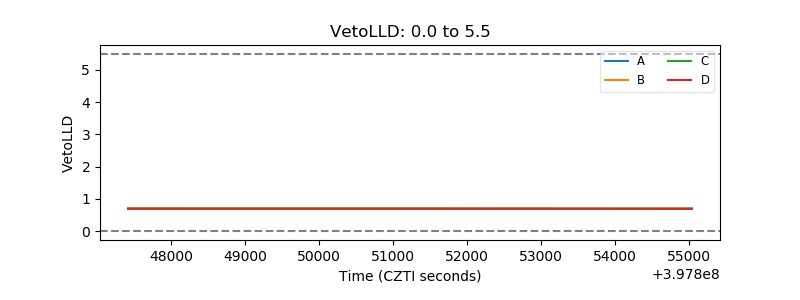 |
| Alpha Counter | 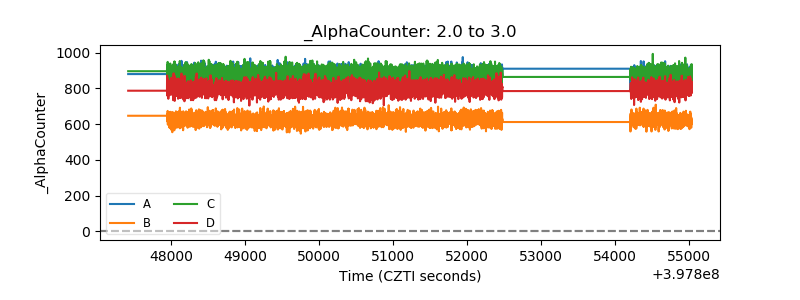 |
| _CPM_Rate | 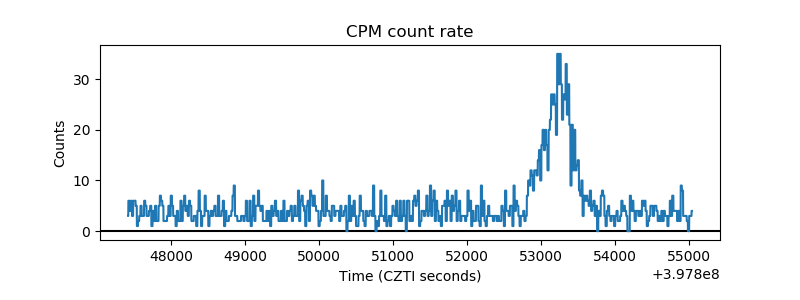 |
| CZT Counter | 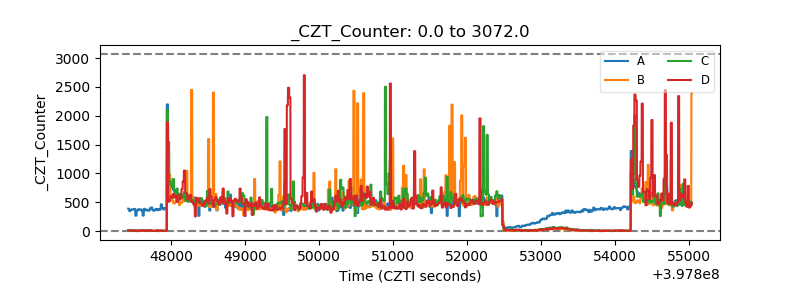 |
| +2.5 Volts monitor | 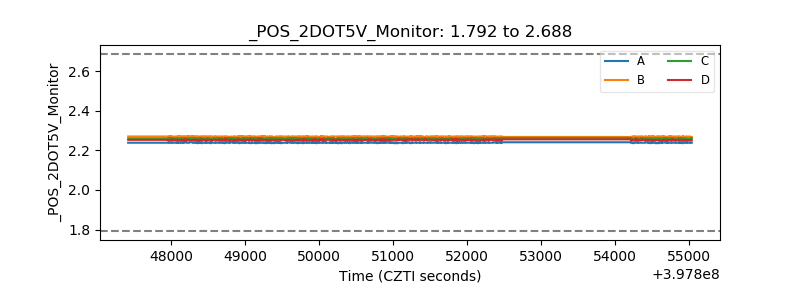 |
| +5 Volts monitor | 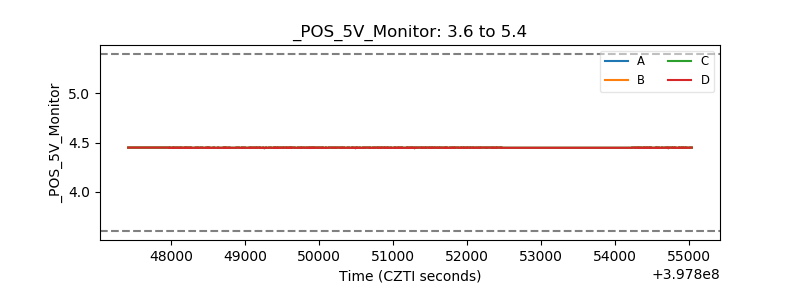 |
| _ROLL_ROT | 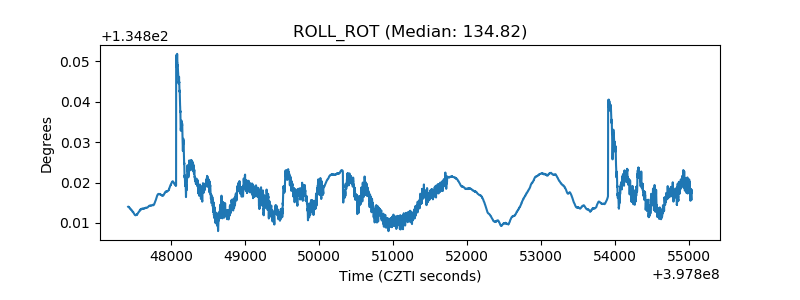 |
| _Roll_DEC | 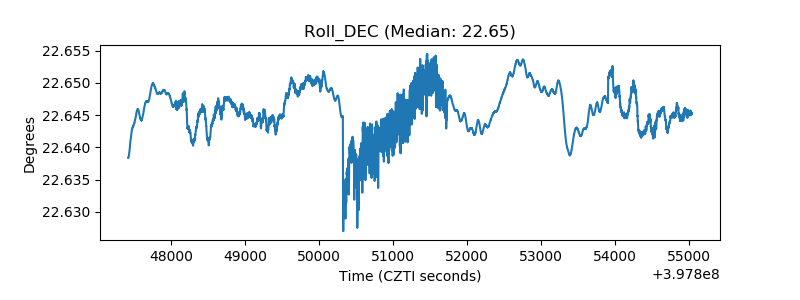 |
| _Roll_RA | 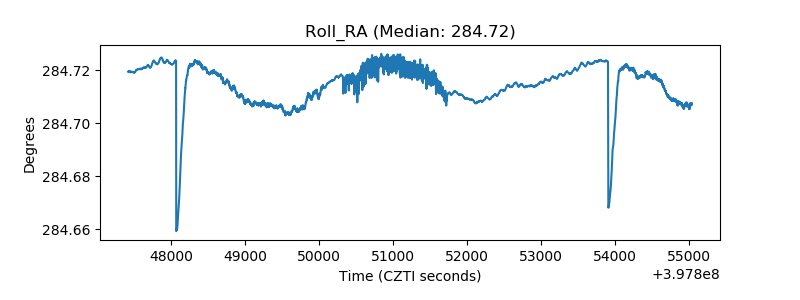 |
| Veto Counter | 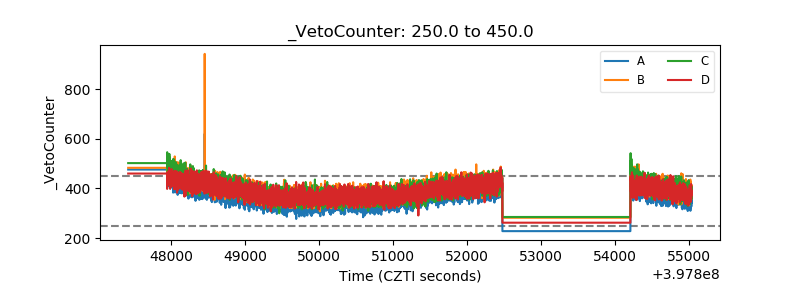 |