| Param | Original file | Final file |
|---|---|---|
| Filename | modeM0/AS1A11_079T01_9000005284_37135cztM0_level2.evt | modeM0/AS1A11_079T01_9000005284_37135cztM0_level2_quad_clean.evt |
| Size (bytes) | 436,455,360 | 71,127,360 |
| Size | 416.2 MB | 67.8 MB |
| Events in quadrant A | 2,846,554 | 450,733 |
| Events in quadrant B | 2,792,532 | 447,904 |
| Events in quadrant C | 3,164,514 | 442,773 |
| Events in quadrant D | 4,017,493 | 403,935 |
| Mode M9 | |||
|---|---|---|---|
| Quadrant | BADHDUFLAG | Total packets | Discarded packets |
| A | 0 | 22 | 0 |
| B | 0 | 22 | 0 |
| C | 0 | 22 | 0 |
| D | 0 | 23 | 0 |
| Mode SS | |||
|---|---|---|---|
| Quadrant | BADHDUFLAG | Total packets | Discarded packets |
| A | 0 | 118 | 0 |
| B | 0 | 118 | 0 |
| C | 0 | 118 | 0 |
| D | 0 | 118 | 0 |
| Mode M0 | |||
|---|---|---|---|
| Quadrant | BADHDUFLAG | Total packets | Discarded packets |
| A | 0 | 12274 | 3 |
| B | 0 | 12369 | 2 |
| C | 0 | 13119 | 2 |
| D | 0 | 15972 | 2 |
| Quadrant | Total seconds | Saturated seconds | Saturation percentage |
|---|---|---|---|
| A | 5843 | 9 | 0.154030% |
| B | 5843 | 43 | 0.735923% |
| C | 5843 | 59 | 1.009755% |
| D | 5843 | 396 | 6.777340% |
Noise dominated data is calculated using 1-second bins in cleaned event files. If a bin has >2000 counts, and if more than 50% of those come from <1% of pixels, then it is considered to be noise-dominated and hence unusable.
| Quadrant | # 1 sec bins | Bins with >0 counts | Bins with >2000 counts | High rate bins dominated by noise | Noise dominated (total time) | Noise dominated (detector-on time) | Marked lightcurve |
|---|---|---|---|---|---|---|---|
| A | 7126 | 5844 | 1 | 1 | 0.01% | 0.02% | 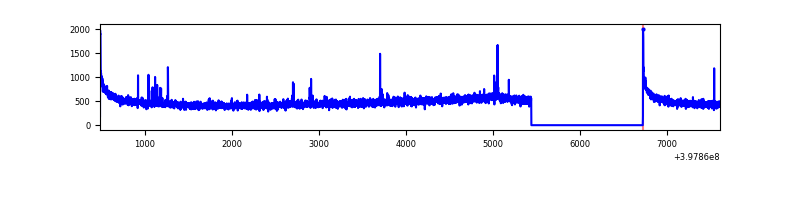 |
| B | 7126 | 5844 | 23 | 23 | 0.32% | 0.39% | 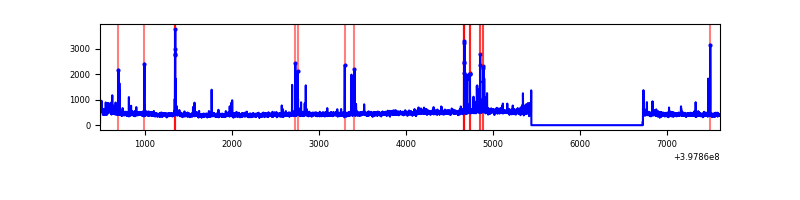 |
| C | 7126 | 5844 | 46 | 46 | 0.65% | 0.79% | 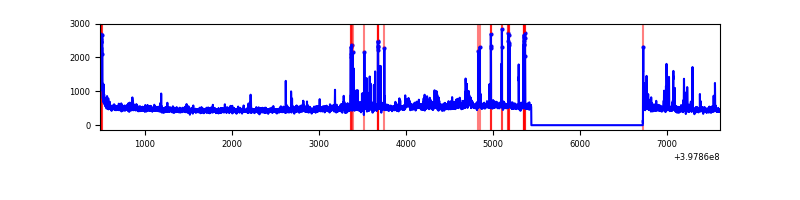 |
| D | 7126 | 5844 | 343 | 343 | 4.81% | 5.87% | 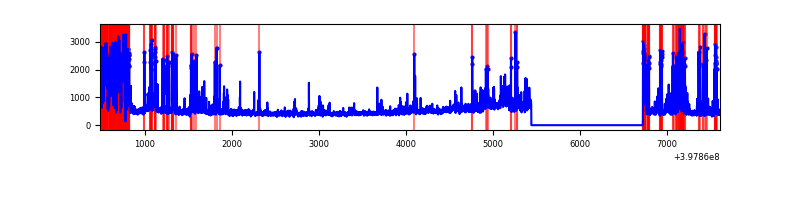 |
Top three noisy pixels from each quadrant. If the there are fewer than three noisy pixels in the level2.evt file, extra rows are filled as -1
| Pixel properties | Quadrant properties | ||||||
|---|---|---|---|---|---|---|---|
| Quadrant | DetID | PixID | Counts | Sigma | Mean | Median | Sigma |
| A | 10 | 83 | 263004 | 1970.66 | 657 | 643 | 133.1 |
| A | 15 | 174 | 16768 | 121.12 | 657 | 643 | 133.1 |
| A | 9 | 143 | 13712 | 98.16 | 657 | 643 | 133.1 |
| B | 5 | 172 | 102477 | 809.63 | 650 | 632 | 125.8 |
| B | 5 | 255 | 32474 | 253.13 | 650 | 632 | 125.8 |
| B | 0 | 213 | 27934 | 217.04 | 650 | 632 | 125.8 |
| C | 15 | 214 | 269590 | 1795.4 | 638 | 644 | 149.8 |
| C | 10 | 49 | 176159 | 1171.68 | 638 | 644 | 149.8 |
| C | 14 | 254 | 141956 | 943.36 | 638 | 644 | 149.8 |
| D | 2 | 249 | 1024662 | 6770.13 | 620 | 604 | 151.3 |
| D | 12 | 235 | 264350 | 1743.65 | 620 | 604 | 151.3 |
| D | 13 | 249 | 211065 | 1391.38 | 620 | 604 | 151.3 |
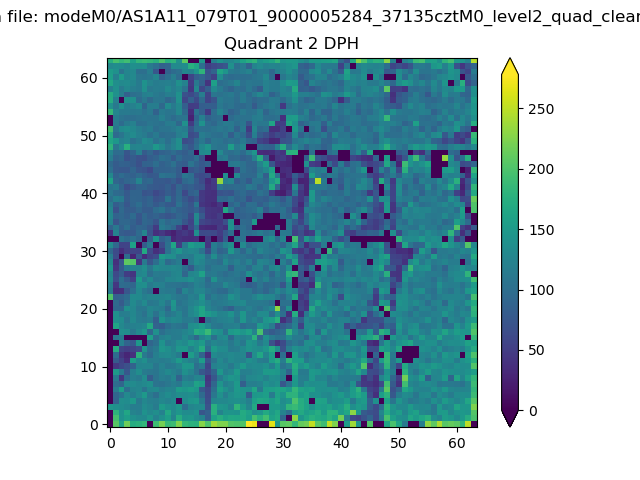
Histogram calculated using DETX and DETY for each event in the final _common_clean file
| Quadrant A | 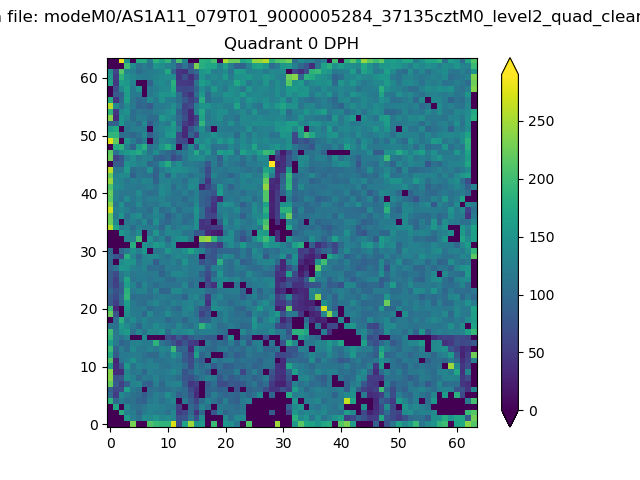 |
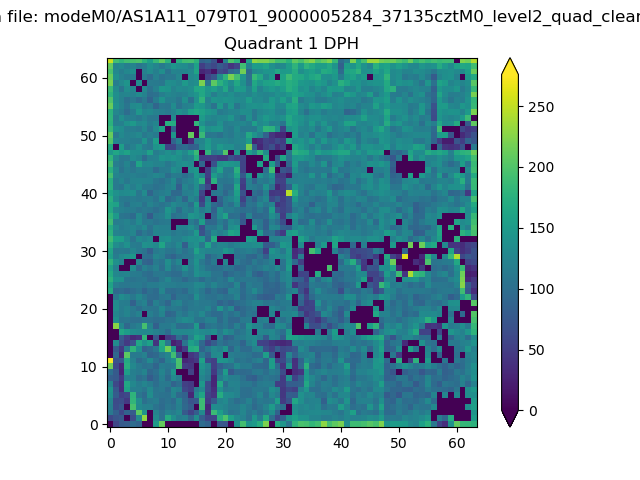 |
Quadrant B |
|---|---|---|---|
| Quadrant D | 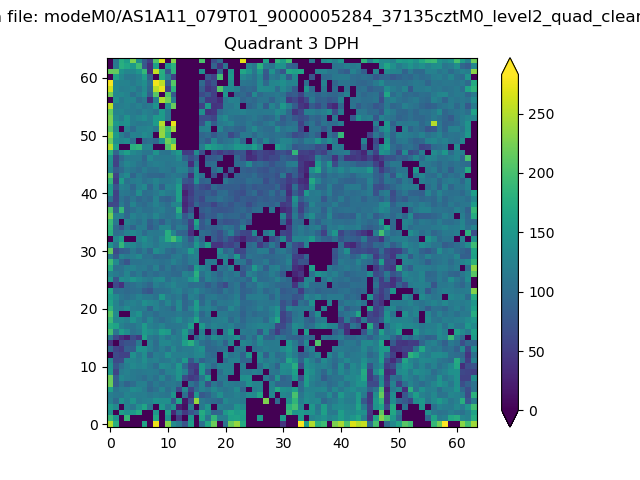 |
 |
Quadrant C |
| Plot type | Count rate plots | Images |
|---|---|---|
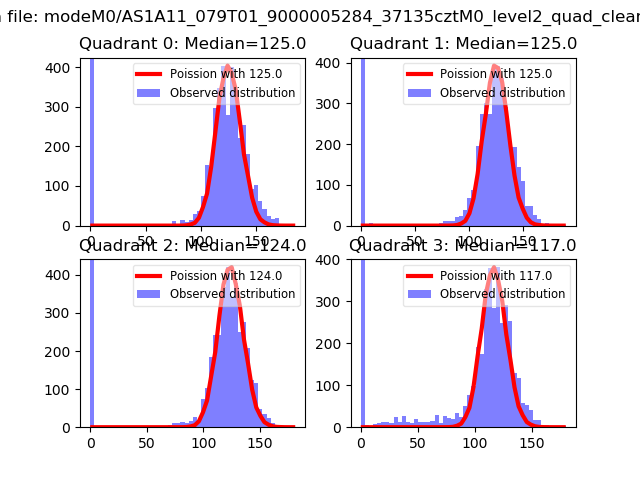
| Comparison with Poisson distribution Blue bars denote a histogram of data divided into 1 sec bins. Red curve is a Poisson curve with rate = median count rate of data. |
 |
 |
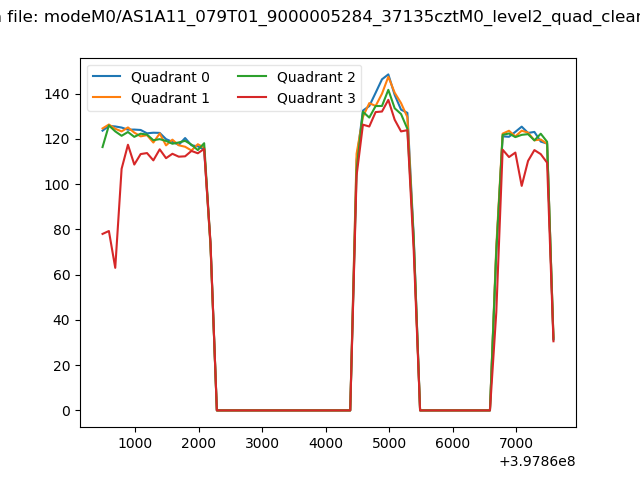
| Quadrant-wise count rates Data is divided into 100 sec bins |
 |
|
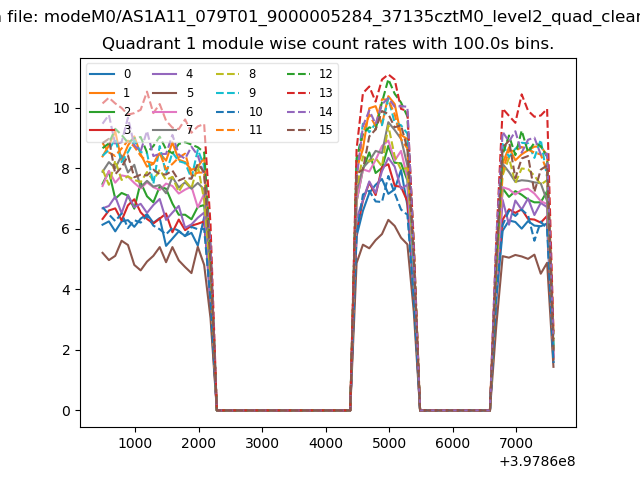
| Module-wise count rates for Quadrant A Data is divided into 100 sec bins |
 |
 |
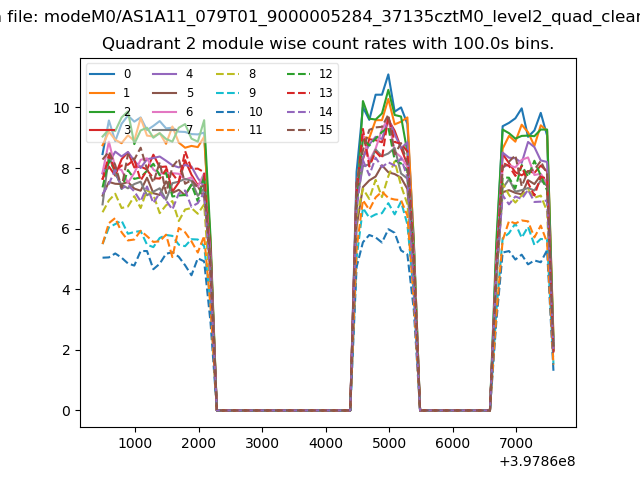
| Module-wise count rates for Quadrant B Data is divided into 100 sec bins |
 |
 |
| Module-wise count rates for Quadrant C Data is divided into 100 sec bins |
 |
 |
| Module-wise count rates for Quadrant D Data is divided into 100 sec bins |
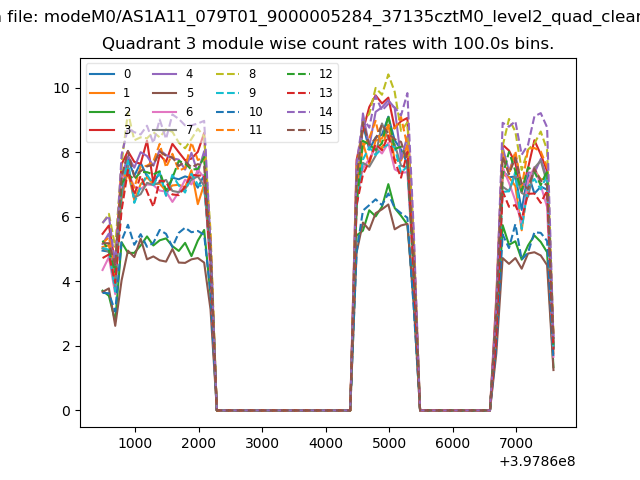 |
 |
| Parameter | Plot |
|---|---|
| CZT HV Monitor | 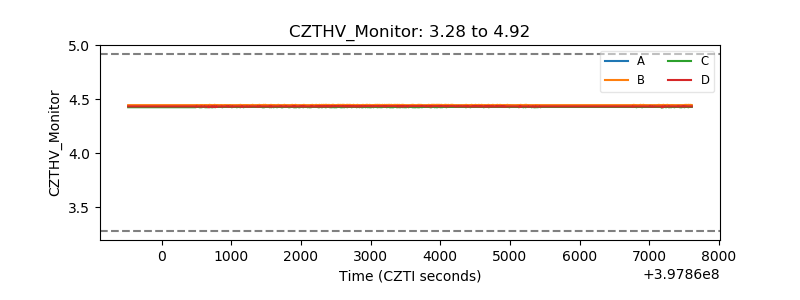 |
| D_VDD | 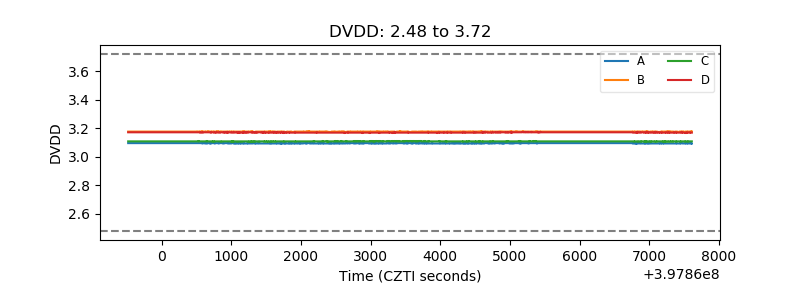 |
| Temperature 1 | 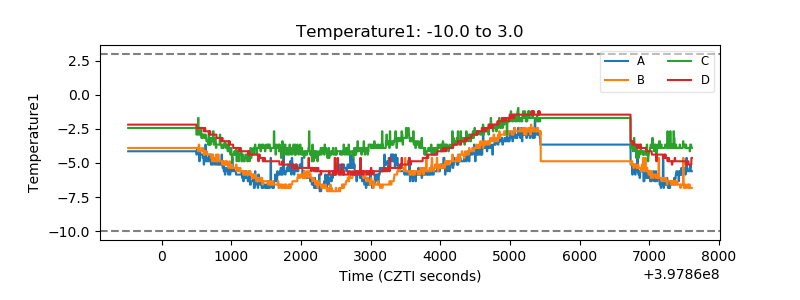 |
| Veto HV Monitor | 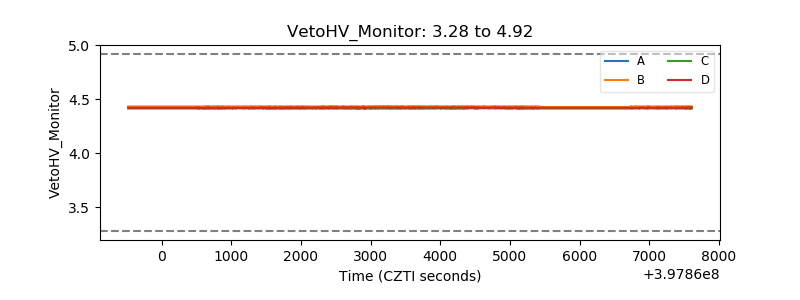 |
| Veto LLD | 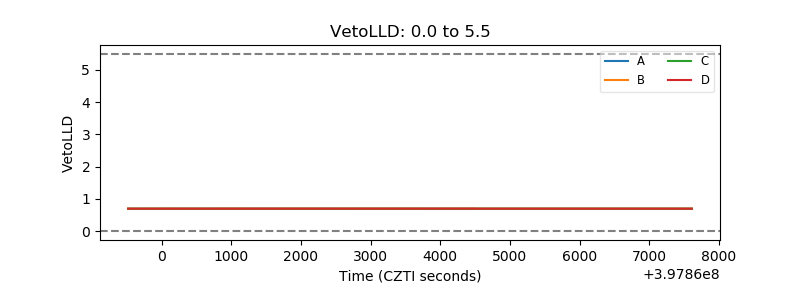 |
| Alpha Counter | 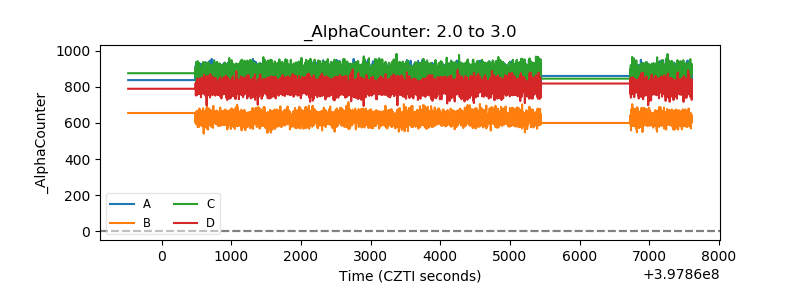 |
| _CPM_Rate | 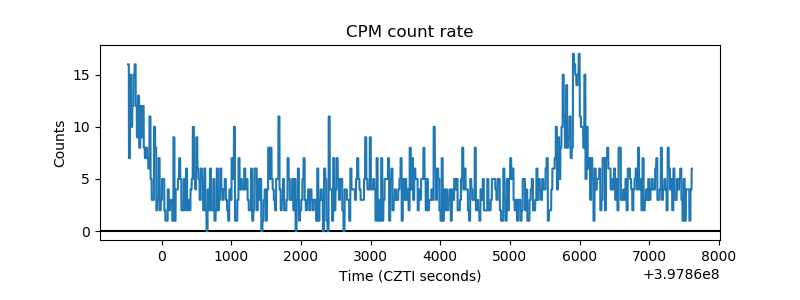 |
| CZT Counter | 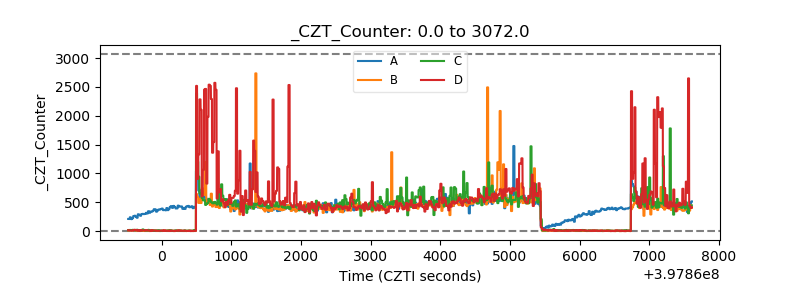 |
| +2.5 Volts monitor | 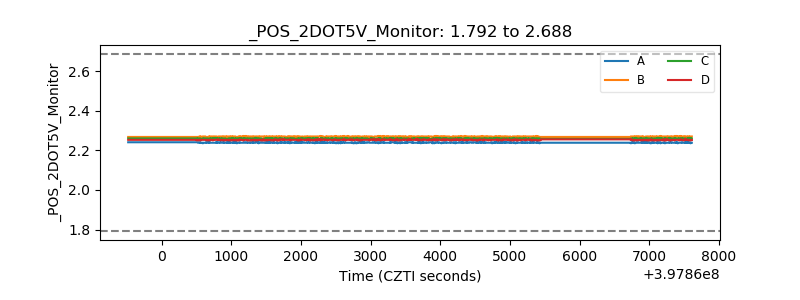 |
| +5 Volts monitor | 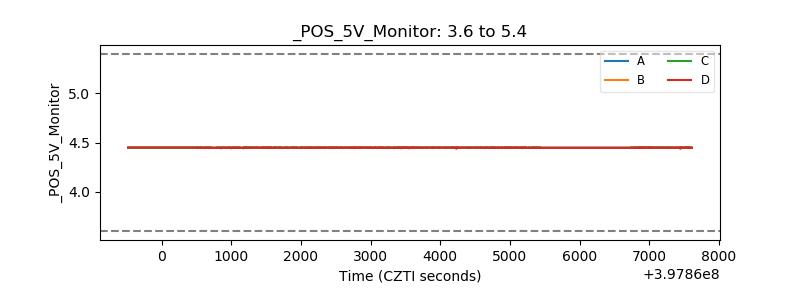 |
| _ROLL_ROT | 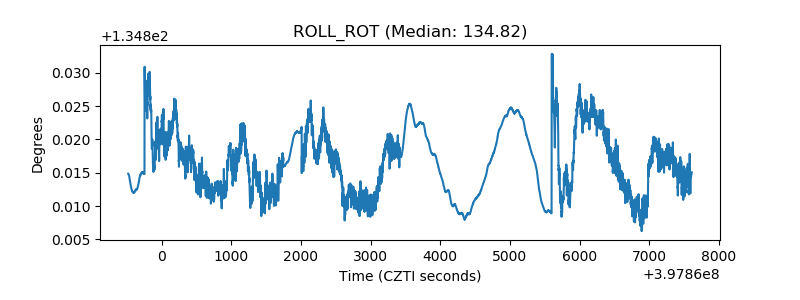 |
| _Roll_DEC | 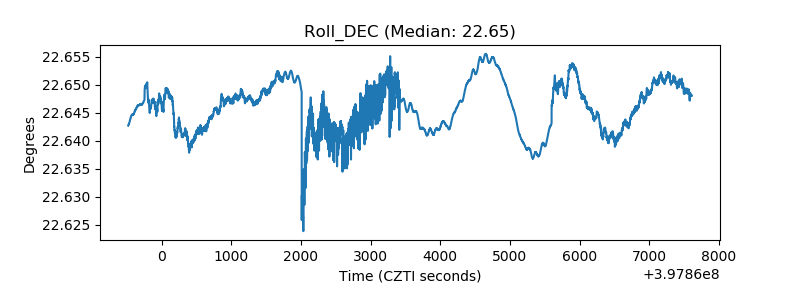 |
| _Roll_RA | 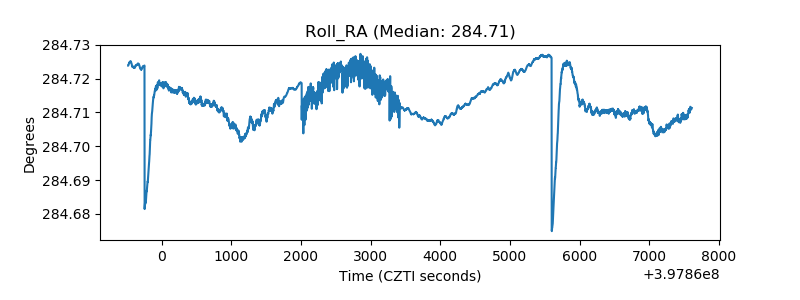 |
| Veto Counter | 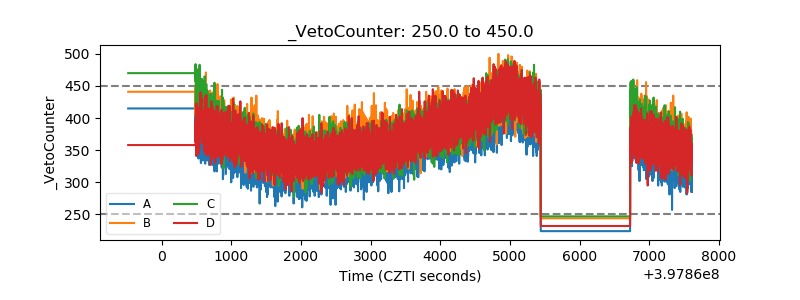 |