| Param | Original file | Final file |
|---|---|---|
| Filename | modeM0/AS1A11_079T01_9000005284_37138cztM0_level2.evt | modeM0/AS1A11_079T01_9000005284_37138cztM0_level2_quad_clean.evt |
| Size (bytes) | 1,188,443,520 | 172,837,440 |
| Size | 1.1 GB | 164.8 MB |
| Events in quadrant A | 7,842,672 | 1,060,328 |
| Events in quadrant B | 9,703,042 | 1,032,191 |
| Events in quadrant C | 8,535,092 | 1,053,870 |
| Events in quadrant D | 8,837,285 | 991,187 |
| Mode M9 | |||
|---|---|---|---|
| Quadrant | BADHDUFLAG | Total packets | Discarded packets |
| A | 0 | 55 | 0 |
| B | 0 | 55 | 0 |
| C | 0 | 55 | 0 |
| D | 0 | 55 | 0 |
| Mode SS | |||
|---|---|---|---|
| Quadrant | BADHDUFLAG | Total packets | Discarded packets |
| A | 0 | 326 | 0 |
| B | 0 | 326 | 0 |
| C | 0 | 326 | 0 |
| D | 0 | 326 | 0 |
| Mode M0 | |||
|---|---|---|---|
| Quadrant | BADHDUFLAG | Total packets | Discarded packets |
| A | 0 | 33195 | 5 |
| B | 0 | 39524 | 4 |
| C | 0 | 34998 | 4 |
| D | 0 | 37516 | 4 |
| Quadrant | Total seconds | Saturated seconds | Saturation percentage |
|---|---|---|---|
| A | 15894 | 29 | 0.182459% |
| B | 15894 | 792 | 4.983012% |
| C | 15894 | 154 | 0.968919% |
| D | 15894 | 379 | 2.384548% |
Noise dominated data is calculated using 1-second bins in cleaned event files. If a bin has >2000 counts, and if more than 50% of those come from <1% of pixels, then it is considered to be noise-dominated and hence unusable.
| Quadrant | # 1 sec bins | Bins with >0 counts | Bins with >2000 counts | High rate bins dominated by noise | Noise dominated (total time) | Noise dominated (detector-on time) | Marked lightcurve |
|---|---|---|---|---|---|---|---|
| A | 21358 | 15898 | 12 | 12 | 0.06% | 0.08% | 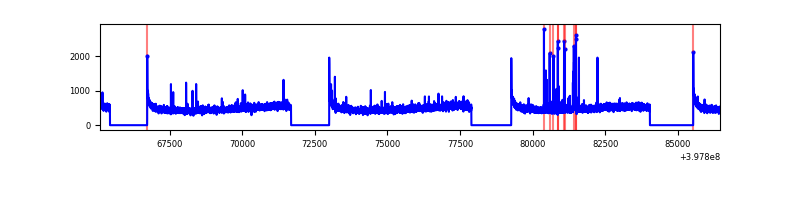 |
| B | 21358 | 15898 | 588 | 588 | 2.75% | 3.70% | 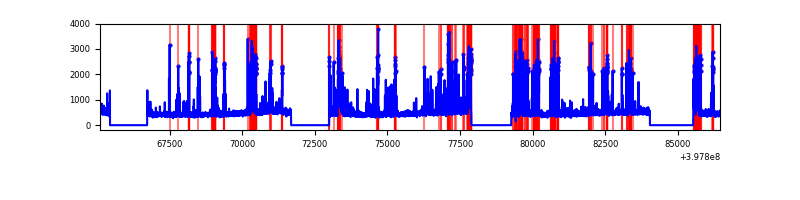 |
| C | 21358 | 15898 | 137 | 137 | 0.64% | 0.86% | 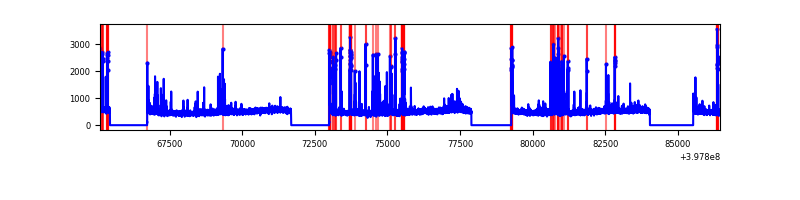 |
| D | 21358 | 15898 | 310 | 310 | 1.45% | 1.95% | 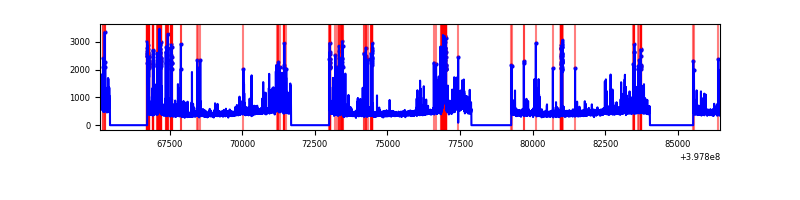 |
Top three noisy pixels from each quadrant. If the there are fewer than three noisy pixels in the level2.evt file, extra rows are filled as -1
| Pixel properties | Quadrant properties | ||||||
|---|---|---|---|---|---|---|---|
| Quadrant | DetID | PixID | Counts | Sigma | Mean | Median | Sigma |
| A | 10 | 83 | 626665 | 1703.51 | 1816 | 1782 | 366.8 |
| A | 15 | 174 | 81874 | 218.34 | 1816 | 1782 | 366.8 |
| A | 7 | 16 | 59039 | 156.09 | 1816 | 1782 | 366.8 |
| B | 5 | 172 | 2050662 | 6018.5 | 1763 | 1713 | 340.4 |
| B | 5 | 184 | 315569 | 921.91 | 1763 | 1713 | 340.4 |
| B | 0 | 182 | 193922 | 564.59 | 1763 | 1713 | 340.4 |
| C | 15 | 214 | 724231 | 1766.61 | 1762 | 1781 | 408.9 |
| C | 14 | 254 | 397914 | 968.66 | 1762 | 1781 | 408.9 |
| C | 0 | 10 | 269152 | 653.8 | 1762 | 1781 | 408.9 |
| D | 2 | 249 | 1095710 | 2560.12 | 1753 | 1706 | 427.3 |
| D | 13 | 249 | 237526 | 551.85 | 1753 | 1706 | 427.3 |
| D | 12 | 235 | 187507 | 434.8 | 1753 | 1706 | 427.3 |
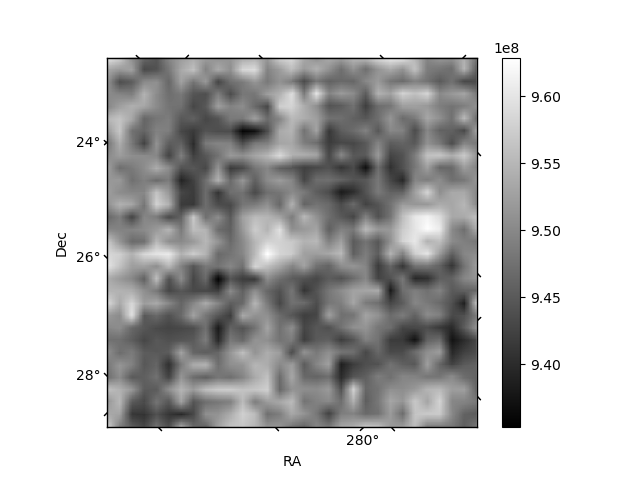
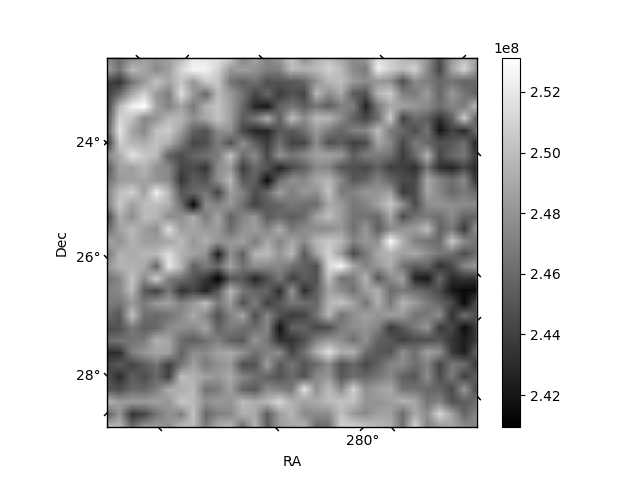
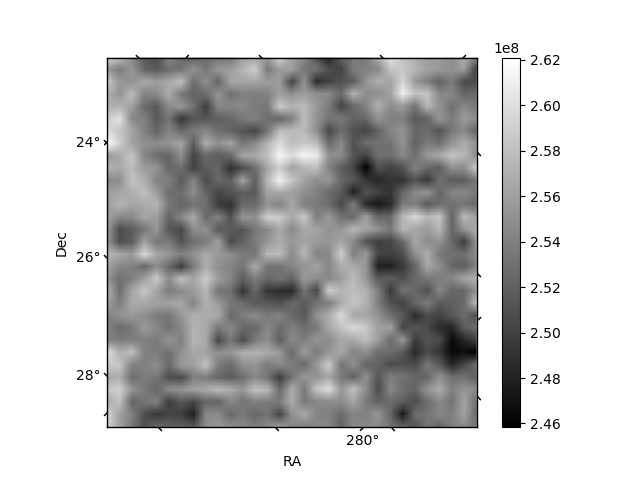
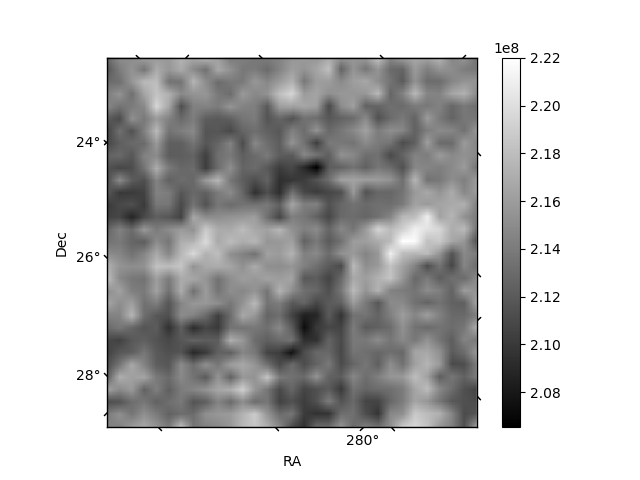
Histogram calculated using DETX and DETY for each event in the final _common_clean file
| Quadrant A | 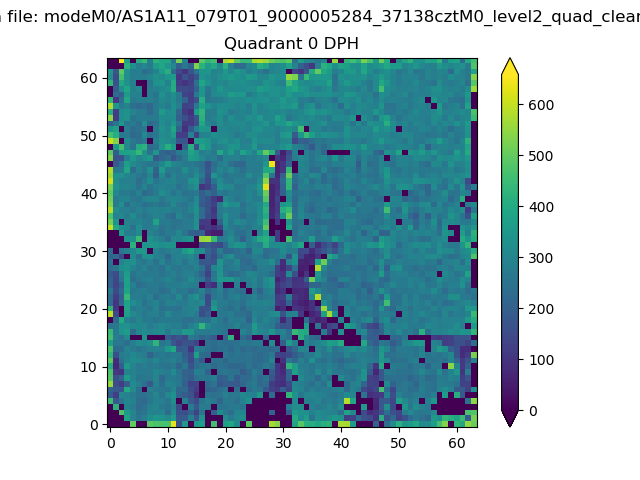 |
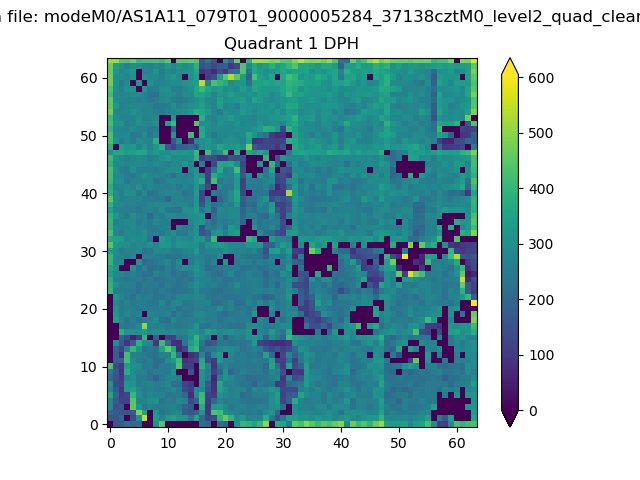 |
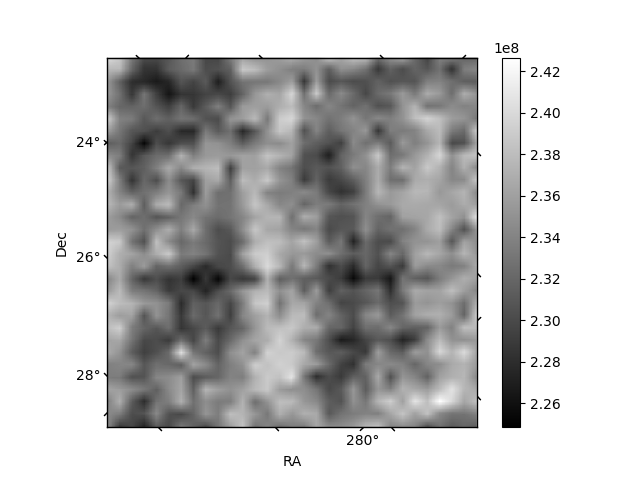
Quadrant B |
|---|---|---|---|
| Quadrant D | 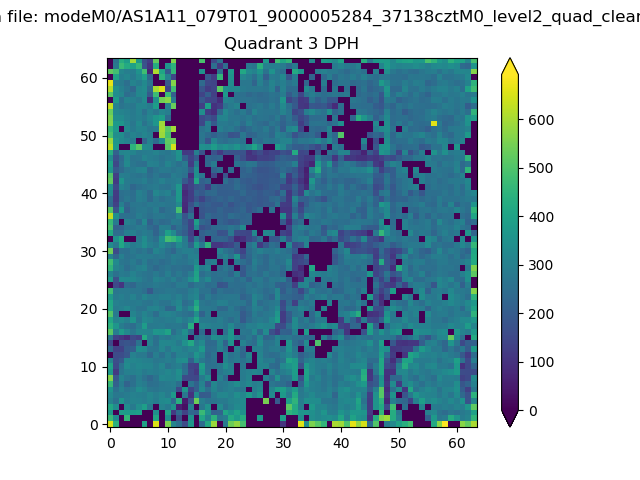 |
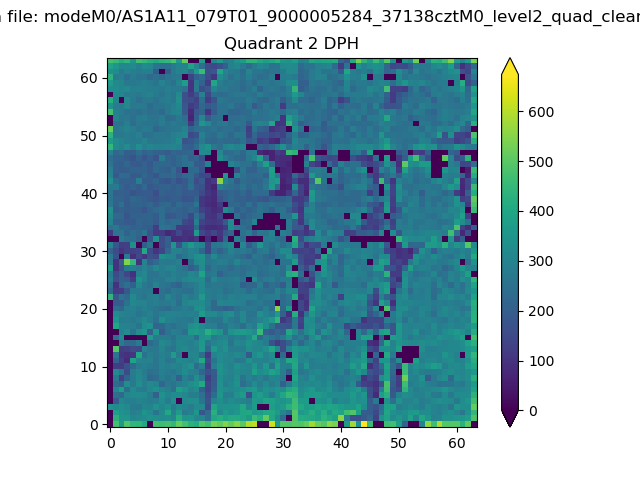 |
Quadrant C |
| Plot type | Count rate plots | Images |
|---|---|---|
| Comparison with Poisson distribution Blue bars denote a histogram of data divided into 1 sec bins. Red curve is a Poisson curve with rate = median count rate of data. |
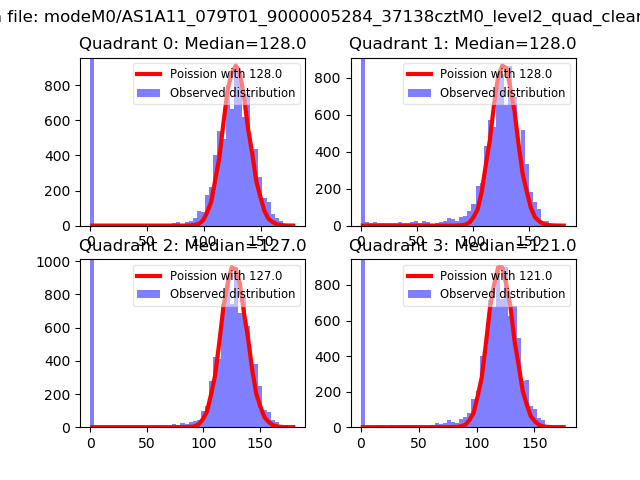 |
 |
| Quadrant-wise count rates Data is divided into 100 sec bins |
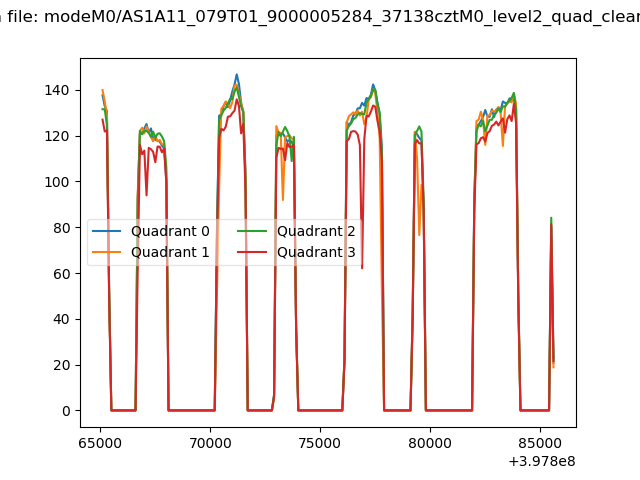 |
|
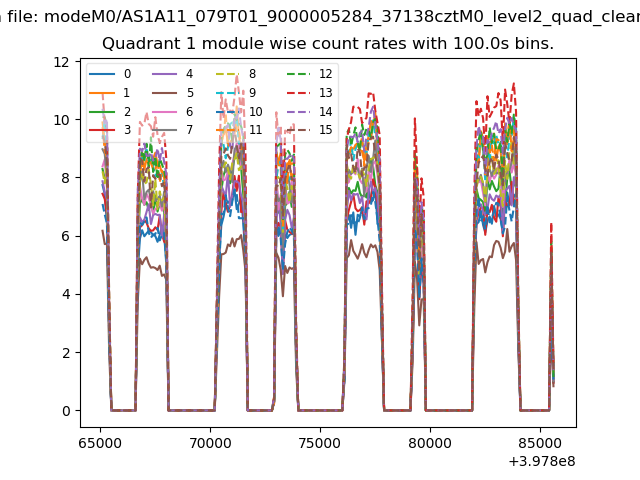
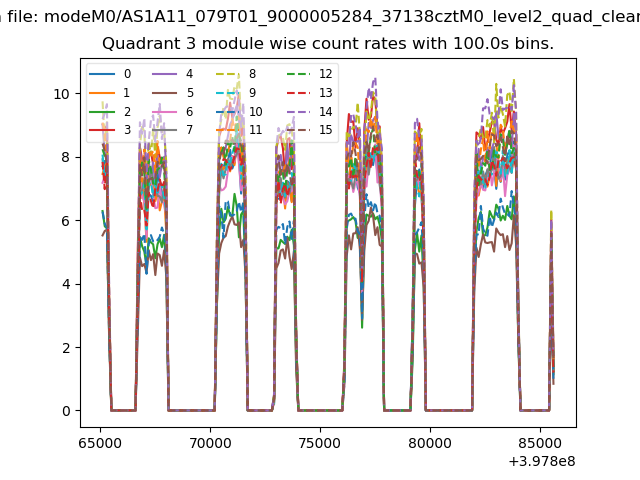
| Module-wise count rates for Quadrant A Data is divided into 100 sec bins |
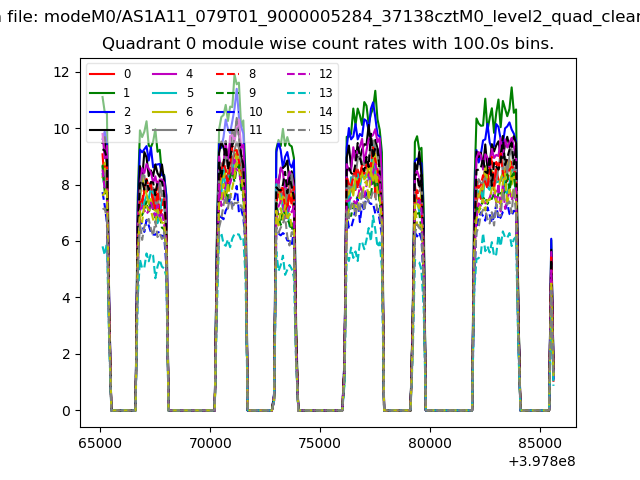 |
 |
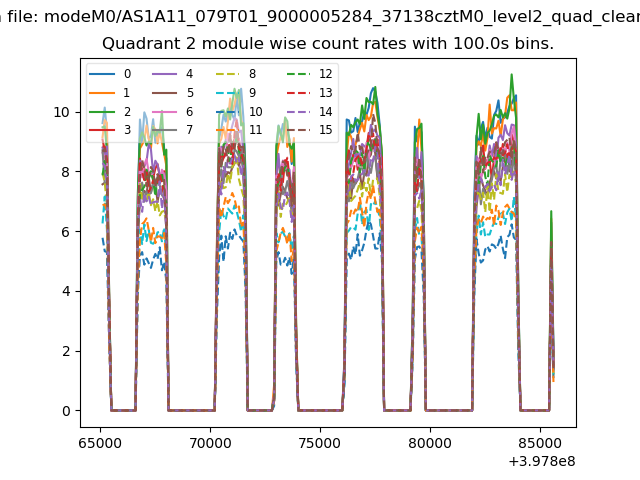
| Module-wise count rates for Quadrant B Data is divided into 100 sec bins |
 |
 |
| Module-wise count rates for Quadrant C Data is divided into 100 sec bins |
 |
 |
| Module-wise count rates for Quadrant D Data is divided into 100 sec bins |
 |
 |
| Parameter | Plot |
|---|---|
| CZT HV Monitor | 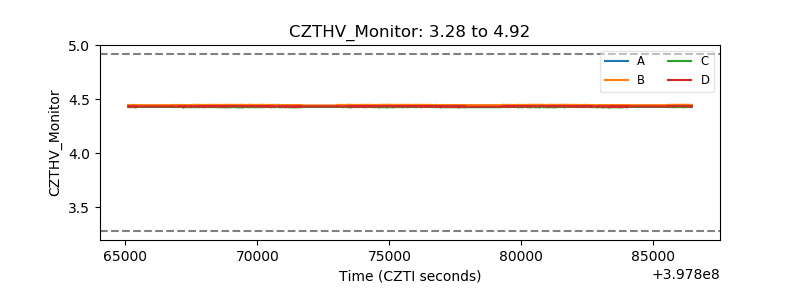 |
| D_VDD | 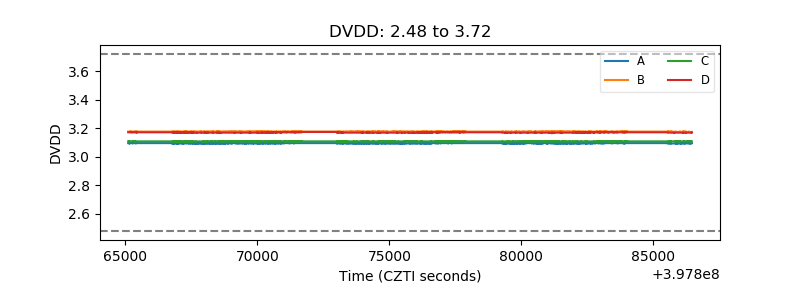 |
| Temperature 1 |  |
| Veto HV Monitor | 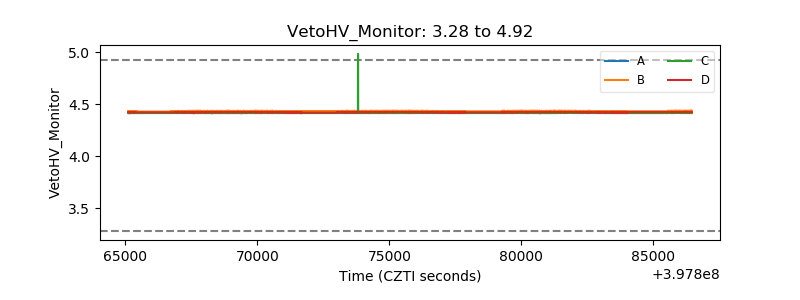 |
| Veto LLD | 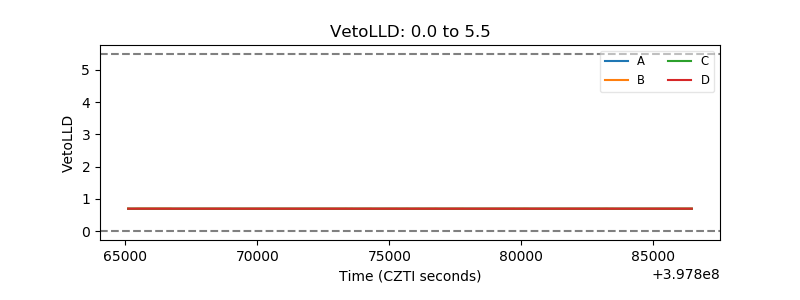 |
| Alpha Counter | 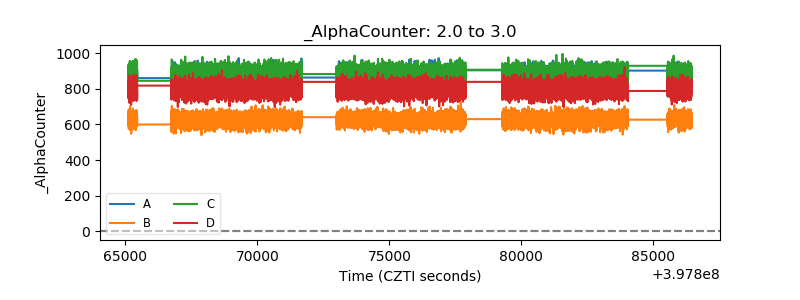 |
| _CPM_Rate | 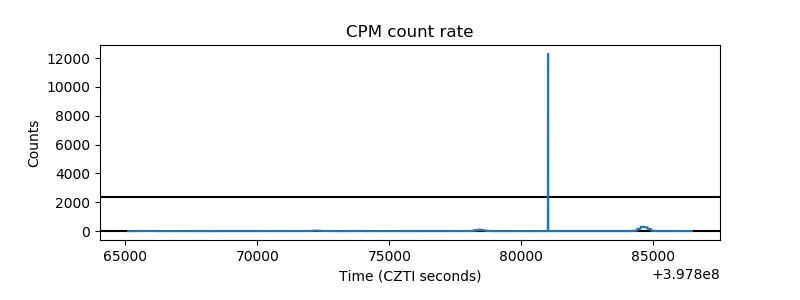 |
| CZT Counter | 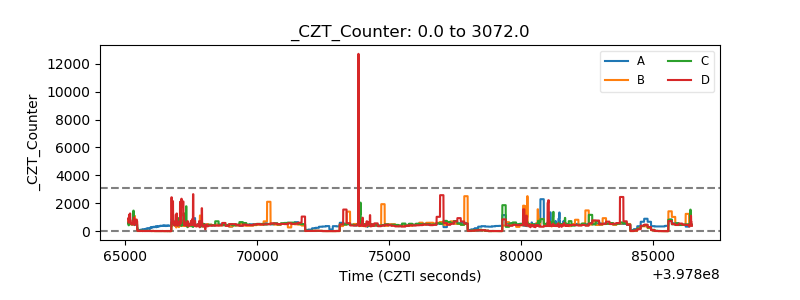 |
| +2.5 Volts monitor | 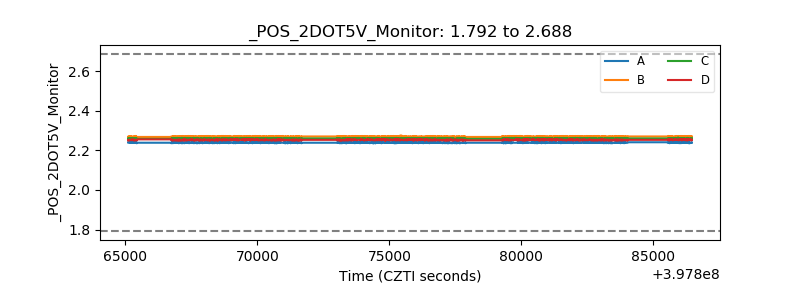 |
| +5 Volts monitor | 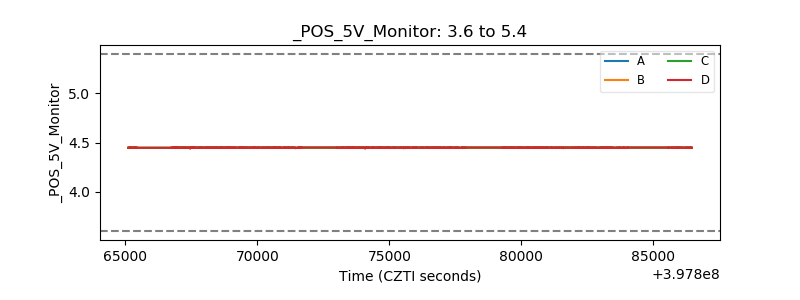 |
| _ROLL_ROT | 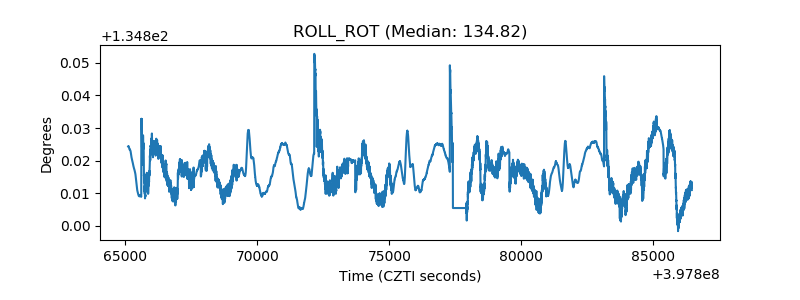 |
| _Roll_DEC | 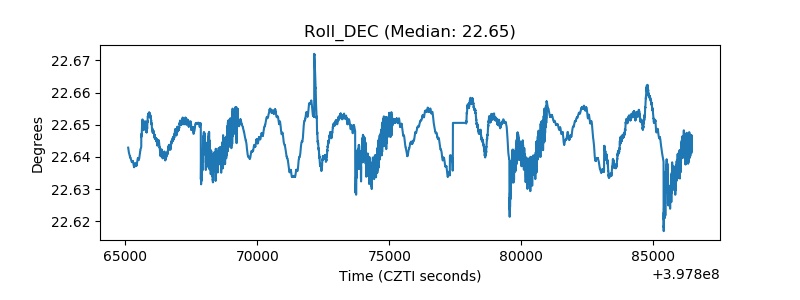 |
| _Roll_RA | 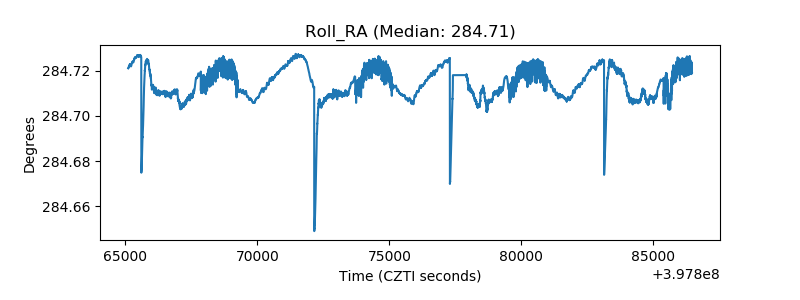 |
| Veto Counter | 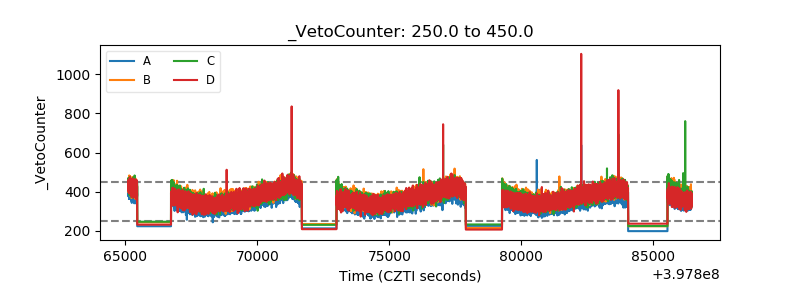 |