| Param | Original file | Final file |
|---|---|---|
| Filename | modeM0/AS1A11_079T01_9000005284_37139cztM0_level2.evt | modeM0/AS1A11_079T01_9000005284_37139cztM0_level2_quad_clean.evt |
| Size (bytes) | 403,390,080 | 52,945,920 |
| Size | 384.7 MB | 50.5 MB |
| Events in quadrant A | 2,787,226 | 308,396 |
| Events in quadrant B | 3,130,370 | 310,848 |
| Events in quadrant C | 3,091,404 | 306,232 |
| Events in quadrant D | 2,834,676 | 293,425 |
| Mode M9 | |||
|---|---|---|---|
| Quadrant | BADHDUFLAG | Total packets | Discarded packets |
| A | 0 | 30 | 0 |
| B | 0 | 30 | 0 |
| C | 0 | 30 | 0 |
| D | 0 | 30 | 0 |
| Mode SS | |||
|---|---|---|---|
| Quadrant | BADHDUFLAG | Total packets | Discarded packets |
| A | 0 | 112 | 0 |
| B | 0 | 112 | 0 |
| C | 0 | 112 | 0 |
| D | 0 | 112 | 0 |
| Mode M0 | |||
|---|---|---|---|
| Quadrant | BADHDUFLAG | Total packets | Discarded packets |
| A | 0 | 11572 | 3 |
| B | 0 | 12915 | 2 |
| C | 0 | 12403 | 2 |
| D | 0 | 12100 | 2 |
| Quadrant | Total seconds | Saturated seconds | Saturation percentage |
|---|---|---|---|
| A | 5485 | 22 | 0.401094% |
| B | 5485 | 167 | 3.044667% |
| C | 5485 | 66 | 1.203282% |
| D | 5485 | 48 | 0.875114% |
Noise dominated data is calculated using 1-second bins in cleaned event files. If a bin has >2000 counts, and if more than 50% of those come from <1% of pixels, then it is considered to be noise-dominated and hence unusable.
| Quadrant | # 1 sec bins | Bins with >0 counts | Bins with >2000 counts | High rate bins dominated by noise | Noise dominated (total time) | Noise dominated (detector-on time) | Marked lightcurve |
|---|---|---|---|---|---|---|---|
| A | 7097 | 5486 | 15 | 15 | 0.21% | 0.27% | 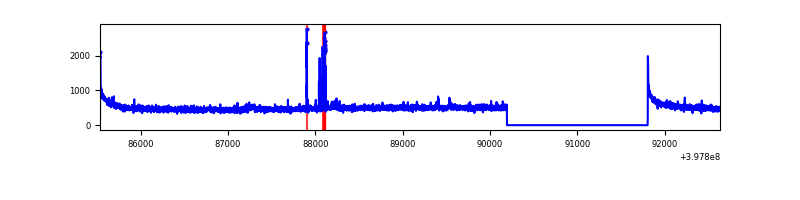 |
| B | 7097 | 5486 | 117 | 117 | 1.65% | 2.13% | 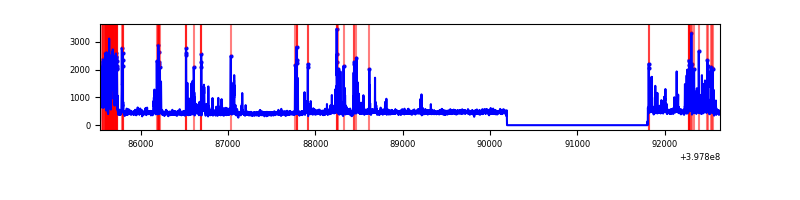 |
| C | 7097 | 5486 | 57 | 57 | 0.80% | 1.04% | 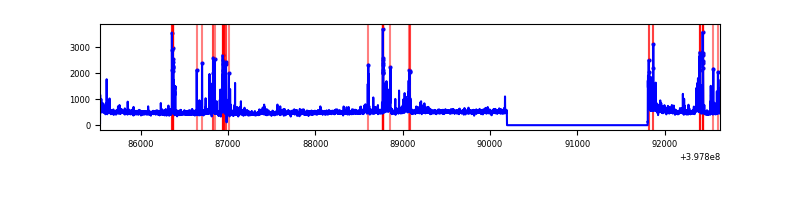 |
| D | 7097 | 5486 | 49 | 49 | 0.69% | 0.89% | 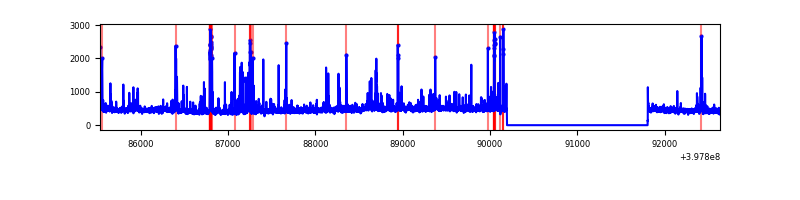 |
Top three noisy pixels from each quadrant. If the there are fewer than three noisy pixels in the level2.evt file, extra rows are filled as -1
| Pixel properties | Quadrant properties | ||||||
|---|---|---|---|---|---|---|---|
| Quadrant | DetID | PixID | Counts | Sigma | Mean | Median | Sigma |
| A | 10 | 83 | 258441 | 2008.83 | 630 | 617 | 128.3 |
| A | 15 | 174 | 73157 | 565.19 | 630 | 617 | 128.3 |
| A | 13 | 6 | 10829 | 79.57 | 630 | 617 | 128.3 |
| B | 5 | 172 | 595467 | 4919.43 | 619 | 600 | 120.9 |
| B | 4 | 232 | 77974 | 639.87 | 619 | 600 | 120.9 |
| B | 12 | 111 | 15095 | 119.87 | 619 | 600 | 120.9 |
| C | 14 | 254 | 314603 | 2173.4 | 610 | 614 | 144.5 |
| C | 15 | 214 | 255421 | 1763.75 | 610 | 614 | 144.5 |
| C | 0 | 10 | 118799 | 818.07 | 610 | 614 | 144.5 |
| D | 2 | 250 | 149664 | 994.93 | 611 | 594 | 149.8 |
| D | 2 | 249 | 71507 | 473.29 | 611 | 594 | 149.8 |
| D | 7 | 55 | 58669 | 387.61 | 611 | 594 | 149.8 |
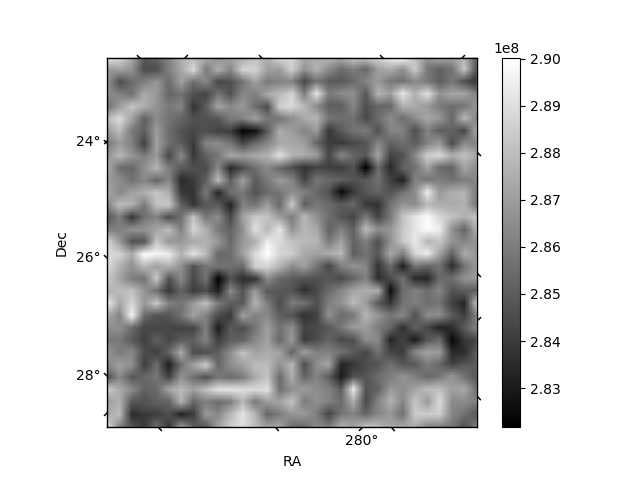
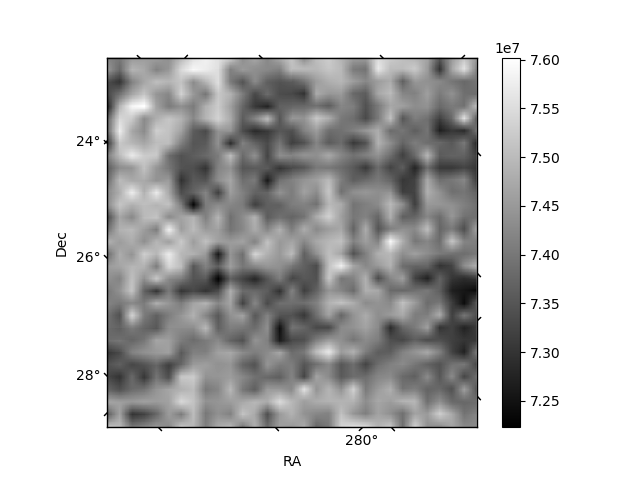
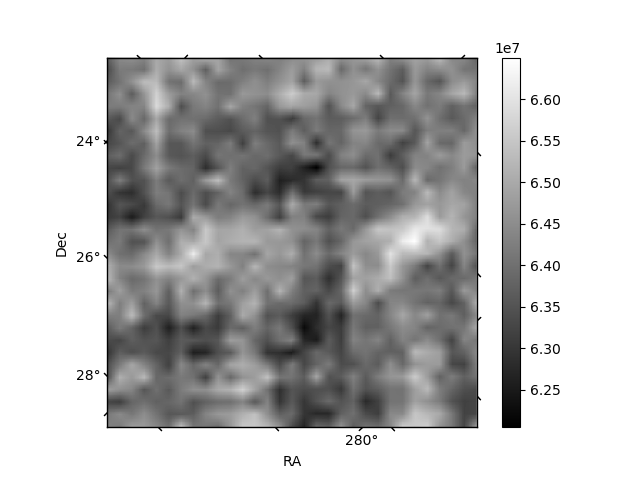
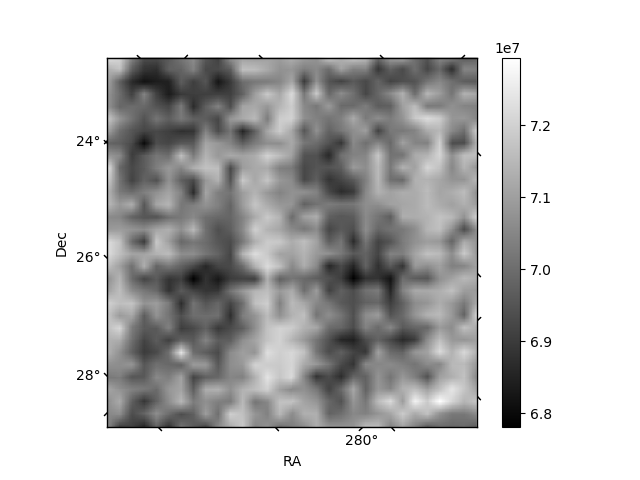
Histogram calculated using DETX and DETY for each event in the final _common_clean file
| Quadrant A | 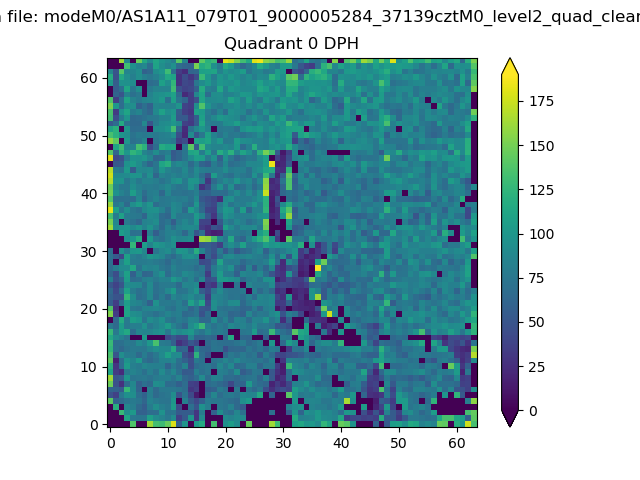 |
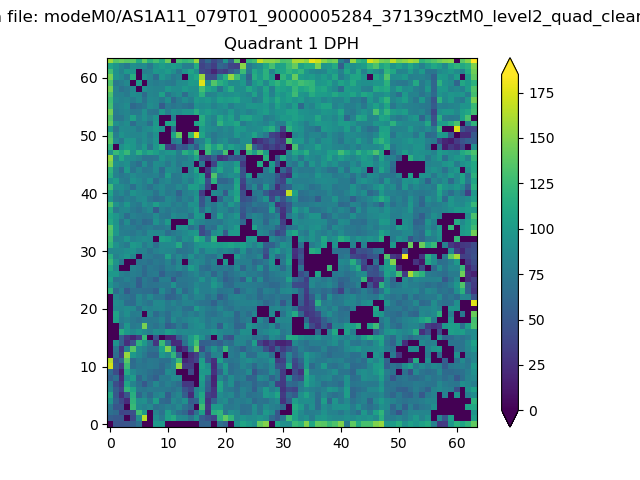 |
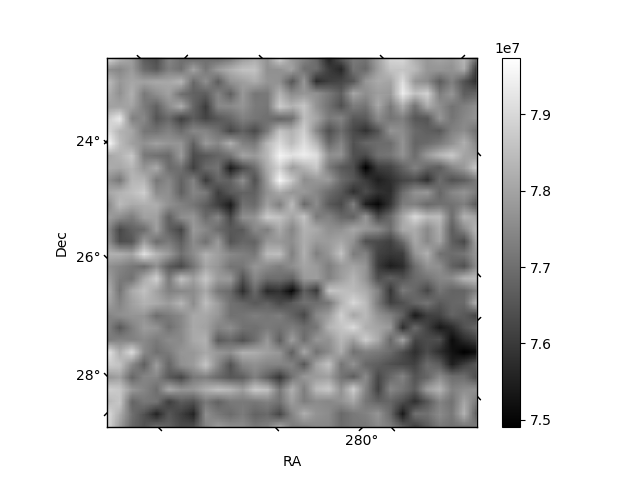
Quadrant B |
|---|---|---|---|
| Quadrant D | 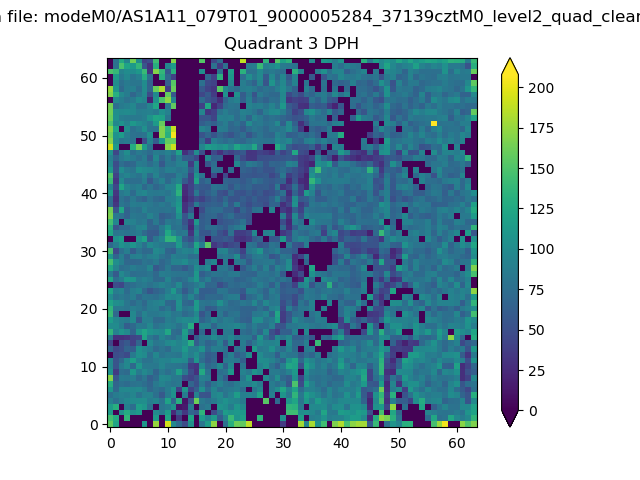 |
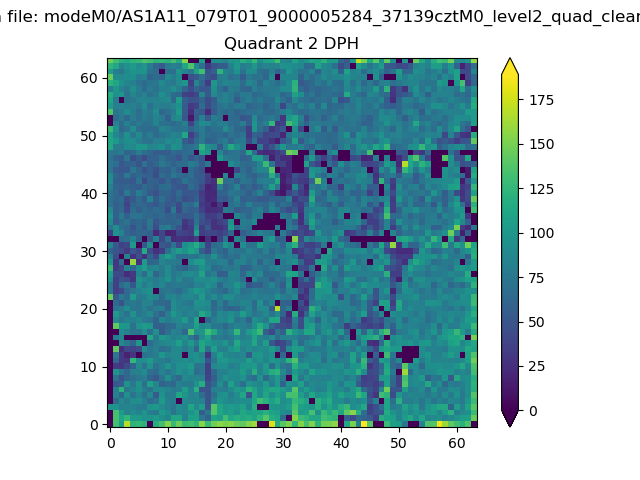 |
Quadrant C |
| Plot type | Count rate plots | Images |
|---|---|---|
| Comparison with Poisson distribution Blue bars denote a histogram of data divided into 1 sec bins. Red curve is a Poisson curve with rate = median count rate of data. |
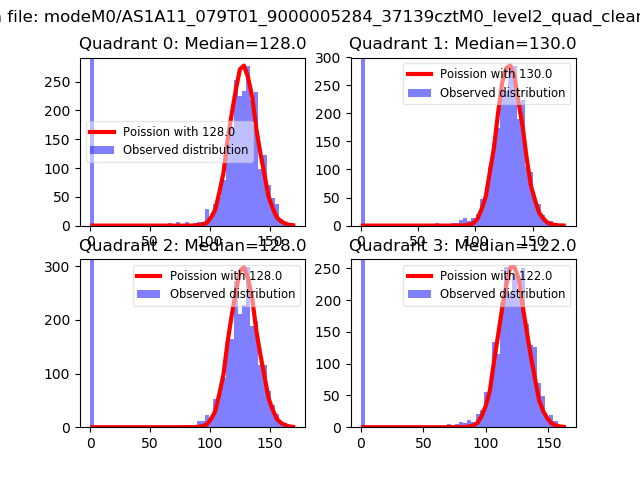 |
 |
| Quadrant-wise count rates Data is divided into 100 sec bins |
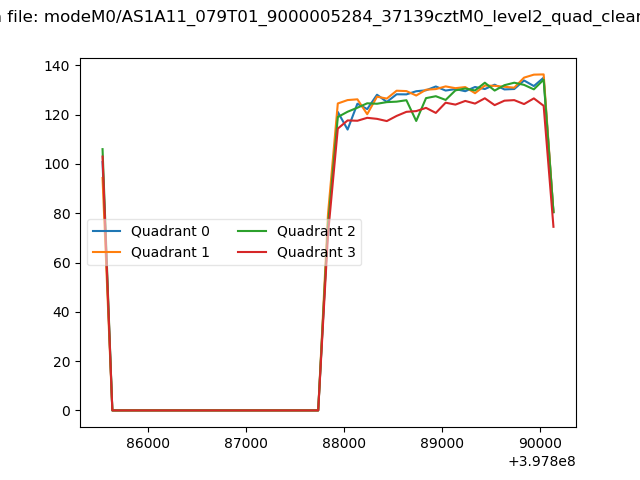 |
|
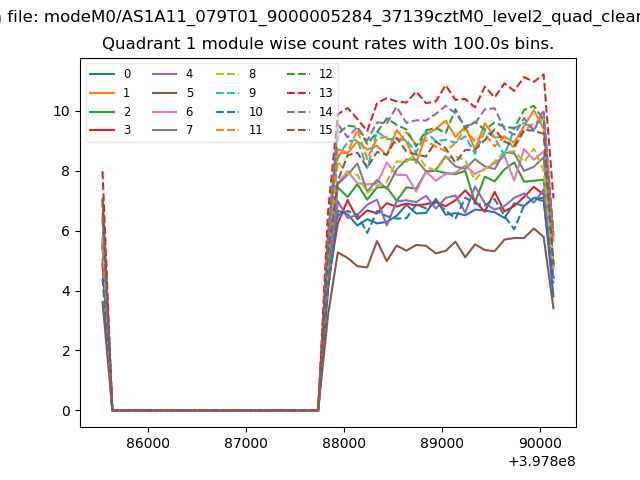
| Module-wise count rates for Quadrant A Data is divided into 100 sec bins |
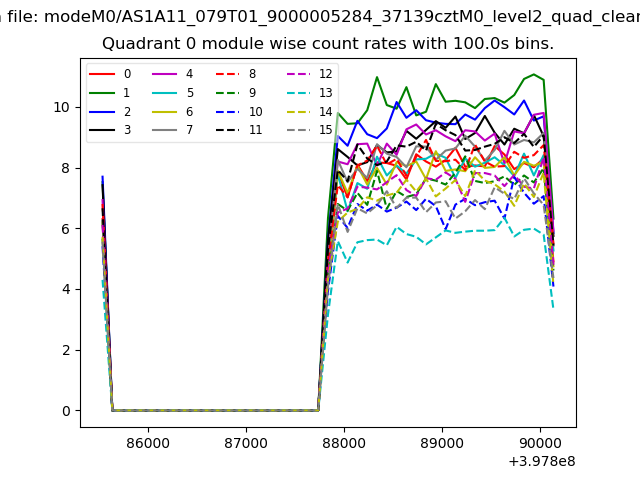 |
 |
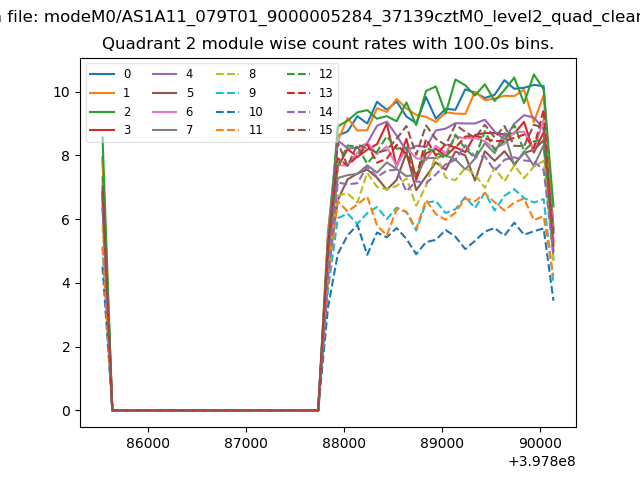
| Module-wise count rates for Quadrant B Data is divided into 100 sec bins |
 |
 |
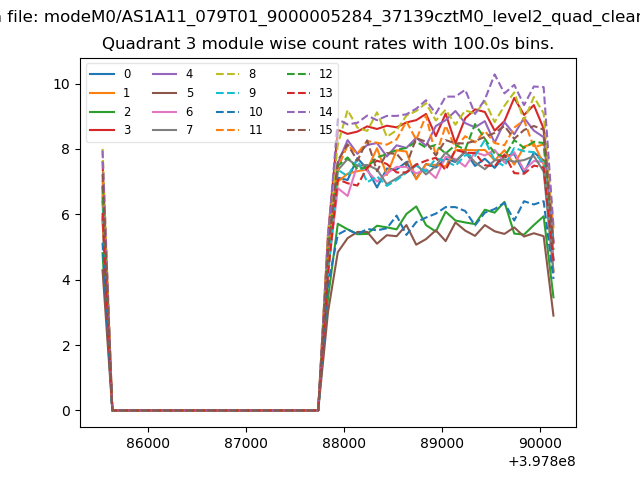
| Module-wise count rates for Quadrant C Data is divided into 100 sec bins |
 |
 |
| Module-wise count rates for Quadrant D Data is divided into 100 sec bins |
 |
 |
| Parameter | Plot |
|---|---|
| CZT HV Monitor | 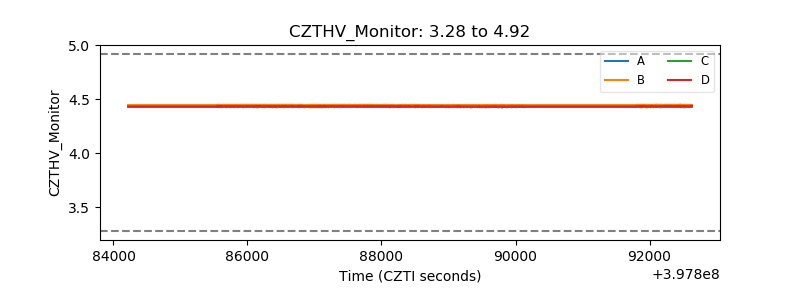 |
| D_VDD | 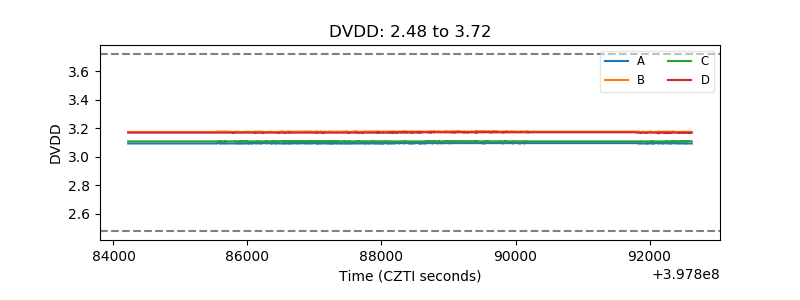 |
| Temperature 1 | 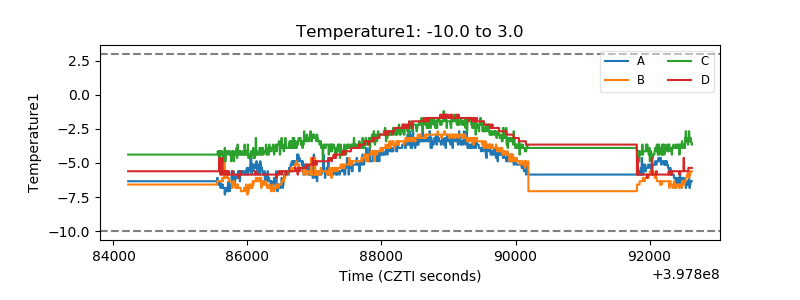 |
| Veto HV Monitor | 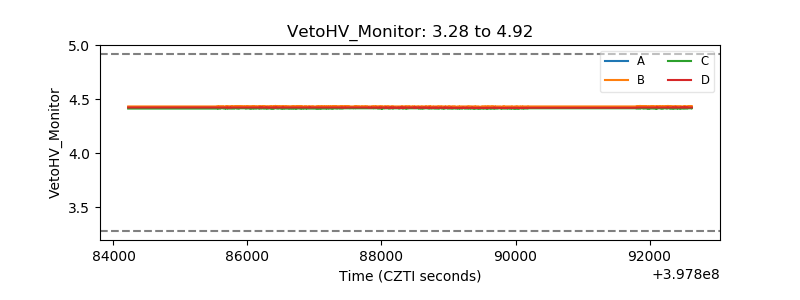 |
| Veto LLD | 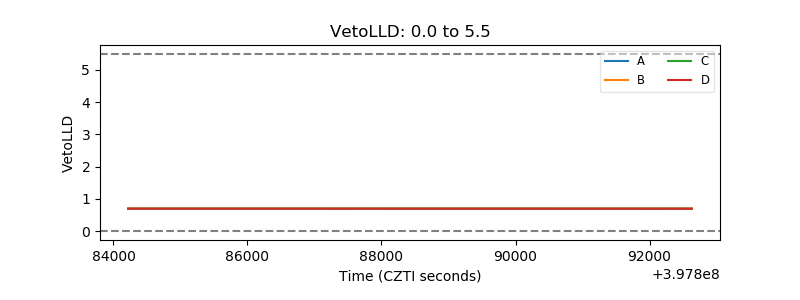 |
| Alpha Counter | 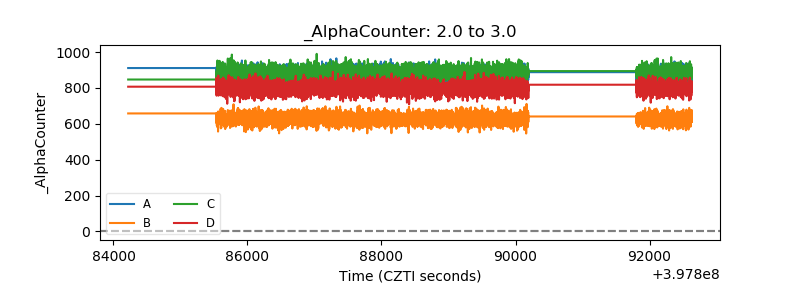 |
| _CPM_Rate | 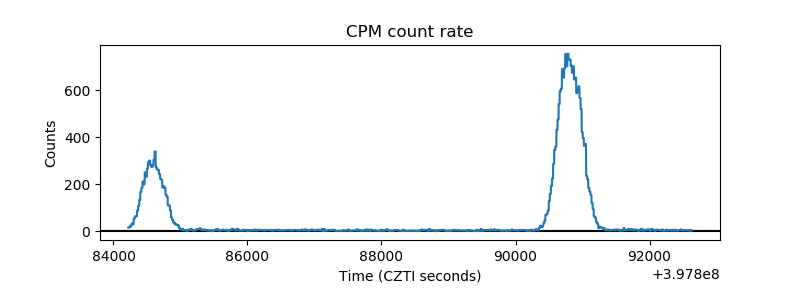 |
| CZT Counter | 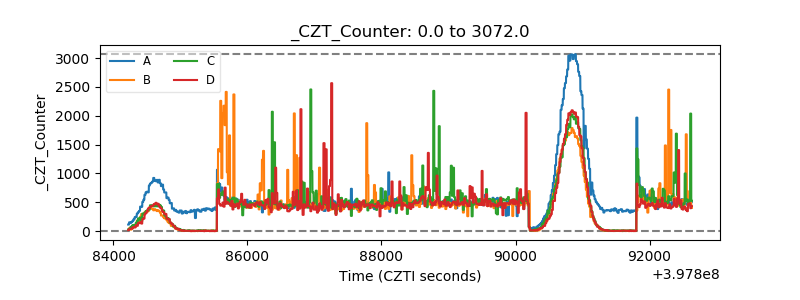 |
| +2.5 Volts monitor | 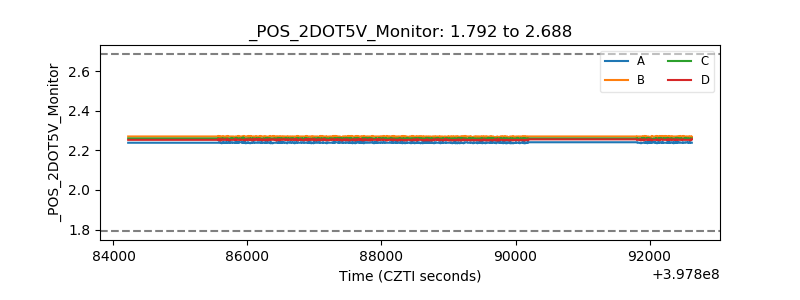 |
| +5 Volts monitor | 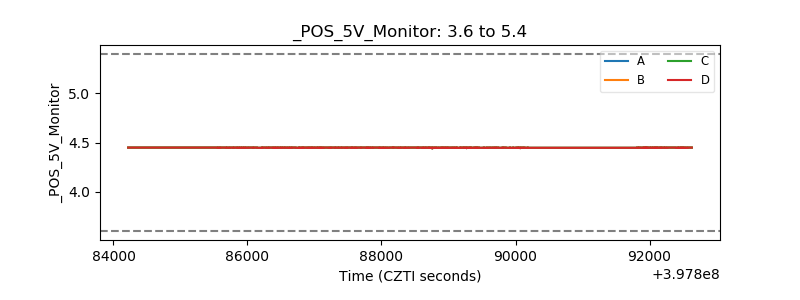 |
| _ROLL_ROT | 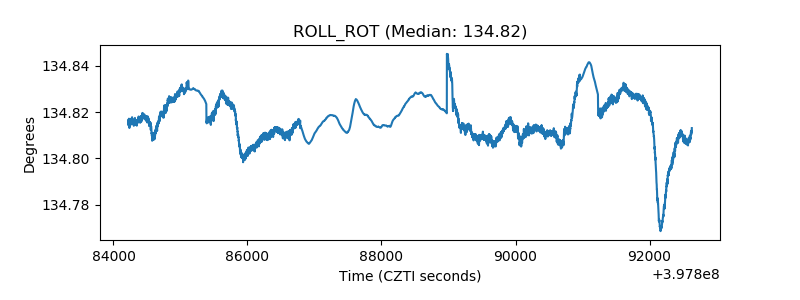 |
| _Roll_DEC | 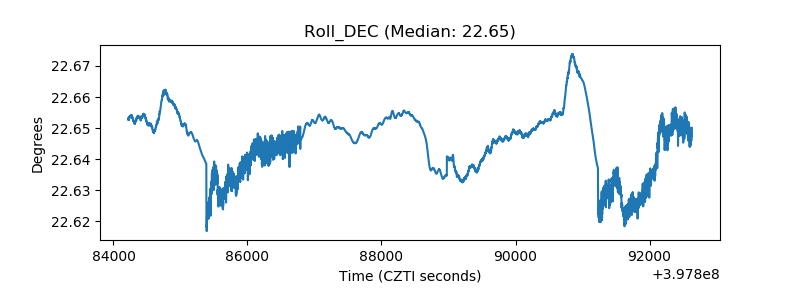 |
| _Roll_RA | 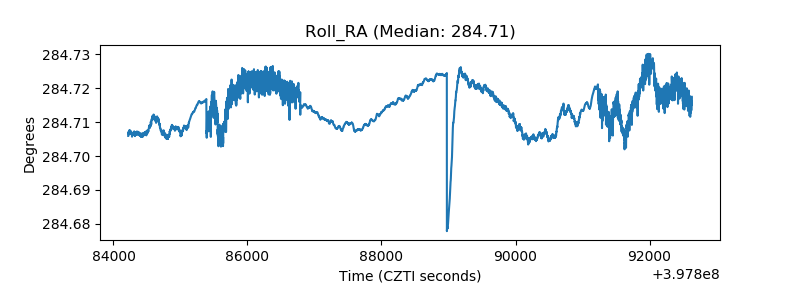 |
| Veto Counter | 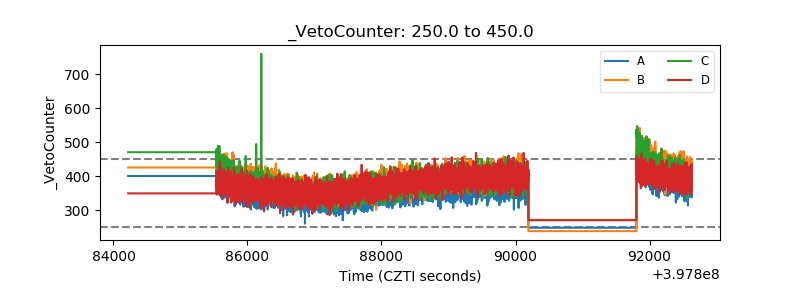 |