| Param | Original file | Final file |
|---|---|---|
| Filename | modeM0/AS1A11_079T01_9000005284_37141cztM0_level2.evt | modeM0/AS1A11_079T01_9000005284_37141cztM0_level2_quad_clean.evt |
| Size (bytes) | 423,192,960 | 64,301,760 |
| Size | 403.6 MB | 61.3 MB |
| Events in quadrant A | 2,864,447 | 395,133 |
| Events in quadrant B | 3,317,369 | 398,674 |
| Events in quadrant C | 3,120,013 | 389,424 |
| Events in quadrant D | 3,131,622 | 369,456 |
| Mode M9 | |||
|---|---|---|---|
| Quadrant | BADHDUFLAG | Total packets | Discarded packets |
| A | 0 | 33 | 0 |
| B | 0 | 33 | 0 |
| C | 0 | 33 | 0 |
| D | 0 | 33 | 0 |
| Mode SS | |||
|---|---|---|---|
| Quadrant | BADHDUFLAG | Total packets | Discarded packets |
| A | 0 | 121 | 3 |
| B | 0 | 120 | 2 |
| C | 0 | 120 | 0 |
| D | 0 | 120 | 2 |
| Mode M0 | |||
|---|---|---|---|
| Quadrant | BADHDUFLAG | Total packets | Discarded packets |
| A | 0 | 12048 | 196 |
| B | 0 | 13664 | 216 |
| C | 0 | 12732 | 269 |
| D | 0 | 13381 | 309 |
| Quadrant | Total seconds | Saturated seconds | Saturation percentage |
|---|---|---|---|
| A | 5629 | 7 | 0.124356% |
| B | 5632 | 162 | 2.876420% |
| C | 5629 | 38 | 0.675076% |
| D | 5625 | 90 | 1.600000% |
Noise dominated data is calculated using 1-second bins in cleaned event files. If a bin has >2000 counts, and if more than 50% of those come from <1% of pixels, then it is considered to be noise-dominated and hence unusable.
| Quadrant | # 1 sec bins | Bins with >0 counts | Bins with >2000 counts | High rate bins dominated by noise | Noise dominated (total time) | Noise dominated (detector-on time) | Marked lightcurve |
|---|---|---|---|---|---|---|---|
| A | 9302 | 5641 | 0 | 0 | 0.00% | 0.00% | 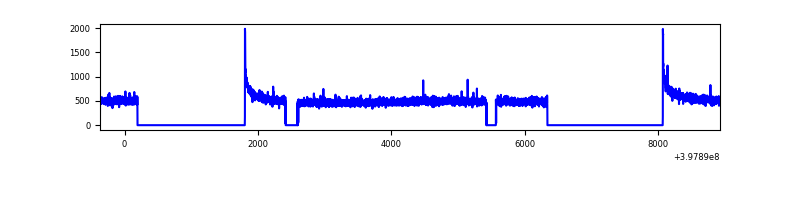 |
| B | 9302 | 5642 | 84 | 84 | 0.90% | 1.49% | 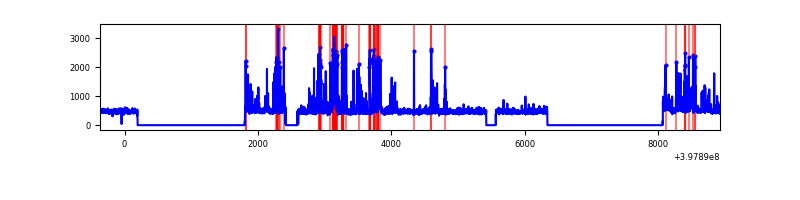 |
| C | 9302 | 5641 | 22 | 22 | 0.24% | 0.39% | 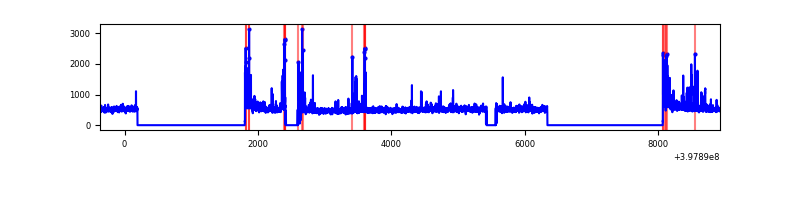 |
| D | 9302 | 5637 | 81 | 81 | 0.87% | 1.44% | 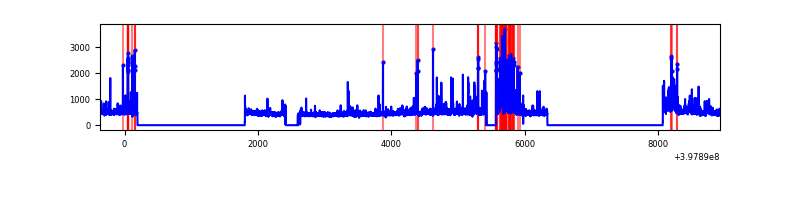 |
Top three noisy pixels from each quadrant. If the there are fewer than three noisy pixels in the level2.evt file, extra rows are filled as -1
| Pixel properties | Quadrant properties | ||||||
|---|---|---|---|---|---|---|---|
| Quadrant | DetID | PixID | Counts | Sigma | Mean | Median | Sigma |
| A | 10 | 83 | 264044 | 1930.33 | 669 | 655 | 136.4 |
| A | 13 | 6 | 9929 | 67.97 | 669 | 655 | 136.4 |
| A | 13 | 254 | 8667 | 58.72 | 669 | 655 | 136.4 |
| B | 5 | 172 | 611455 | 4823.7 | 658 | 641 | 126.6 |
| B | 4 | 232 | 97508 | 764.97 | 658 | 641 | 126.6 |
| B | 12 | 111 | 15739 | 119.23 | 658 | 641 | 126.6 |
| C | 15 | 214 | 261203 | 1729.28 | 647 | 651 | 150.7 |
| C | 0 | 10 | 165541 | 1094.37 | 647 | 651 | 150.7 |
| C | 14 | 254 | 153421 | 1013.93 | 647 | 651 | 150.7 |
| D | 2 | 249 | 288223 | 1822.67 | 644 | 626 | 157.8 |
| D | 12 | 217 | 84521 | 531.69 | 644 | 626 | 157.8 |
| D | 7 | 55 | 57091 | 357.85 | 644 | 626 | 157.8 |
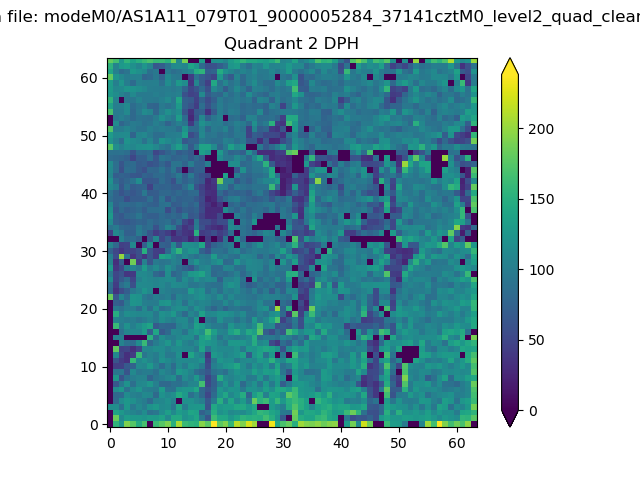
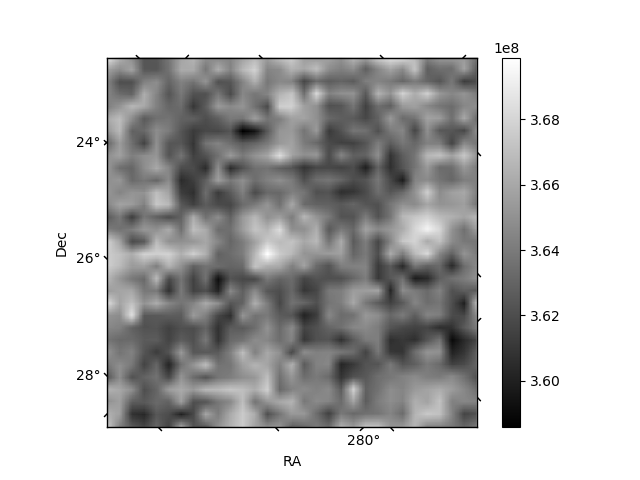
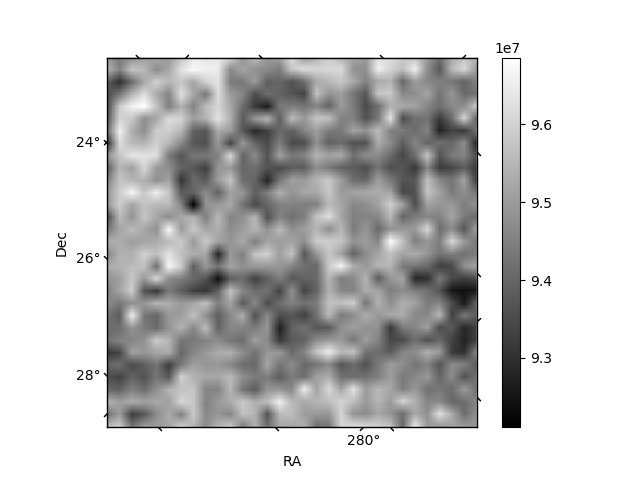
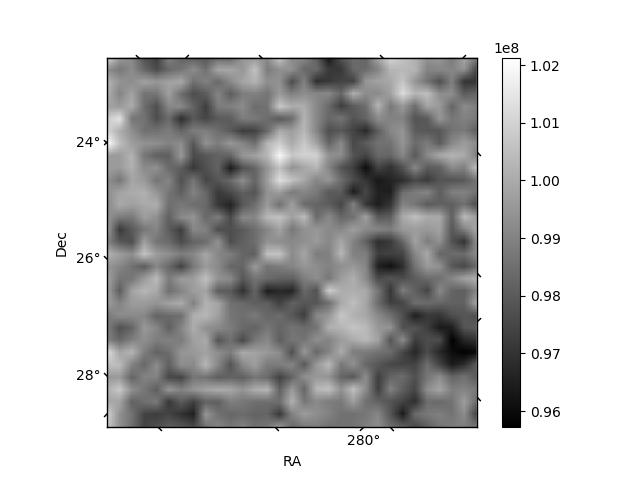
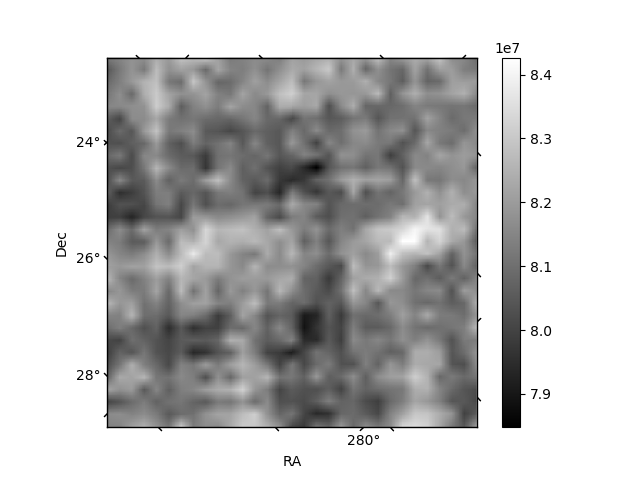
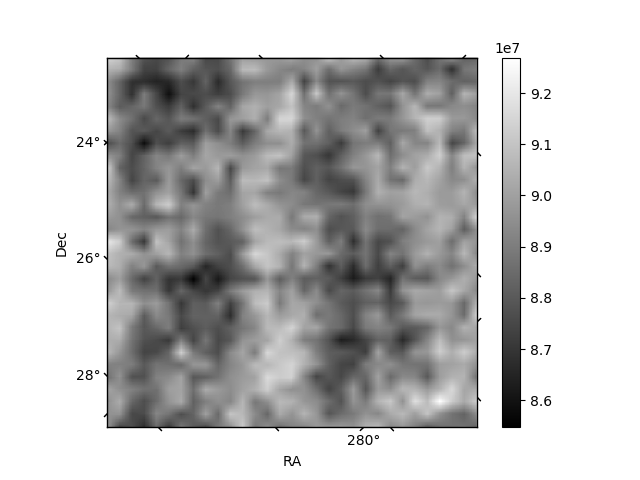
Histogram calculated using DETX and DETY for each event in the final _common_clean file
| Quadrant A | 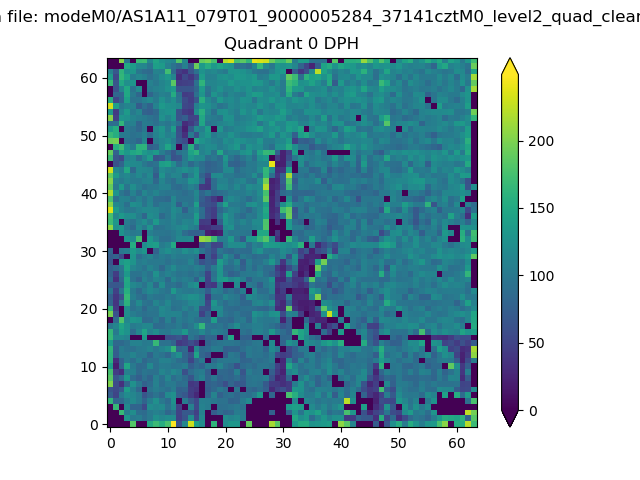 |
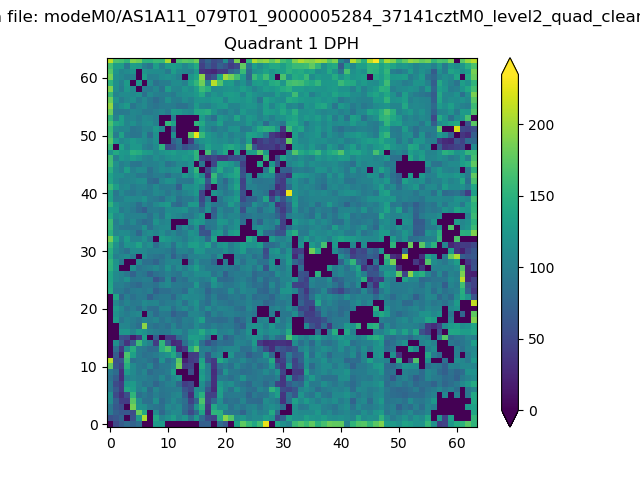 |
Quadrant B |
|---|---|---|---|
| Quadrant D | 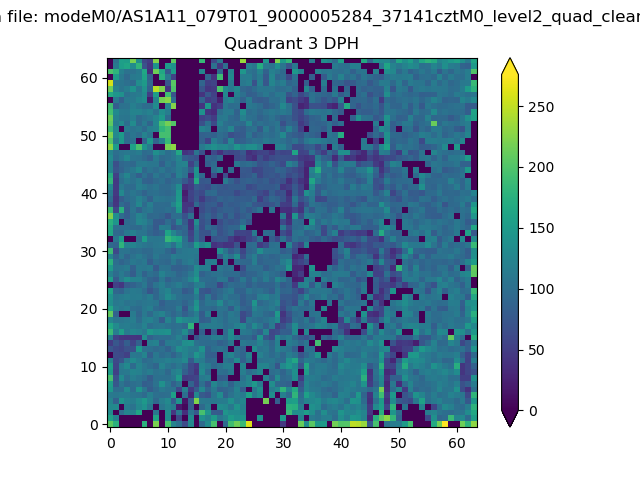 |
 |
Quadrant C |
| Plot type | Count rate plots | Images |
|---|---|---|
| Comparison with Poisson distribution Blue bars denote a histogram of data divided into 1 sec bins. Red curve is a Poisson curve with rate = median count rate of data. |
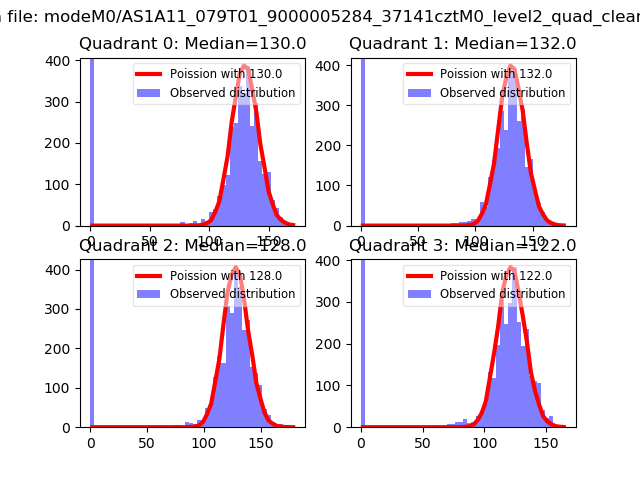 |
 |
| Quadrant-wise count rates Data is divided into 100 sec bins |
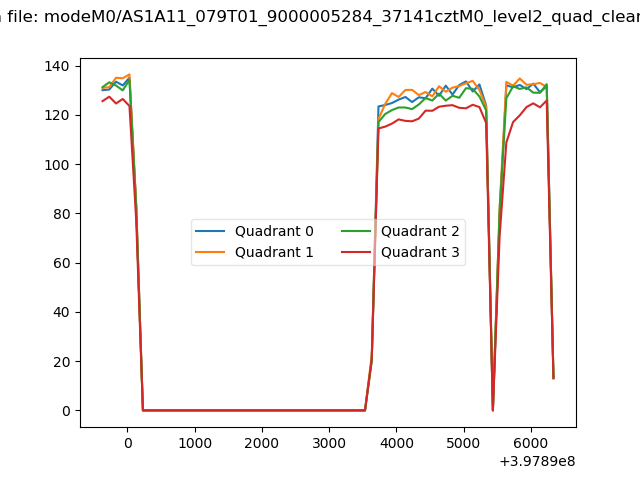 |
|
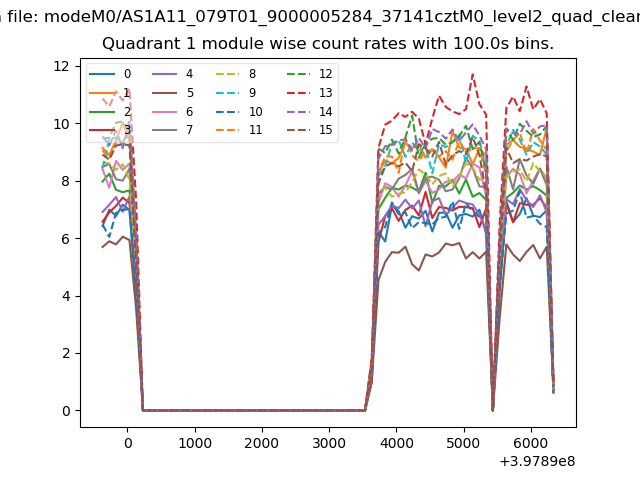
| Module-wise count rates for Quadrant A Data is divided into 100 sec bins |
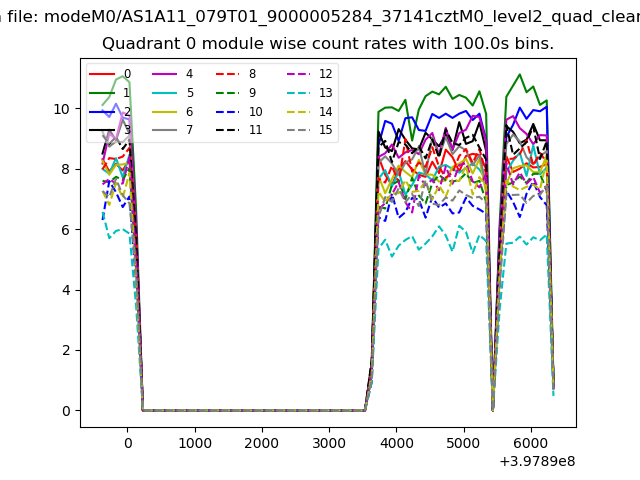 |
 |
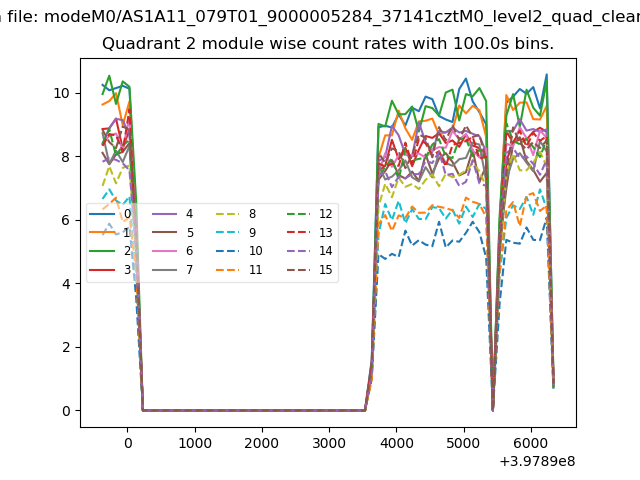
| Module-wise count rates for Quadrant B Data is divided into 100 sec bins |
 |
 |
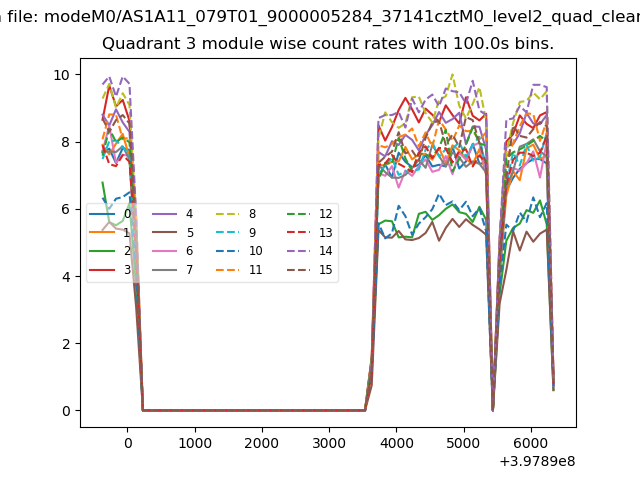
| Module-wise count rates for Quadrant C Data is divided into 100 sec bins |
 |
 |
| Module-wise count rates for Quadrant D Data is divided into 100 sec bins |
 |
 |
| Parameter | Plot |
|---|---|
| CZT HV Monitor | 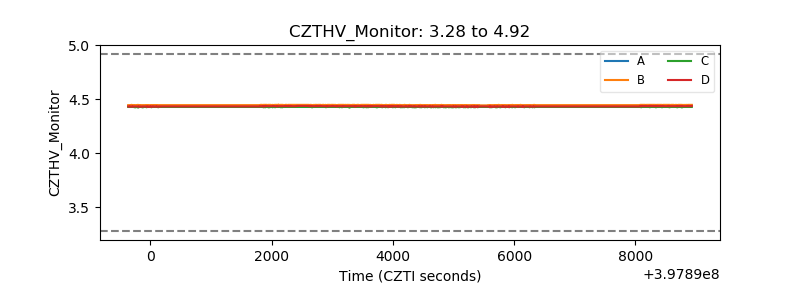 |
| D_VDD | 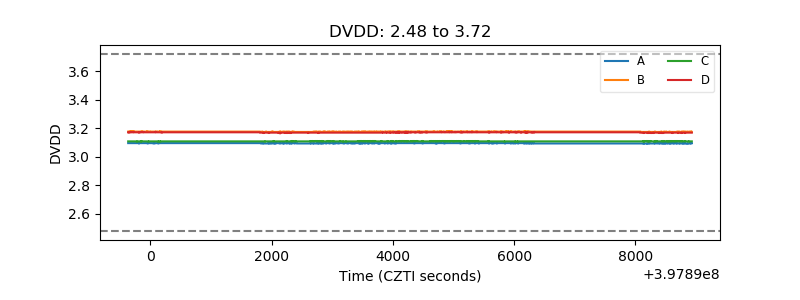 |
| Temperature 1 | 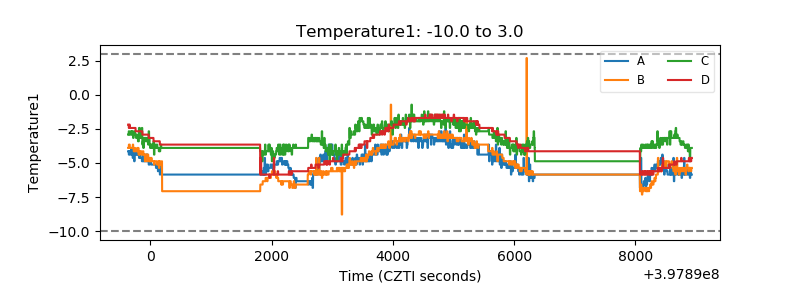 |
| Veto HV Monitor | 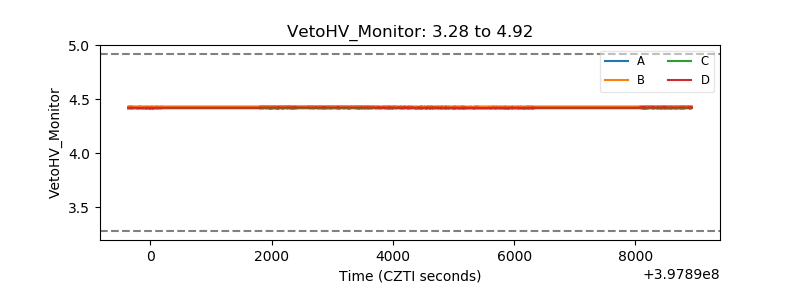 |
| Veto LLD | 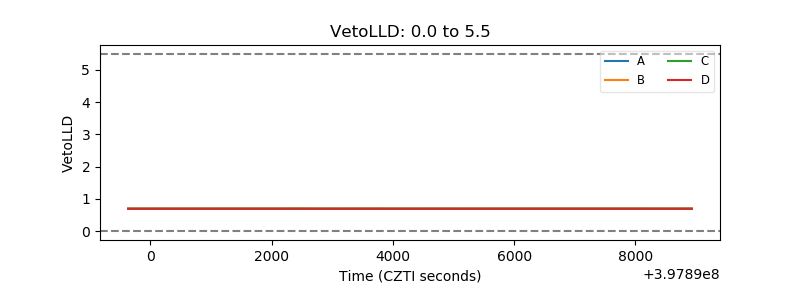 |
| Alpha Counter | 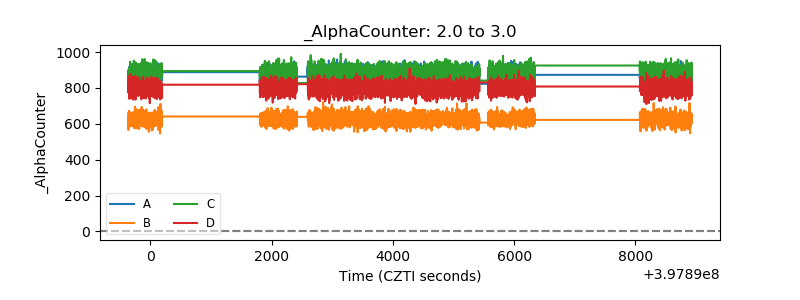 |
| _CPM_Rate | 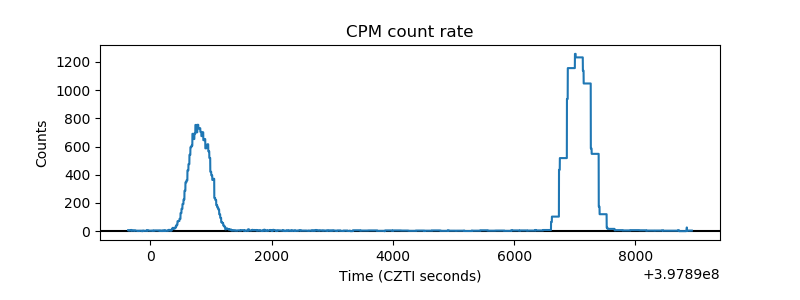 |
| CZT Counter | 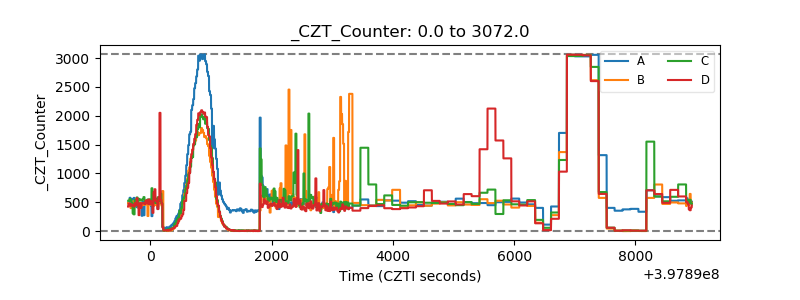 |
| +2.5 Volts monitor | 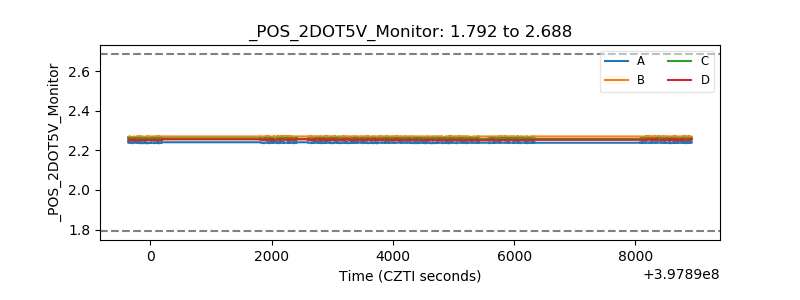 |
| +5 Volts monitor | 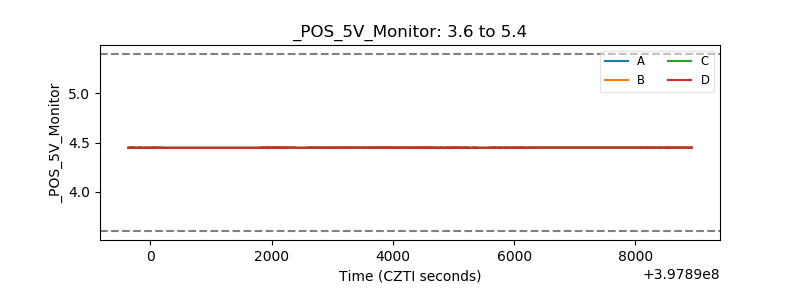 |
| _ROLL_ROT | 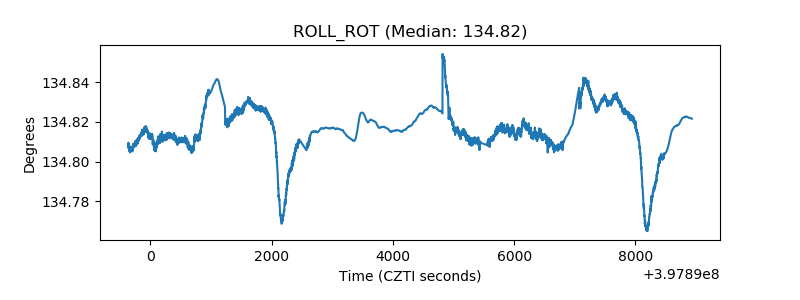 |
| _Roll_DEC | 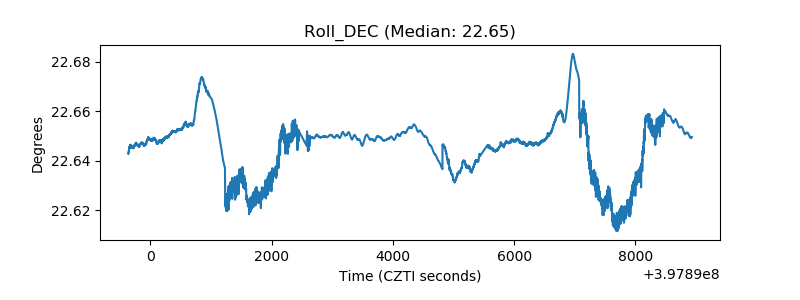 |
| _Roll_RA | 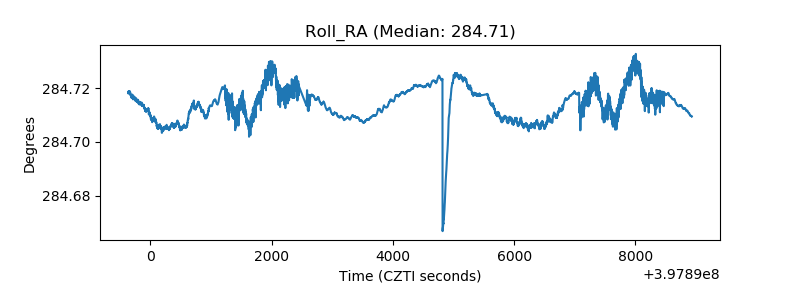 |
| Veto Counter | 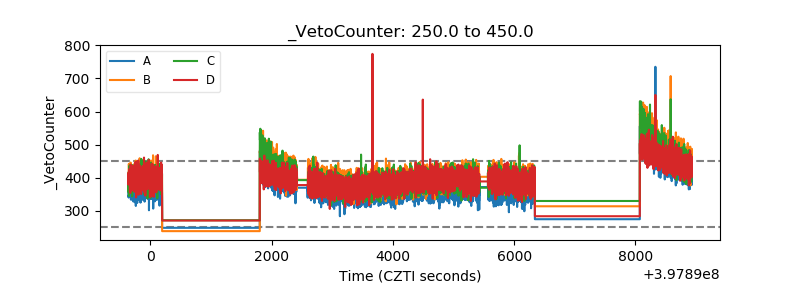 |