| Param | Original file | Final file |
|---|---|---|
| Filename | modeM0/AS1A11_079T01_9000005284_37142cztM0_level2.evt | modeM0/AS1A11_079T01_9000005284_37142cztM0_level2_quad_clean.evt |
| Size (bytes) | 750,113,280 | 116,478,720 |
| Size | 715.4 MB | 111.1 MB |
| Events in quadrant A | 5,030,345 | 728,411 |
| Events in quadrant B | 6,020,883 | 728,572 |
| Events in quadrant C | 5,589,551 | 715,790 |
| Events in quadrant D | 5,416,961 | 678,974 |
| Mode M9 | |||
|---|---|---|---|
| Quadrant | BADHDUFLAG | Total packets | Discarded packets |
| A | 0 | 38 | 0 |
| B | 0 | 38 | 0 |
| C | 0 | 38 | 0 |
| D | 0 | 39 | 0 |
| Mode SS | |||
|---|---|---|---|
| Quadrant | BADHDUFLAG | Total packets | Discarded packets |
| A | 0 | 200 | 0 |
| B | 0 | 200 | 0 |
| C | 0 | 200 | 0 |
| D | 0 | 200 | 0 |
| Mode M0 | |||
|---|---|---|---|
| Quadrant | BADHDUFLAG | Total packets | Discarded packets |
| A | 0 | 20721 | 4 |
| B | 0 | 24102 | 3 |
| C | 0 | 22225 | 3 |
| D | 0 | 22501 | 3 |
| Quadrant | Total seconds | Saturated seconds | Saturation percentage |
|---|---|---|---|
| A | 9742 | 13 | 0.133443% |
| B | 9742 | 352 | 3.613221% |
| C | 9742 | 96 | 0.985424% |
| D | 9742 | 146 | 1.498666% |
Noise dominated data is calculated using 1-second bins in cleaned event files. If a bin has >2000 counts, and if more than 50% of those come from <1% of pixels, then it is considered to be noise-dominated and hence unusable.
| Quadrant | # 1 sec bins | Bins with >0 counts | Bins with >2000 counts | High rate bins dominated by noise | Noise dominated (total time) | Noise dominated (detector-on time) | Marked lightcurve |
|---|---|---|---|---|---|---|---|
| A | 13356 | 9744 | 1 | 1 | 0.01% | 0.01% | 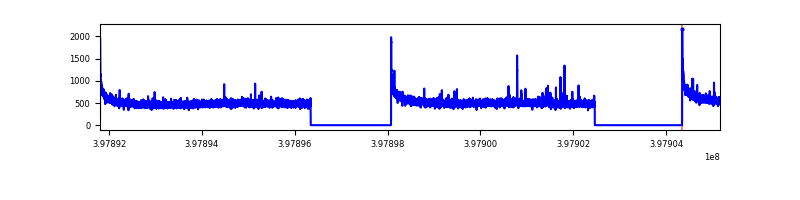 |
| B | 13356 | 9744 | 199 | 199 | 1.49% | 2.04% | 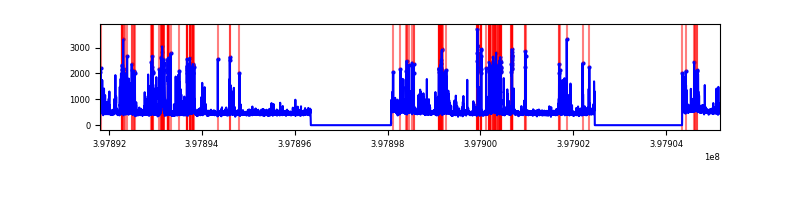 |
| C | 13356 | 9744 | 76 | 76 | 0.57% | 0.78% | 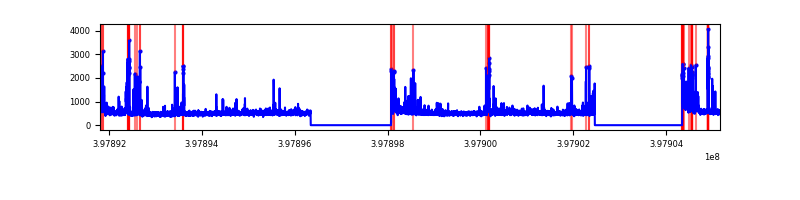 |
| D | 13356 | 9744 | 124 | 124 | 0.93% | 1.27% | 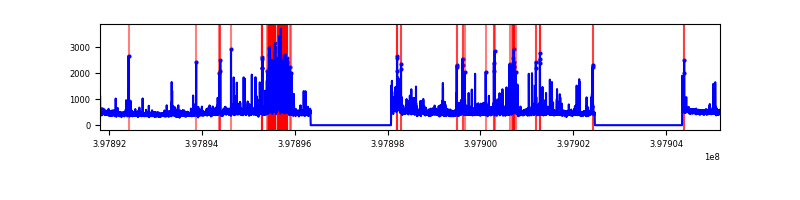 |
Top three noisy pixels from each quadrant. If the there are fewer than three noisy pixels in the level2.evt file, extra rows are filled as -1
| Pixel properties | Quadrant properties | ||||||
|---|---|---|---|---|---|---|---|
| Quadrant | DetID | PixID | Counts | Sigma | Mean | Median | Sigma |
| A | 10 | 83 | 424494 | 1802.6 | 1176 | 1155 | 234.8 |
| A | 9 | 143 | 31009 | 127.12 | 1176 | 1155 | 234.8 |
| A | 13 | 6 | 16213 | 64.12 | 1176 | 1155 | 234.8 |
| B | 5 | 172 | 1275556 | 5836.86 | 1151 | 1123 | 218.3 |
| B | 4 | 232 | 133097 | 604.44 | 1151 | 1123 | 218.3 |
| B | 5 | 200 | 54082 | 242.55 | 1151 | 1123 | 218.3 |
| C | 15 | 214 | 448282 | 1712.52 | 1129 | 1140 | 261.1 |
| C | 0 | 10 | 415614 | 1587.41 | 1129 | 1140 | 261.1 |
| C | 14 | 254 | 259405 | 989.14 | 1129 | 1140 | 261.1 |
| D | 2 | 249 | 519209 | 1886.07 | 1130 | 1101 | 274.7 |
| D | 12 | 217 | 122083 | 440.41 | 1130 | 1101 | 274.7 |
| D | 10 | 253 | 83932 | 301.53 | 1130 | 1101 | 274.7 |
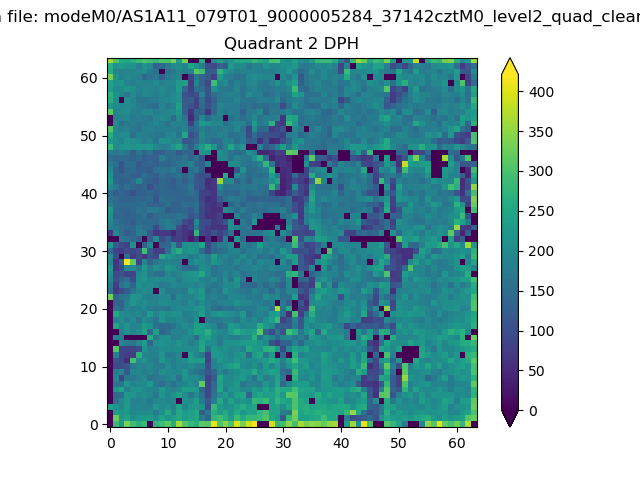
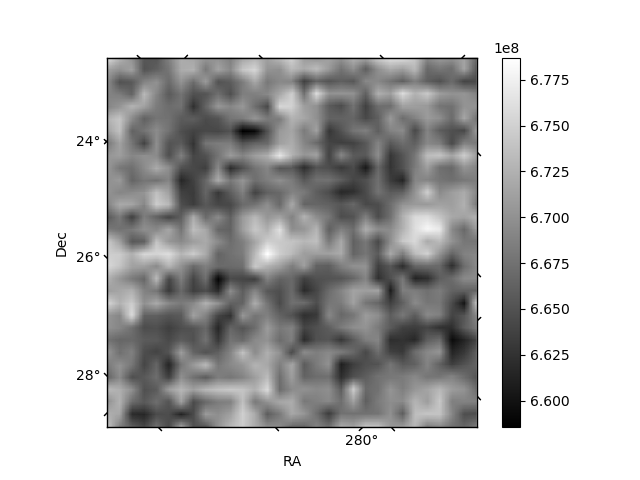
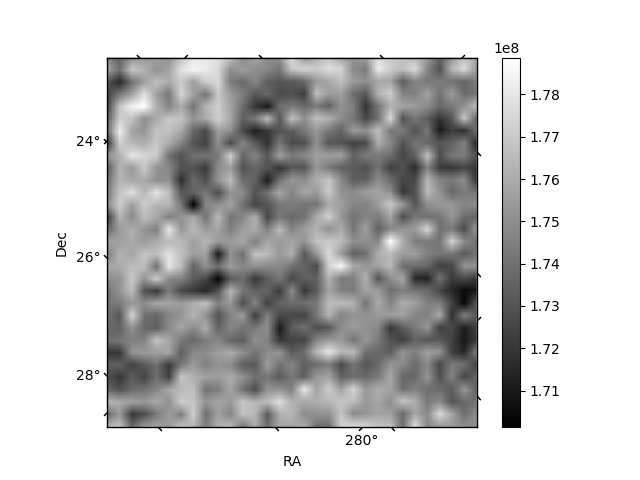
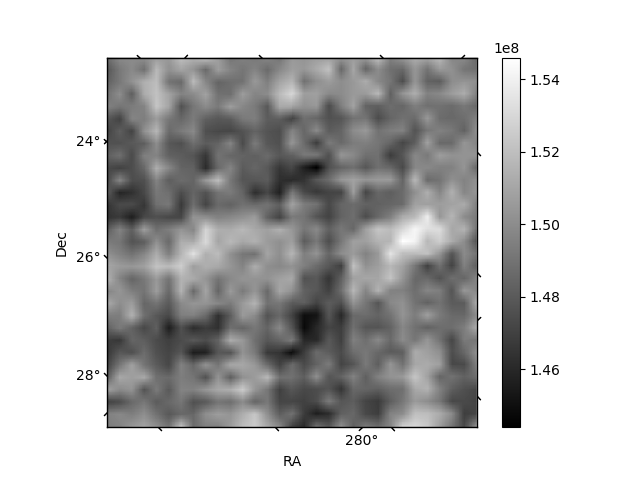
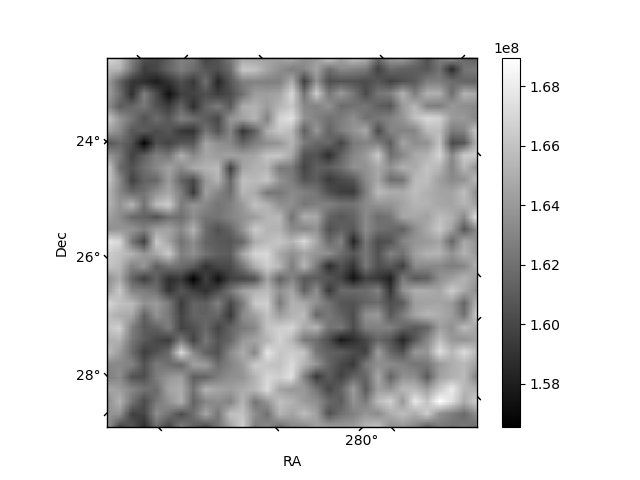
Histogram calculated using DETX and DETY for each event in the final _common_clean file
| Quadrant A | 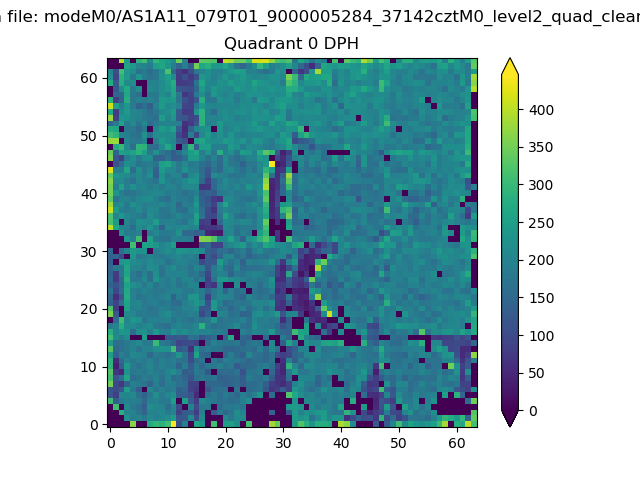 |
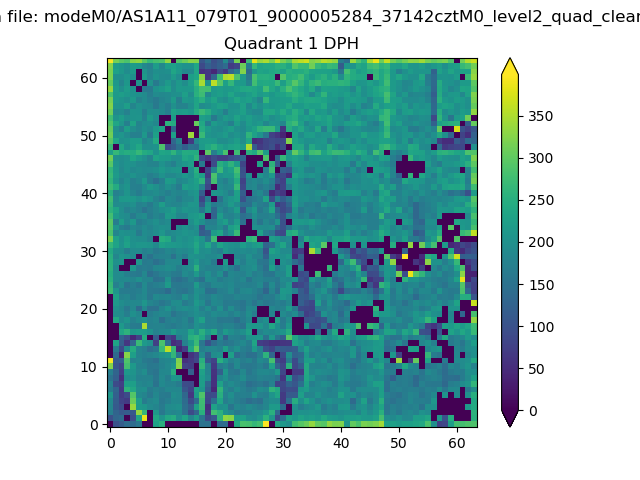 |
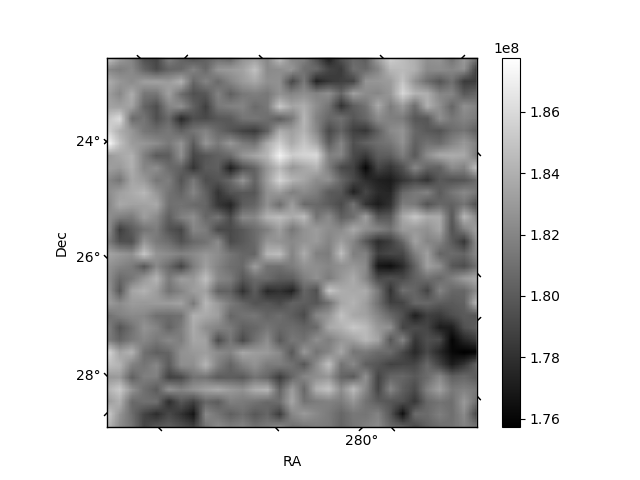
Quadrant B |
|---|---|---|---|
| Quadrant D | 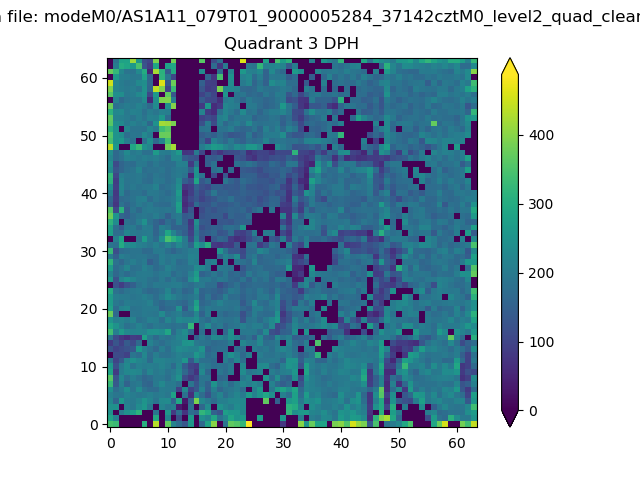 |
 |
Quadrant C |
| Plot type | Count rate plots | Images |
|---|---|---|
| Comparison with Poisson distribution Blue bars denote a histogram of data divided into 1 sec bins. Red curve is a Poisson curve with rate = median count rate of data. |
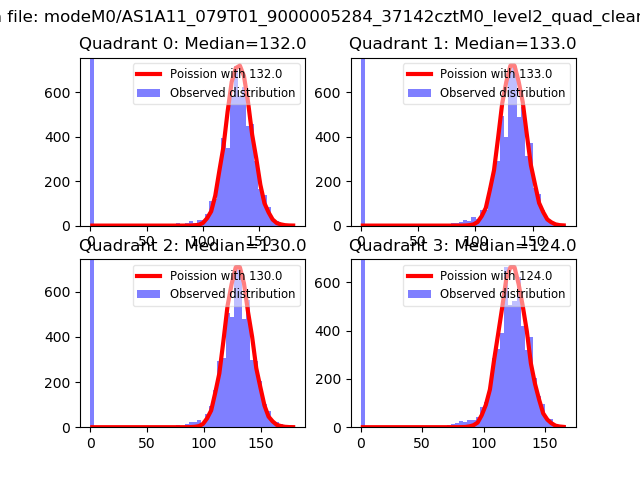 |
 |
| Quadrant-wise count rates Data is divided into 100 sec bins |
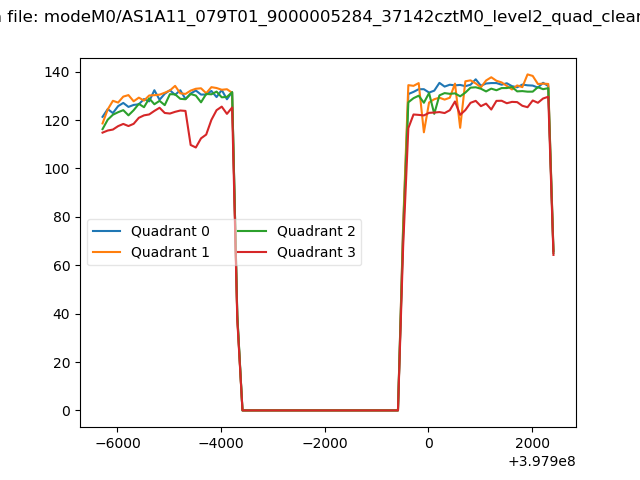 |
|
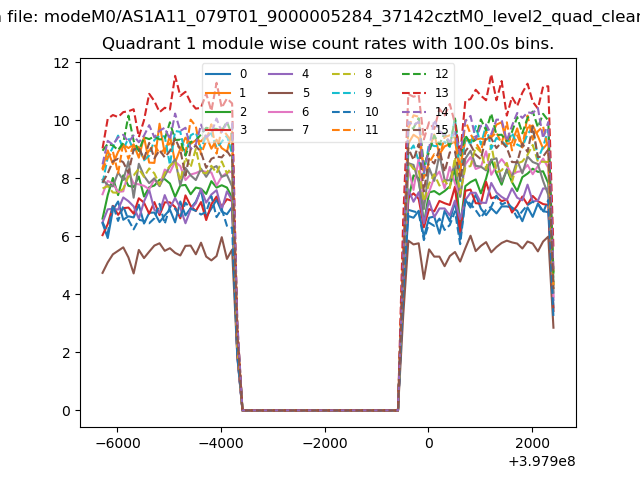
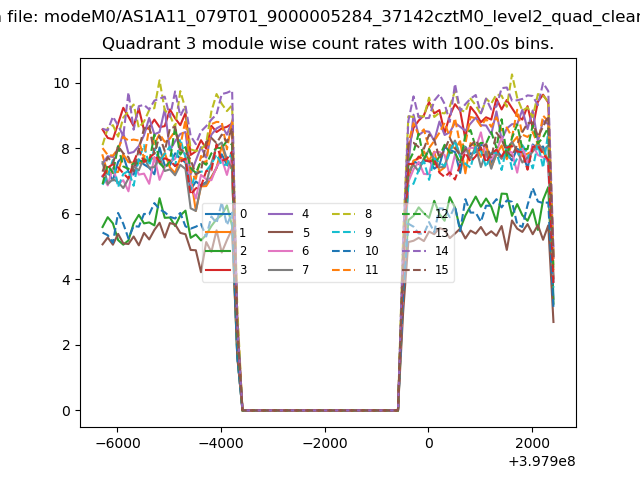
| Module-wise count rates for Quadrant A Data is divided into 100 sec bins |
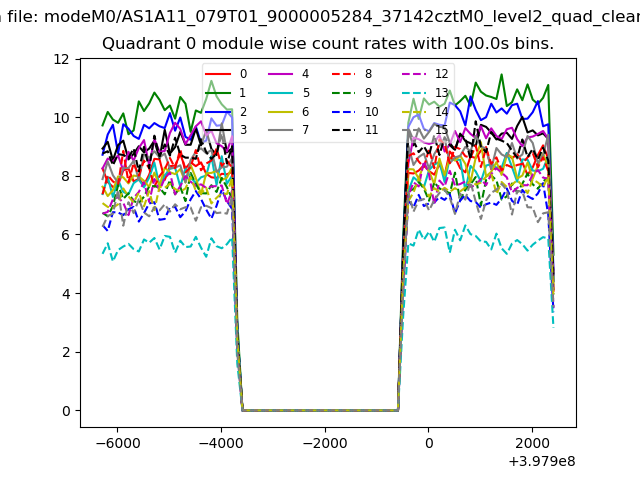 |
 |
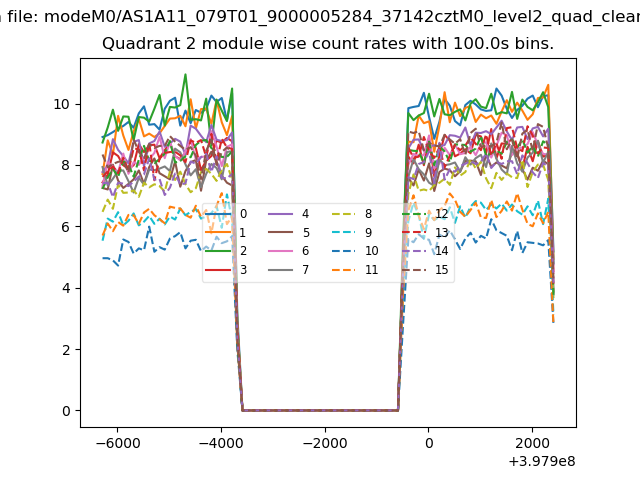
| Module-wise count rates for Quadrant B Data is divided into 100 sec bins |
 |
 |
| Module-wise count rates for Quadrant C Data is divided into 100 sec bins |
 |
 |
| Module-wise count rates for Quadrant D Data is divided into 100 sec bins |
 |
 |
| Parameter | Plot |
|---|---|
| CZT HV Monitor | 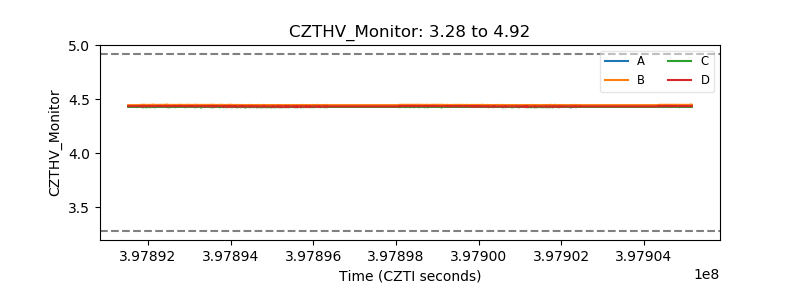 |
| D_VDD | 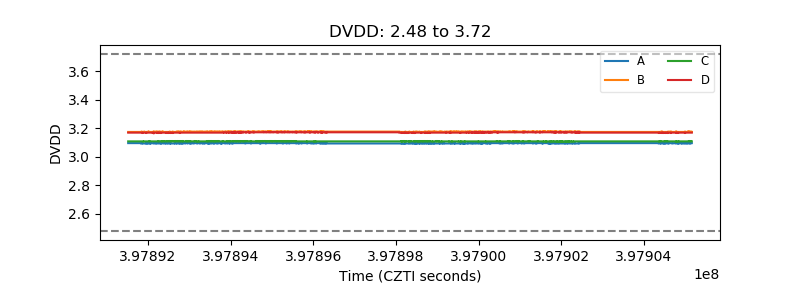 |
| Temperature 1 | 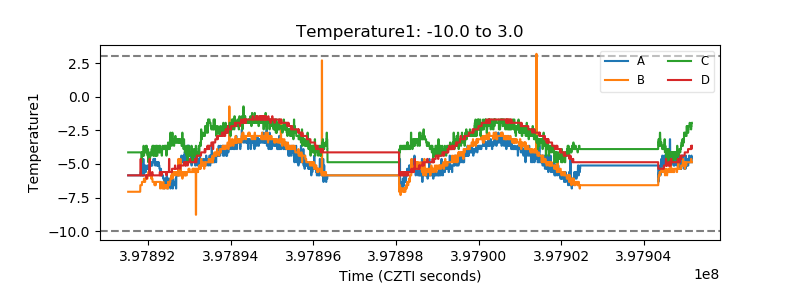 |
| Veto HV Monitor |  |
| Veto LLD | 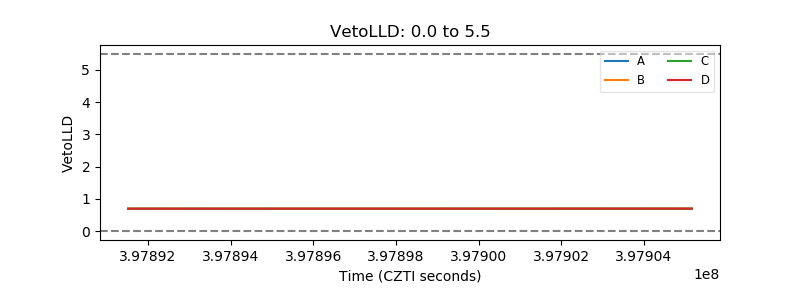 |
| Alpha Counter | 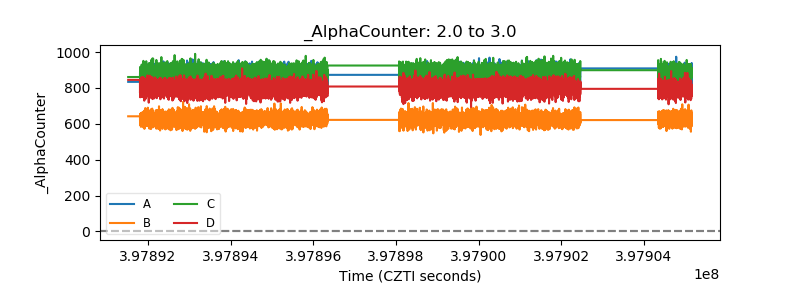 |
| _CPM_Rate | 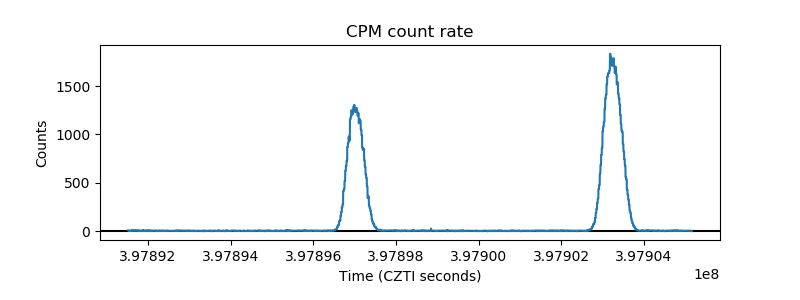 |
| CZT Counter | 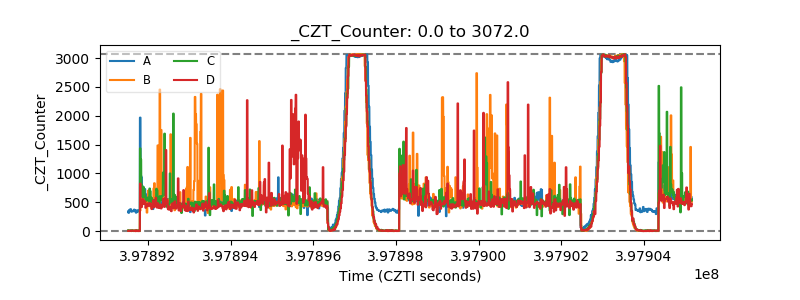 |
| +2.5 Volts monitor | 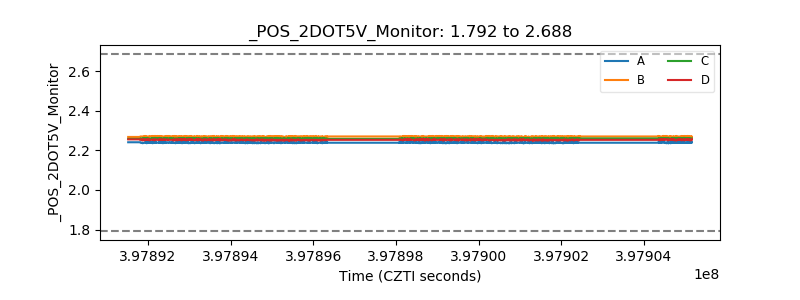 |
| +5 Volts monitor | 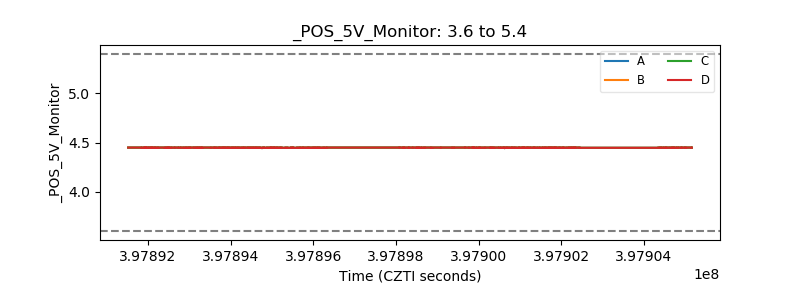 |
| _ROLL_ROT | 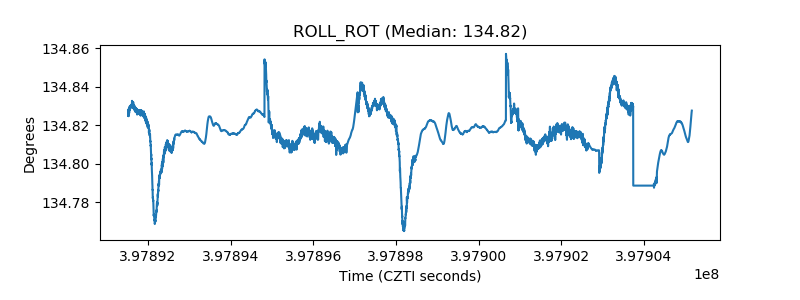 |
| _Roll_DEC | 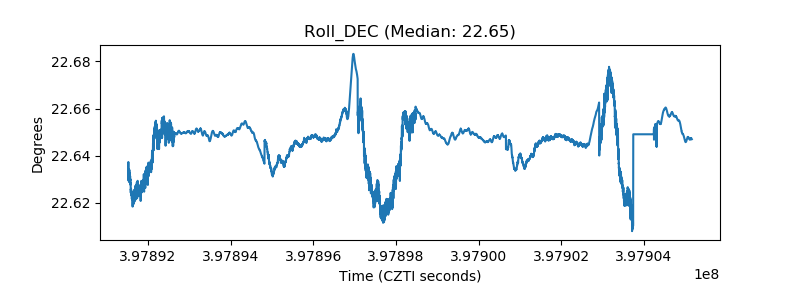 |
| _Roll_RA | 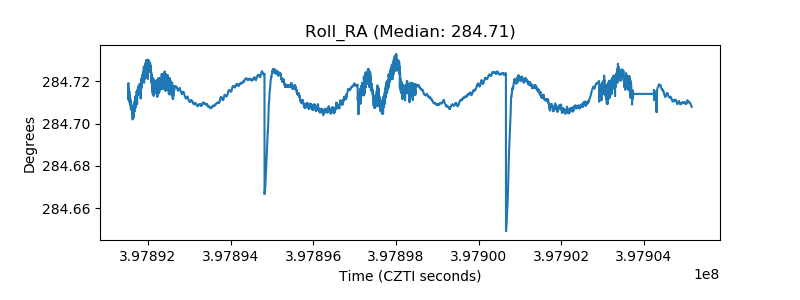 |
| Veto Counter | 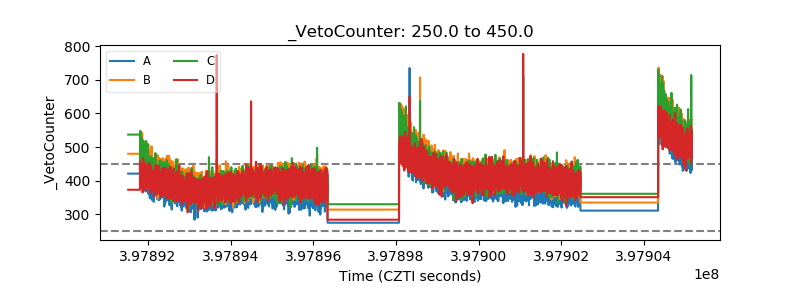 |