| Param | Original file | Final file |
|---|---|---|
| Filename | modeM0/AS1A11_079T01_9000005284_37143cztM0_level2.evt | modeM0/AS1A11_079T01_9000005284_37143cztM0_level2_quad_clean.evt |
| Size (bytes) | 464,618,880 | 78,733,440 |
| Size | 443.1 MB | 75.1 MB |
| Events in quadrant A | 2,949,860 | 524,515 |
| Events in quadrant B | 3,394,219 | 519,585 |
| Events in quadrant C | 3,318,240 | 506,777 |
| Events in quadrant D | 4,047,925 | 460,758 |
| Mode M9 | |||
|---|---|---|---|
| Quadrant | BADHDUFLAG | Total packets | Discarded packets |
| A | 0 | 31 | 0 |
| B | 0 | 31 | 0 |
| C | 0 | 31 | 0 |
| D | 0 | 32 | 0 |
| Mode SS | |||
|---|---|---|---|
| Quadrant | BADHDUFLAG | Total packets | Discarded packets |
| A | 0 | 108 | 0 |
| B | 0 | 108 | 0 |
| C | 0 | 108 | 0 |
| D | 0 | 108 | 0 |
| Mode M0 | |||
|---|---|---|---|
| Quadrant | BADHDUFLAG | Total packets | Discarded packets |
| A | 0 | 11910 | 3 |
| B | 0 | 13272 | 2 |
| C | 0 | 13012 | 2 |
| D | 0 | 15296 | 2 |
| Quadrant | Total seconds | Saturated seconds | Saturation percentage |
|---|---|---|---|
| A | 5319 | 9 | 0.169205% |
| B | 5319 | 217 | 4.079714% |
| C | 5319 | 78 | 1.466441% |
| D | 5319 | 368 | 6.918594% |
Noise dominated data is calculated using 1-second bins in cleaned event files. If a bin has >2000 counts, and if more than 50% of those come from <1% of pixels, then it is considered to be noise-dominated and hence unusable.
| Quadrant | # 1 sec bins | Bins with >0 counts | Bins with >2000 counts | High rate bins dominated by noise | Noise dominated (total time) | Noise dominated (detector-on time) | Marked lightcurve |
|---|---|---|---|---|---|---|---|
| A | 7322 | 5320 | 1 | 1 | 0.01% | 0.02% | 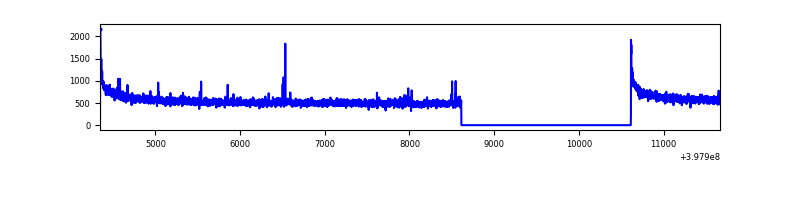 |
| B | 7322 | 5320 | 143 | 143 | 1.95% | 2.69% | 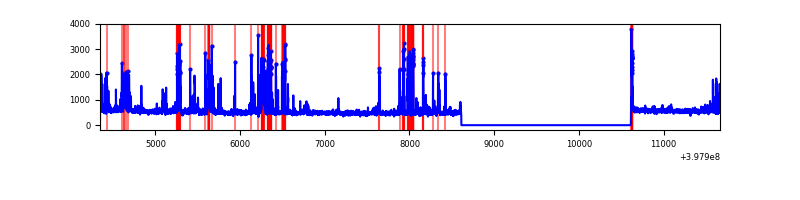 |
| C | 7322 | 5320 | 69 | 69 | 0.94% | 1.30% | 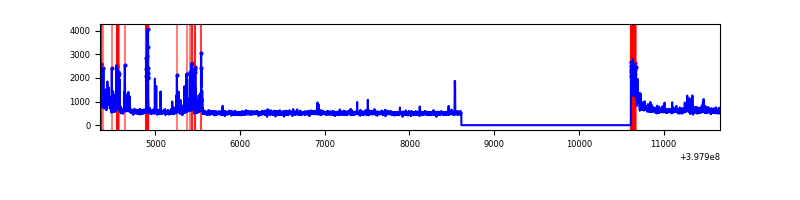 |
| D | 7322 | 5320 | 351 | 351 | 4.79% | 6.60% | 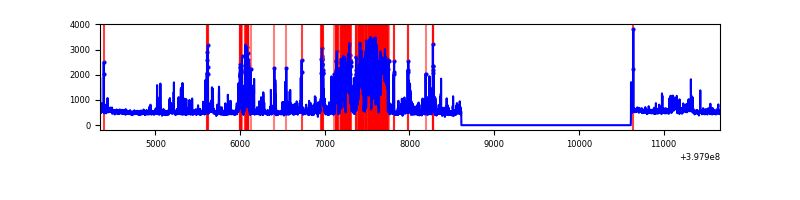 |
Top three noisy pixels from each quadrant. If the there are fewer than three noisy pixels in the level2.evt file, extra rows are filled as -1
| Pixel properties | Quadrant properties | ||||||
|---|---|---|---|---|---|---|---|
| Quadrant | DetID | PixID | Counts | Sigma | Mean | Median | Sigma |
| A | 10 | 83 | 252362 | 1829.81 | 692 | 682 | 137.5 |
| A | 7 | 3 | 13105 | 90.32 | 692 | 682 | 137.5 |
| A | 9 | 143 | 9631 | 65.06 | 692 | 682 | 137.5 |
| B | 5 | 172 | 625060 | 4936.16 | 670 | 655 | 126.5 |
| B | 5 | 184 | 48889 | 381.31 | 670 | 655 | 126.5 |
| B | 0 | 182 | 41382 | 321.96 | 670 | 655 | 126.5 |
| C | 0 | 10 | 478353 | 3135.49 | 655 | 660 | 152.4 |
| C | 15 | 214 | 247043 | 1617.21 | 655 | 660 | 152.4 |
| C | 1 | 23 | 13553 | 84.63 | 655 | 660 | 152.4 |
| D | 2 | 249 | 1014155 | 6491.28 | 648 | 634 | 156.1 |
| D | 12 | 17 | 103677 | 659.96 | 648 | 634 | 156.1 |
| D | 12 | 227 | 92607 | 589.06 | 648 | 634 | 156.1 |
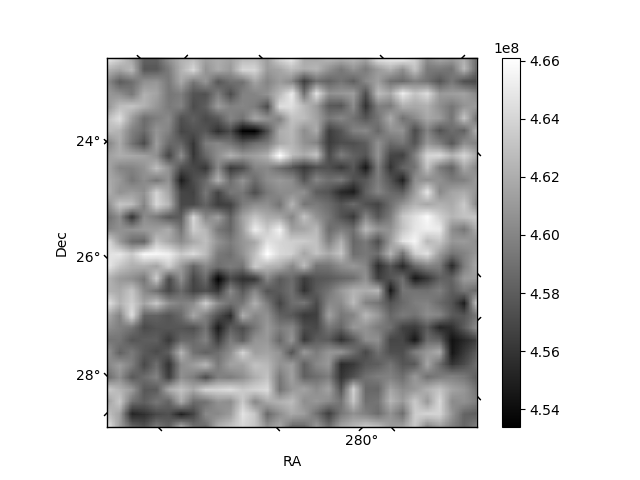
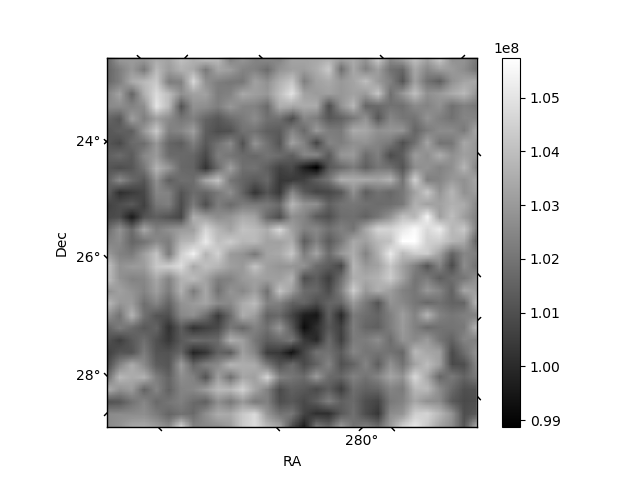
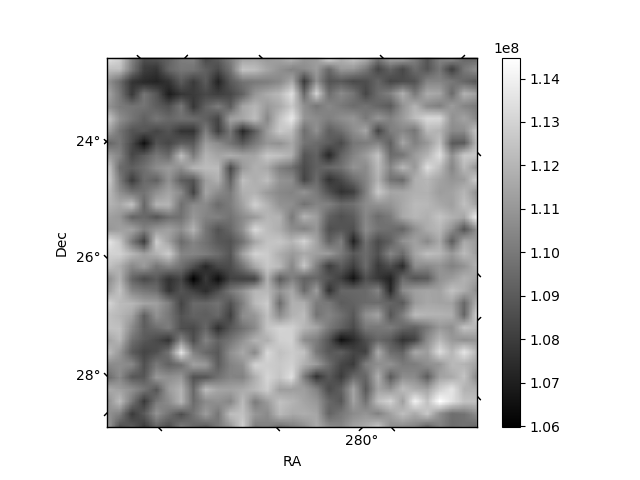
Histogram calculated using DETX and DETY for each event in the final _common_clean file
| Quadrant A | 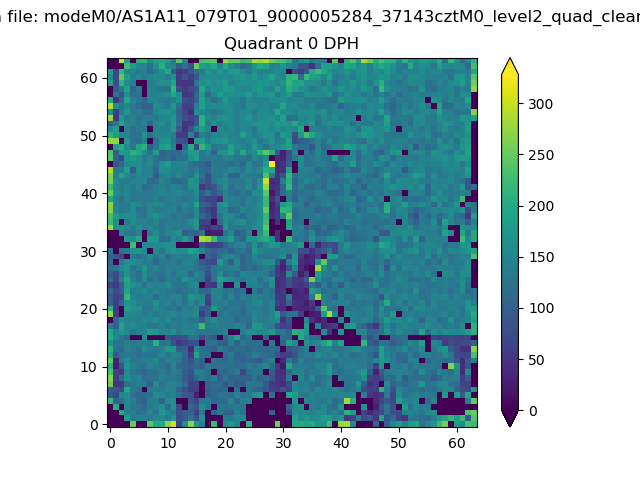 |
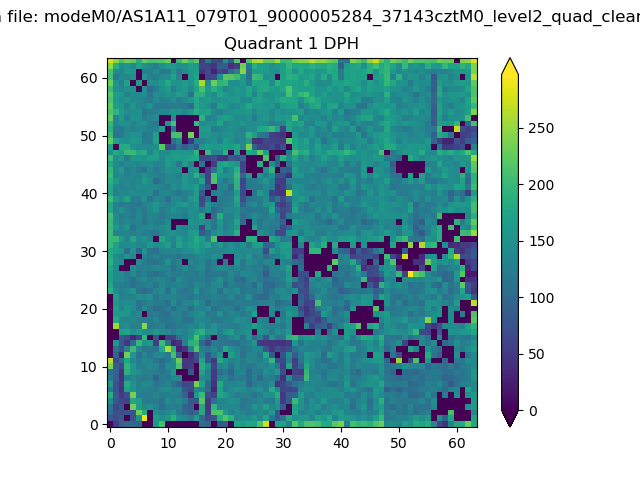 |
Quadrant B |
|---|---|---|---|
| Quadrant D | 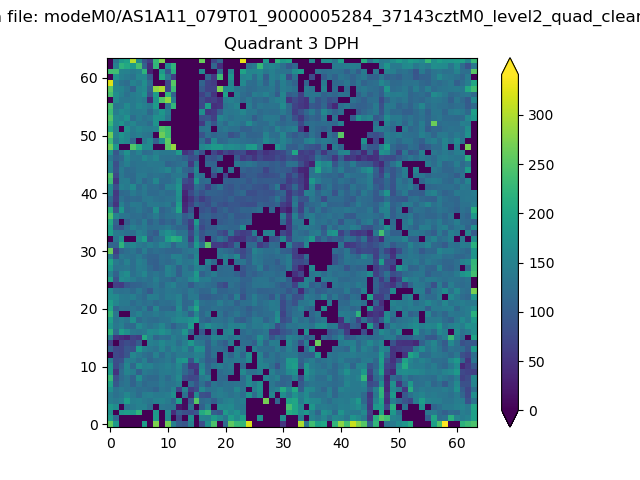 |
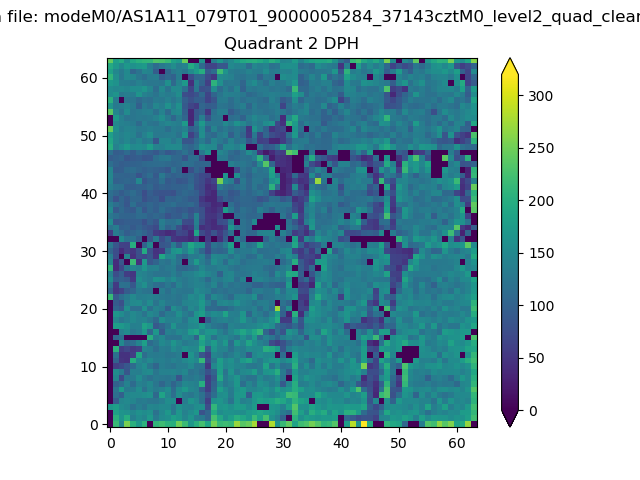 |
Quadrant C |
| Plot type | Count rate plots | Images |
|---|---|---|
| Comparison with Poisson distribution Blue bars denote a histogram of data divided into 1 sec bins. Red curve is a Poisson curve with rate = median count rate of data. |
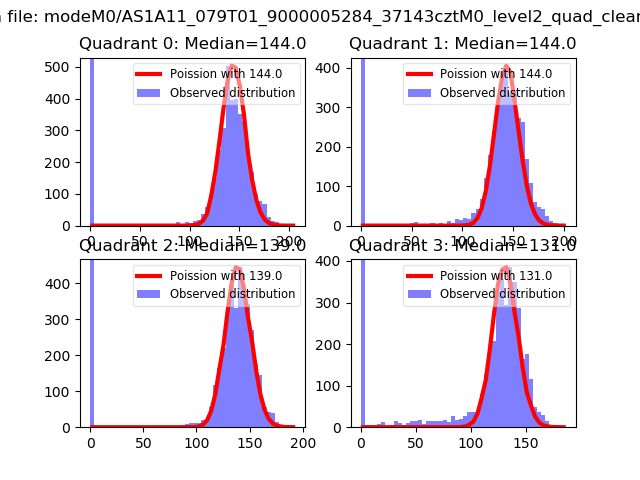 |
 |
| Quadrant-wise count rates Data is divided into 100 sec bins |
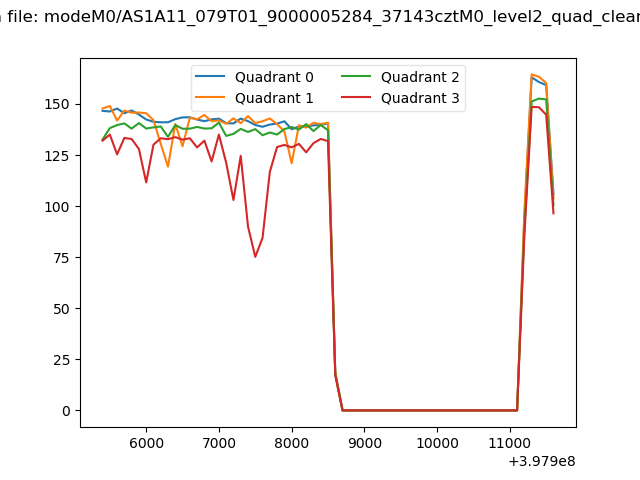 |
|
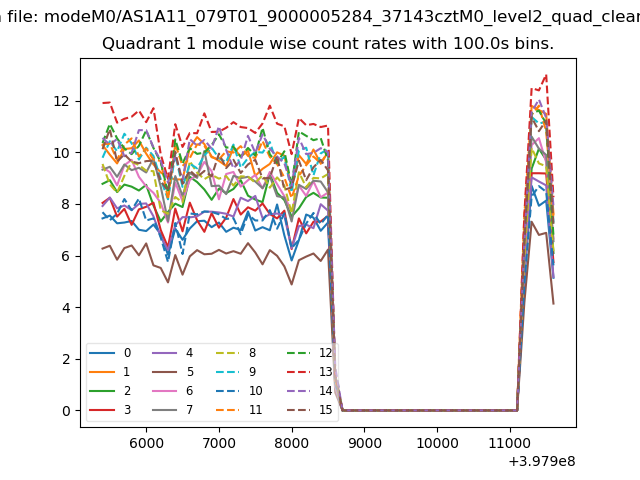
| Module-wise count rates for Quadrant A Data is divided into 100 sec bins |
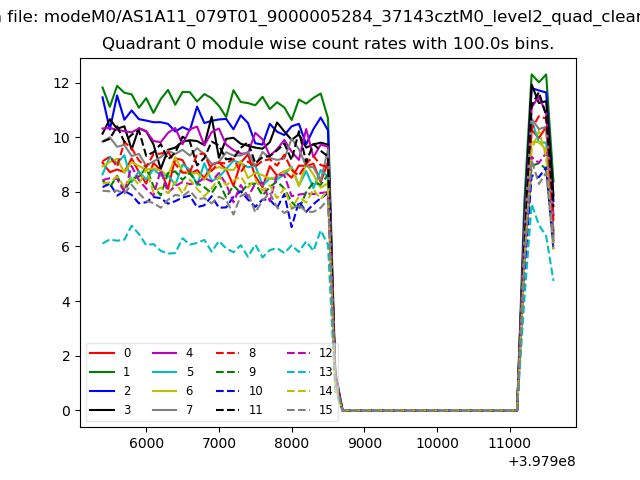 |
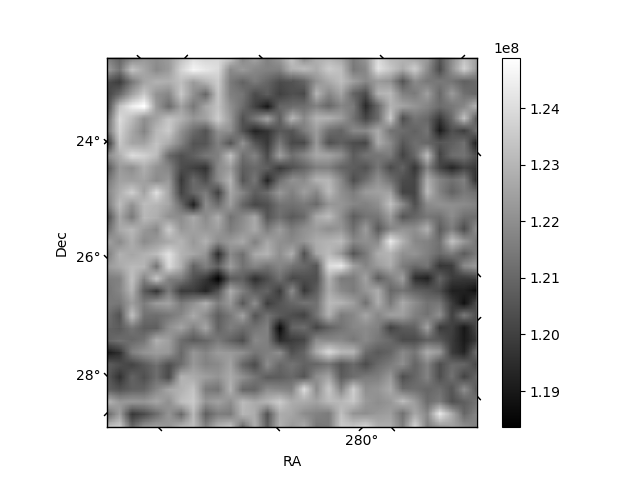 |
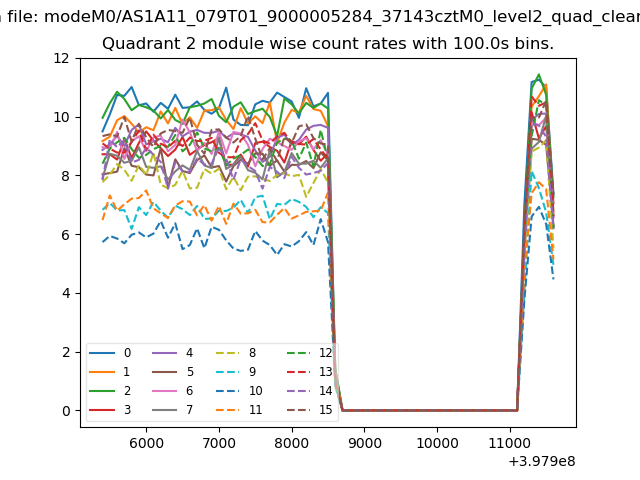
| Module-wise count rates for Quadrant B Data is divided into 100 sec bins |
 |
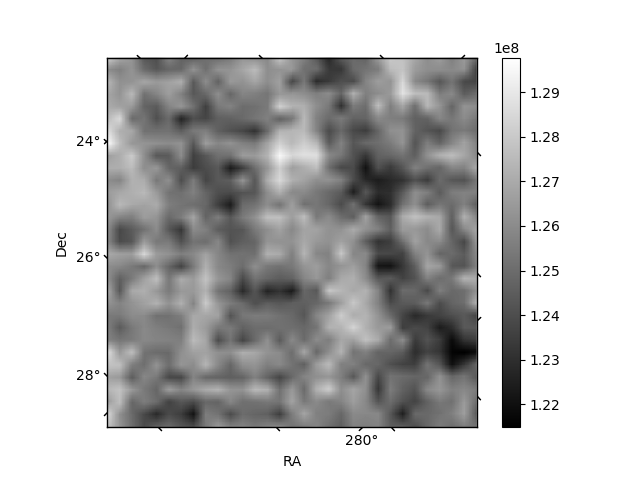 |
| Module-wise count rates for Quadrant C Data is divided into 100 sec bins |
 |
 |
| Module-wise count rates for Quadrant D Data is divided into 100 sec bins |
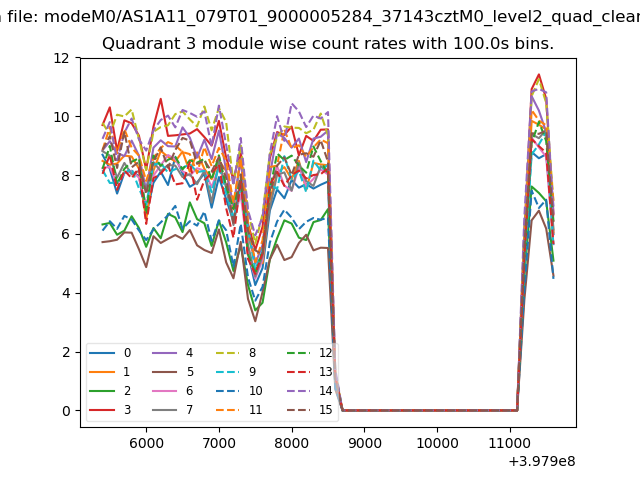 |
 |
| Parameter | Plot |
|---|---|
| CZT HV Monitor | 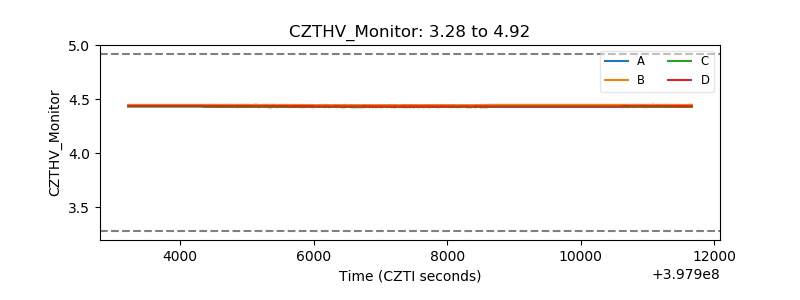 |
| D_VDD | 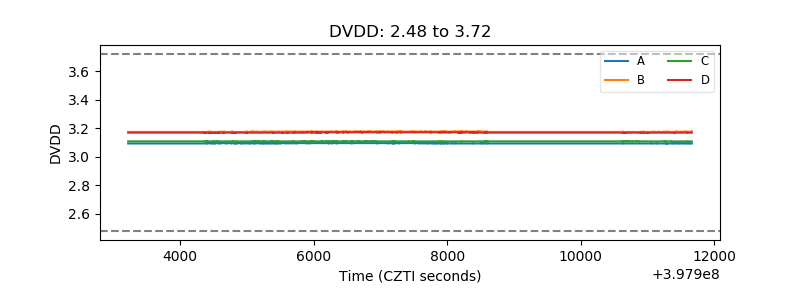 |
| Temperature 1 | 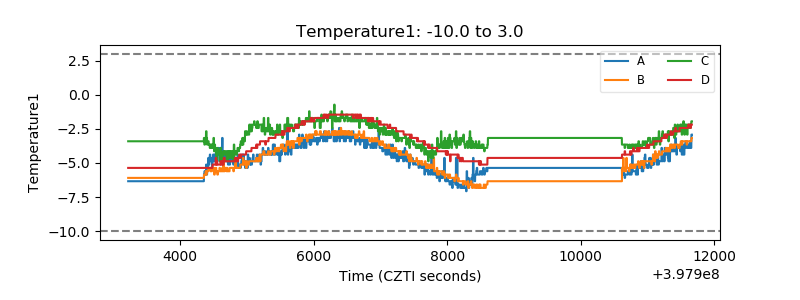 |
| Veto HV Monitor | 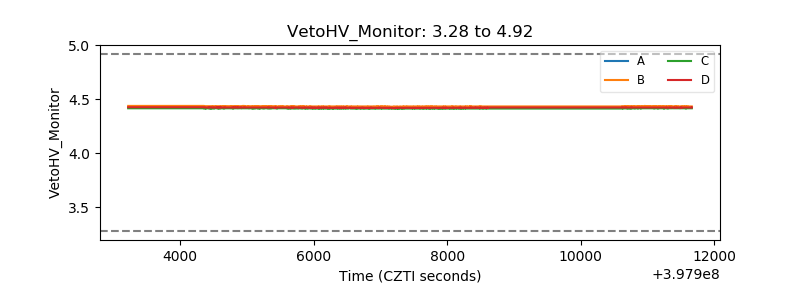 |
| Veto LLD | 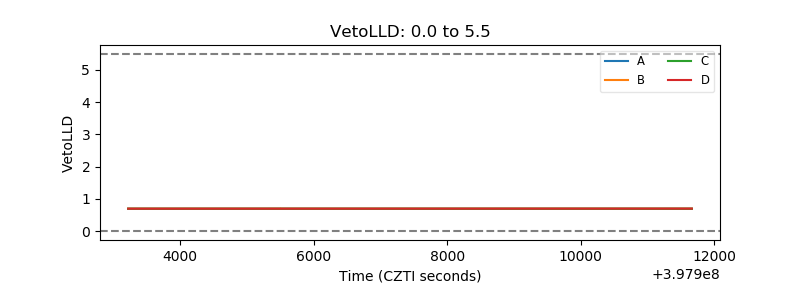 |
| Alpha Counter | 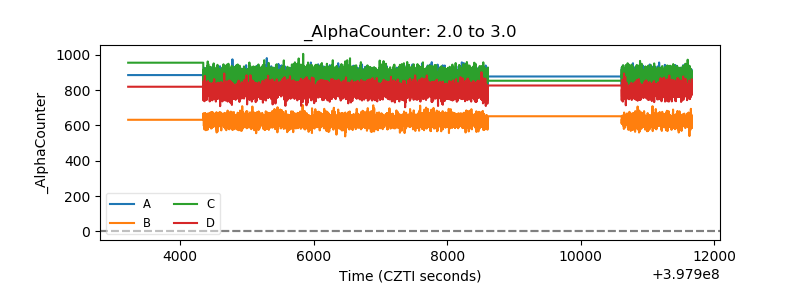 |
| _CPM_Rate | 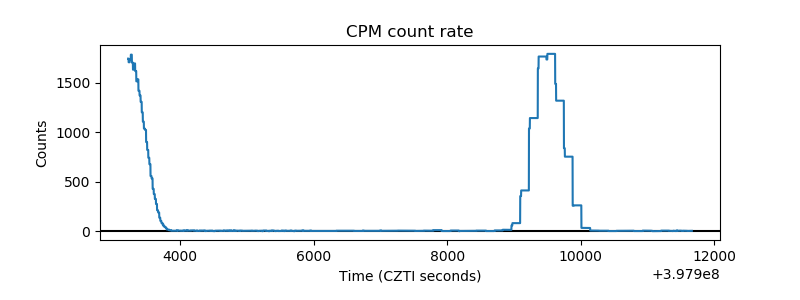 |
| CZT Counter | 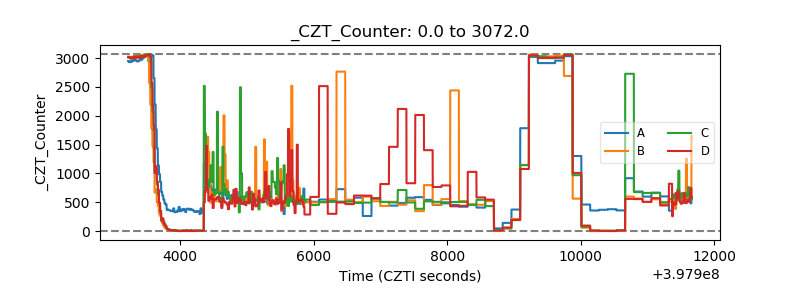 |
| +2.5 Volts monitor | 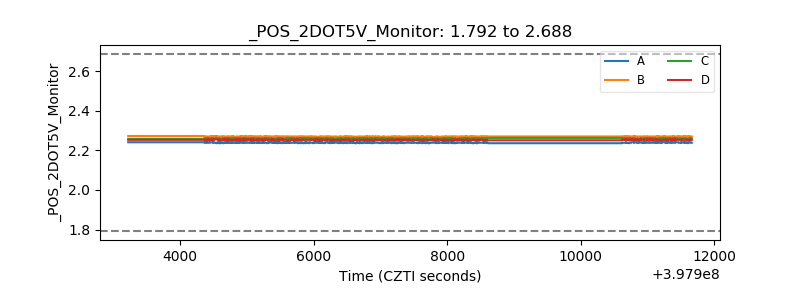 |
| +5 Volts monitor | 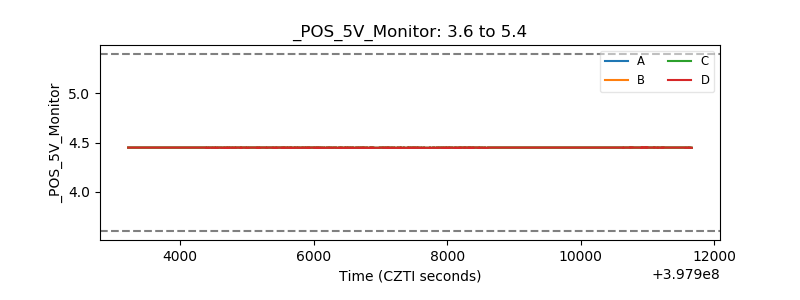 |
| _ROLL_ROT | 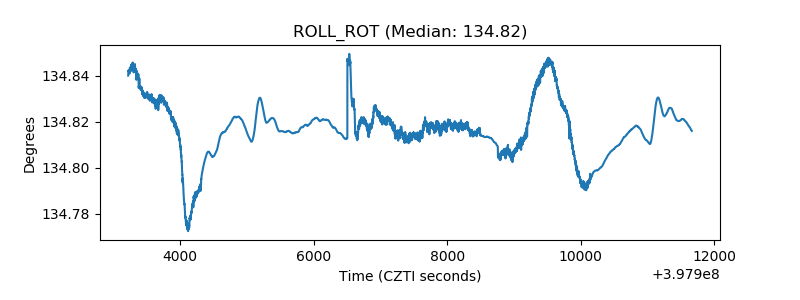 |
| _Roll_DEC | 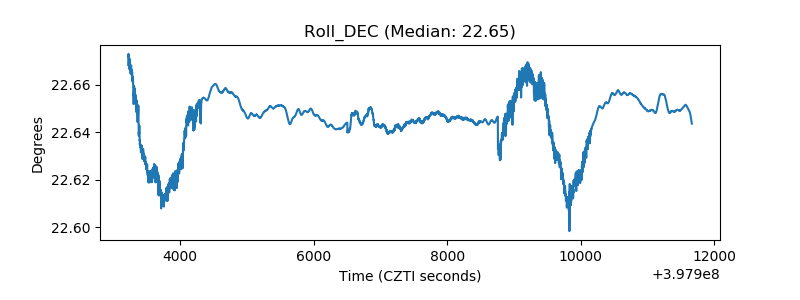 |
| _Roll_RA | 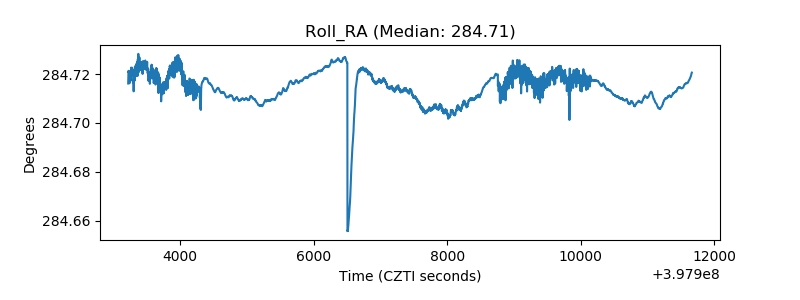 |
| Veto Counter | 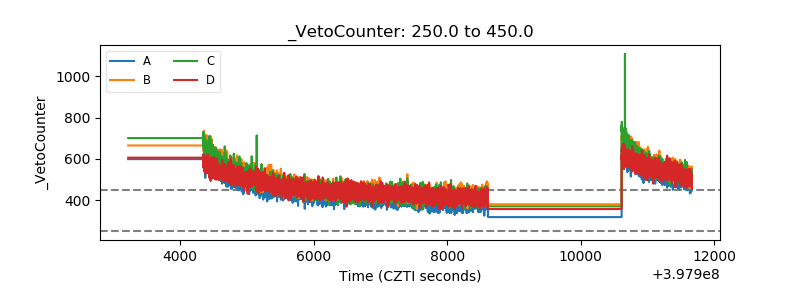 |