| Param | Original file | Final file |
|---|---|---|
| Filename | modeM0/AS1A11_079T01_9000005284_37144cztM0_level2.evt | modeM0/AS1A11_079T01_9000005284_37144cztM0_level2_quad_clean.evt |
| Size (bytes) | 448,960,320 | 96,289,920 |
| Size | 428.2 MB | 91.8 MB |
| Events in quadrant A | 2,926,749 | 664,418 |
| Events in quadrant B | 3,738,662 | 637,066 |
| Events in quadrant C | 3,159,451 | 640,156 |
| Events in quadrant D | 3,417,216 | 608,281 |
| Mode M9 | |||
|---|---|---|---|
| Quadrant | BADHDUFLAG | Total packets | Discarded packets |
| A | 0 | 21 | 0 |
| B | 0 | 21 | 0 |
| C | 0 | 21 | 0 |
| D | 0 | 21 | 0 |
| Mode SS | |||
|---|---|---|---|
| Quadrant | BADHDUFLAG | Total packets | Discarded packets |
| A | 0 | 106 | 0 |
| B | 0 | 106 | 0 |
| C | 0 | 106 | 0 |
| D | 0 | 106 | 0 |
| Mode M0 | |||
|---|---|---|---|
| Quadrant | BADHDUFLAG | Total packets | Discarded packets |
| A | 0 | 11852 | 2 |
| B | 0 | 14253 | 1 |
| C | 0 | 12632 | 1 |
| D | 0 | 13379 | 1 |
| Quadrant | Total seconds | Saturated seconds | Saturation percentage |
|---|---|---|---|
| A | 5229 | 10 | 0.191241% |
| B | 5229 | 396 | 7.573150% |
| C | 5229 | 39 | 0.745841% |
| D | 5229 | 117 | 2.237522% |
Noise dominated data is calculated using 1-second bins in cleaned event files. If a bin has >2000 counts, and if more than 50% of those come from <1% of pixels, then it is considered to be noise-dominated and hence unusable.
| Quadrant | # 1 sec bins | Bins with >0 counts | Bins with >2000 counts | High rate bins dominated by noise | Noise dominated (total time) | Noise dominated (detector-on time) | Marked lightcurve |
|---|---|---|---|---|---|---|---|
| A | 7321 | 5230 | 0 | 0 | 0.00% | 0.00% | 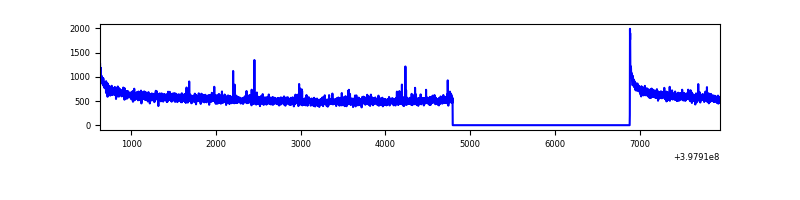 |
| B | 7321 | 5230 | 302 | 302 | 4.13% | 5.77% | 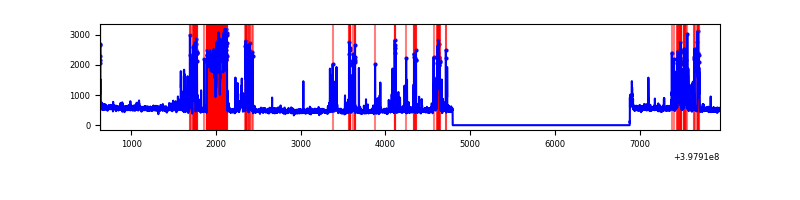 |
| C | 7321 | 5230 | 26 | 26 | 0.36% | 0.50% | 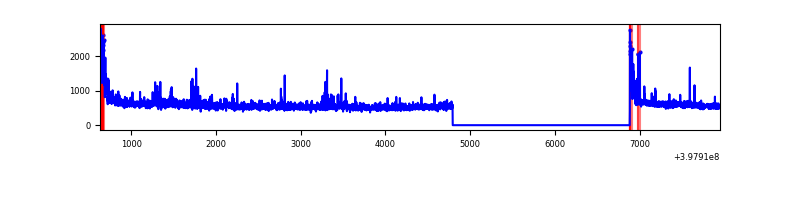 |
| D | 7321 | 5230 | 102 | 102 | 1.39% | 1.95% | 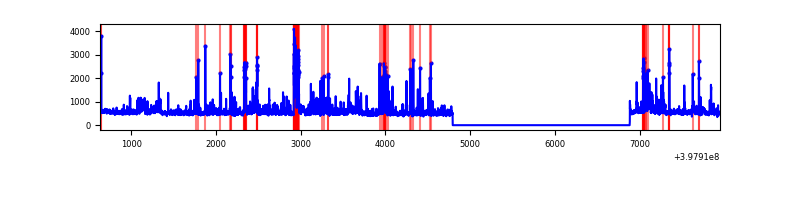 |
Top three noisy pixels from each quadrant. If the there are fewer than three noisy pixels in the level2.evt file, extra rows are filled as -1
| Pixel properties | Quadrant properties | ||||||
|---|---|---|---|---|---|---|---|
| Quadrant | DetID | PixID | Counts | Sigma | Mean | Median | Sigma |
| A | 10 | 83 | 237306 | 1743.44 | 690 | 680 | 135.7 |
| A | 9 | 143 | 21098 | 150.44 | 690 | 680 | 135.7 |
| A | 13 | 254 | 7591 | 50.92 | 690 | 680 | 135.7 |
| B | 5 | 172 | 680883 | 5489.76 | 654 | 639 | 123.9 |
| B | 5 | 184 | 468046 | 3772.11 | 654 | 639 | 123.9 |
| B | 12 | 111 | 14546 | 112.23 | 654 | 639 | 123.9 |
| C | 0 | 10 | 288334 | 1898.98 | 654 | 660 | 151.5 |
| C | 15 | 214 | 243082 | 1600.26 | 654 | 660 | 151.5 |
| C | 14 | 254 | 51994 | 338.86 | 654 | 660 | 151.5 |
| D | 2 | 249 | 356798 | 2249.91 | 659 | 645 | 158.3 |
| D | 12 | 235 | 97686 | 613.03 | 659 | 645 | 158.3 |
| D | 12 | 227 | 94684 | 594.07 | 659 | 645 | 158.3 |
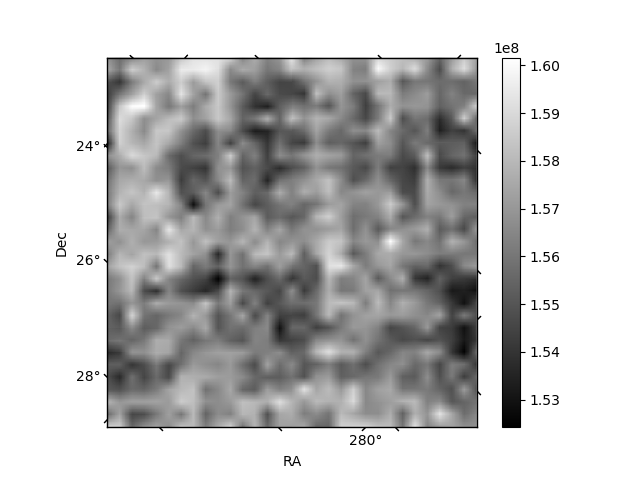
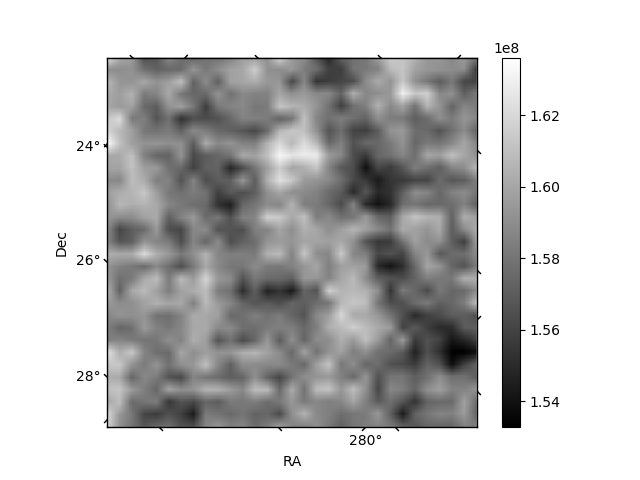
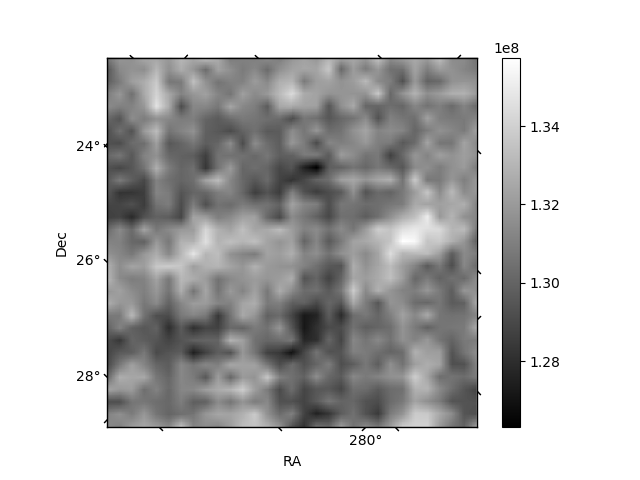
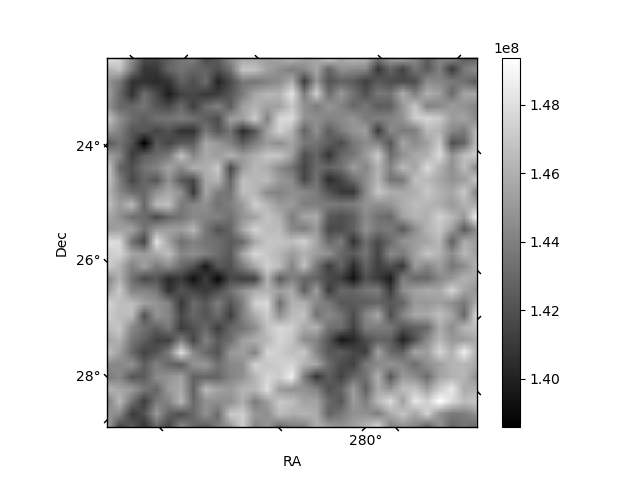
Histogram calculated using DETX and DETY for each event in the final _common_clean file
| Quadrant A | 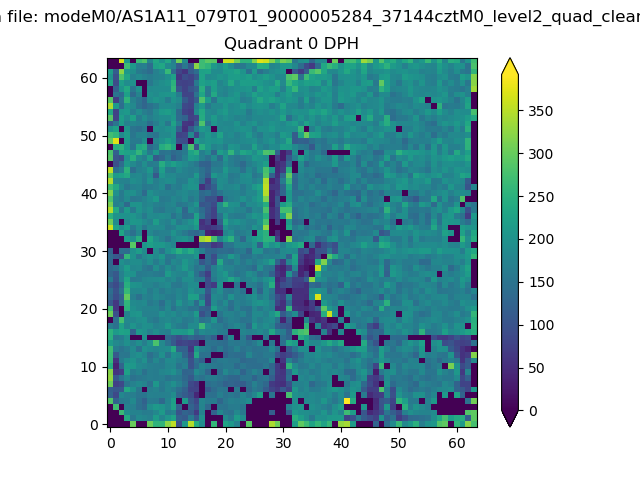 |
 |
Quadrant B |
|---|---|---|---|
| Quadrant D | 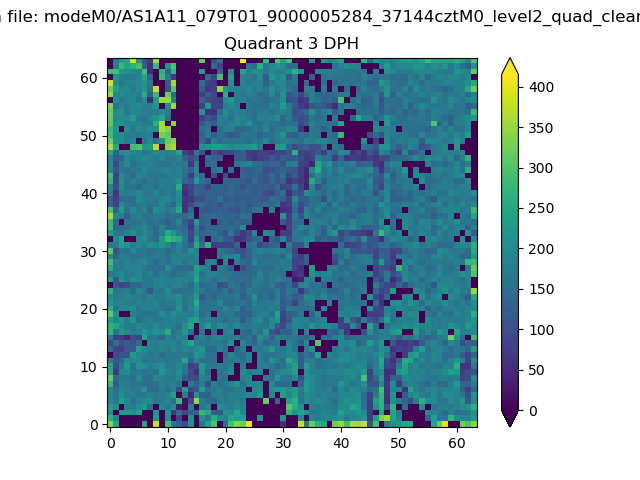 |
 |
Quadrant C |
| Plot type | Count rate plots | Images |
|---|---|---|
| Comparison with Poisson distribution Blue bars denote a histogram of data divided into 1 sec bins. Red curve is a Poisson curve with rate = median count rate of data. |
 |
 |
| Quadrant-wise count rates Data is divided into 100 sec bins |
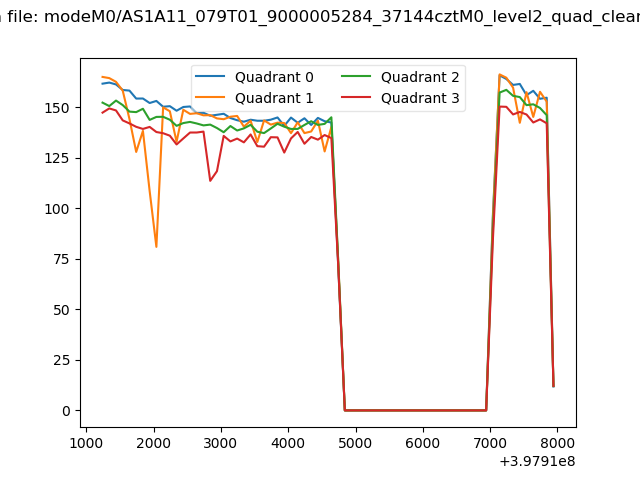 |
|
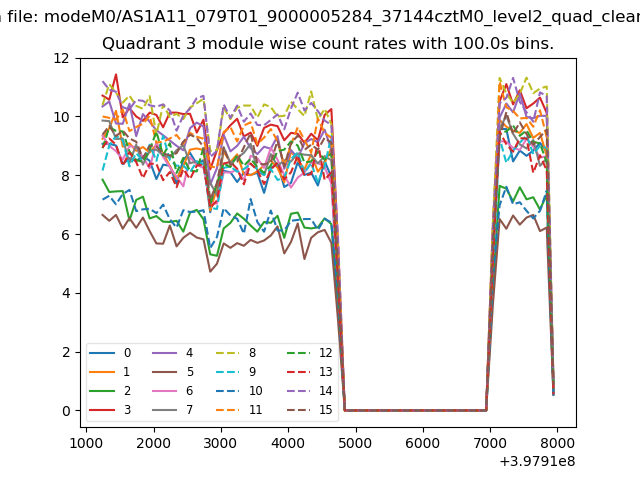
| Module-wise count rates for Quadrant A Data is divided into 100 sec bins |
 |
 |
| Module-wise count rates for Quadrant B Data is divided into 100 sec bins |
 |
 |
| Module-wise count rates for Quadrant C Data is divided into 100 sec bins |
 |
 |
| Module-wise count rates for Quadrant D Data is divided into 100 sec bins |
 |
 |
| Parameter | Plot |
|---|---|
| CZT HV Monitor |  |
| D_VDD | 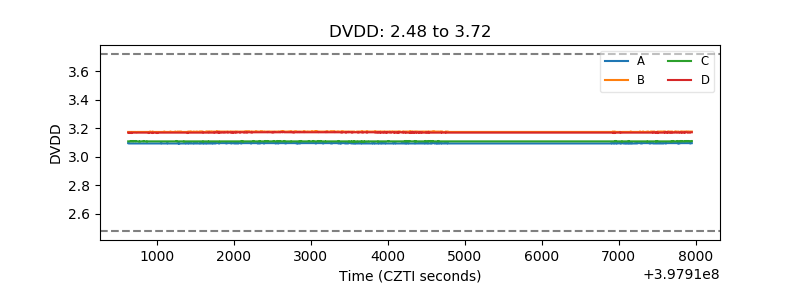 |
| Temperature 1 | 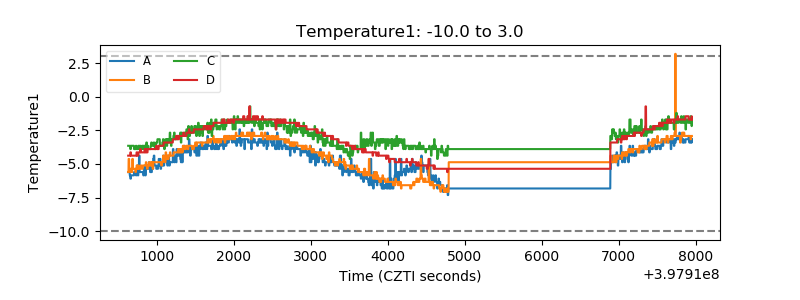 |
| Veto HV Monitor | 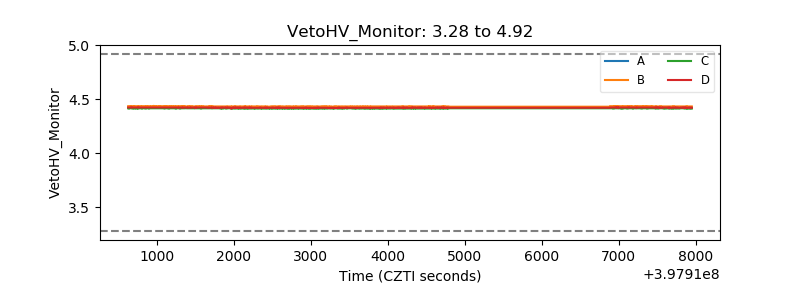 |
| Veto LLD | 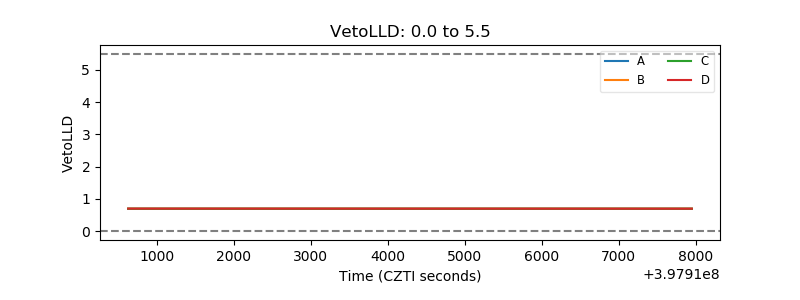 |
| Alpha Counter | 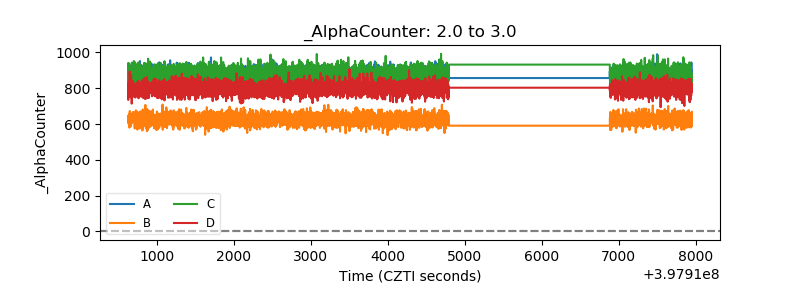 |
| _CPM_Rate | 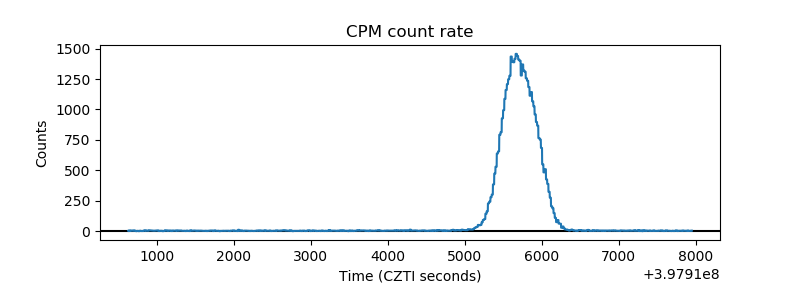 |
| CZT Counter | 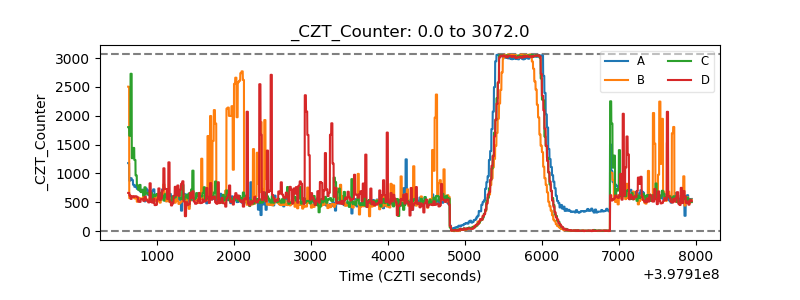 |
| +2.5 Volts monitor | 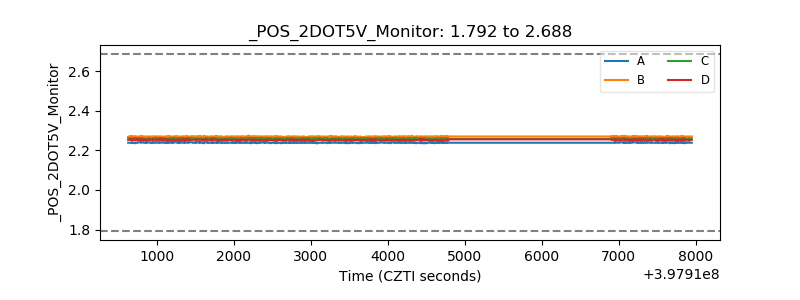 |
| +5 Volts monitor |  |
| _ROLL_ROT | 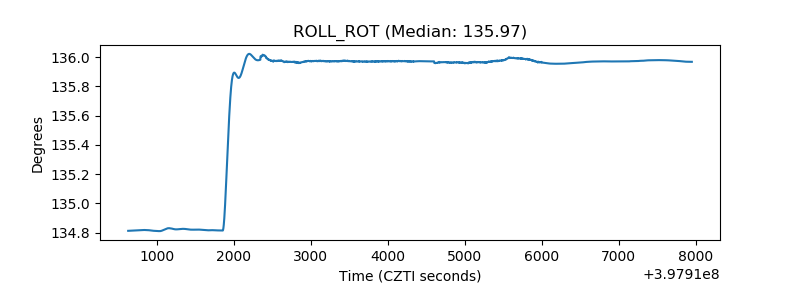 |
| _Roll_DEC | 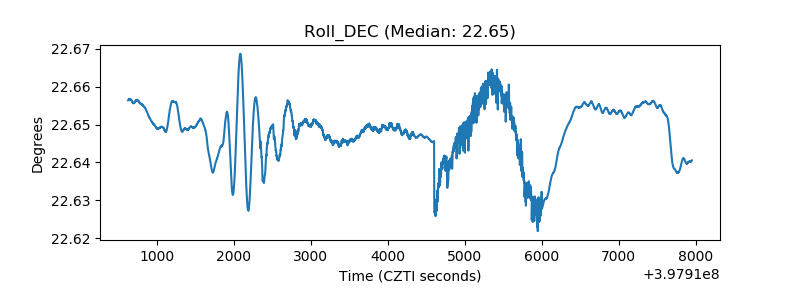 |
| _Roll_RA | 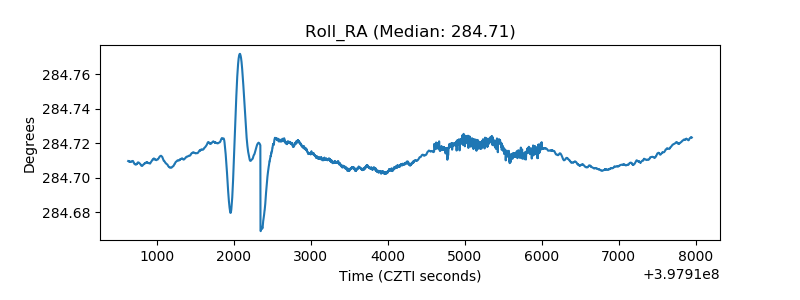 |
| Veto Counter | 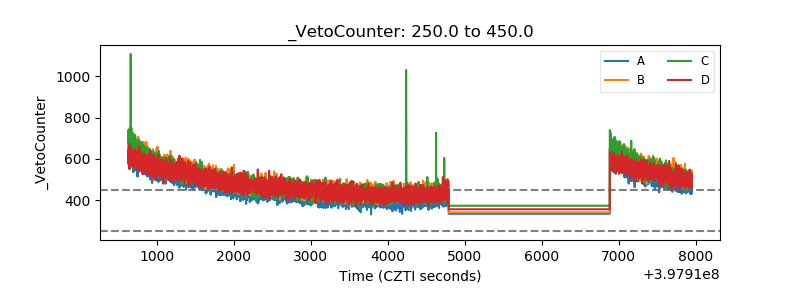 |