| Param | Original file | Final file |
|---|---|---|
| Filename | modeM0/AS1A11_079T01_9000005284_37147cztM0_level2.evt | modeM0/AS1A11_079T01_9000005284_37147cztM0_level2_quad_clean.evt |
| Size (bytes) | 450,296,640 | 75,559,680 |
| Size | 429.4 MB | 72.1 MB |
| Events in quadrant A | 2,666,281 | 498,642 |
| Events in quadrant B | 3,334,269 | 477,919 |
| Events in quadrant C | 3,224,894 | 483,583 |
| Events in quadrant D | 4,055,453 | 459,879 |
| Mode M9 | |||
|---|---|---|---|
| Quadrant | BADHDUFLAG | Total packets | Discarded packets |
| A | 0 | 23 | 0 |
| B | 0 | 23 | 0 |
| C | 0 | 23 | 0 |
| D | 0 | 24 | 0 |
| Mode SS | |||
|---|---|---|---|
| Quadrant | BADHDUFLAG | Total packets | Discarded packets |
| A | 0 | 106 | 0 |
| B | 0 | 106 | 0 |
| C | 0 | 106 | 0 |
| D | 0 | 106 | 0 |
| Mode M0 | |||
|---|---|---|---|
| Quadrant | BADHDUFLAG | Total packets | Discarded packets |
| A | 0 | 11298 | 3 |
| B | 0 | 13355 | 2 |
| C | 0 | 12740 | 2 |
| D | 0 | 15702 | 2 |
| Quadrant | Total seconds | Saturated seconds | Saturation percentage |
|---|---|---|---|
| A | 5255 | 14 | 0.266413% |
| B | 5255 | 275 | 5.233111% |
| C | 5255 | 119 | 2.264510% |
| D | 5255 | 177 | 3.368221% |
Noise dominated data is calculated using 1-second bins in cleaned event files. If a bin has >2000 counts, and if more than 50% of those come from <1% of pixels, then it is considered to be noise-dominated and hence unusable.
| Quadrant | # 1 sec bins | Bins with >0 counts | Bins with >2000 counts | High rate bins dominated by noise | Noise dominated (total time) | Noise dominated (detector-on time) | Marked lightcurve |
|---|---|---|---|---|---|---|---|
| A | 7137 | 5256 | 6 | 6 | 0.08% | 0.11% | 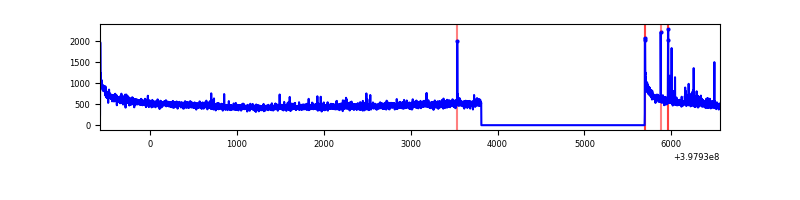 |
| B | 7137 | 5256 | 241 | 241 | 3.38% | 4.59% | 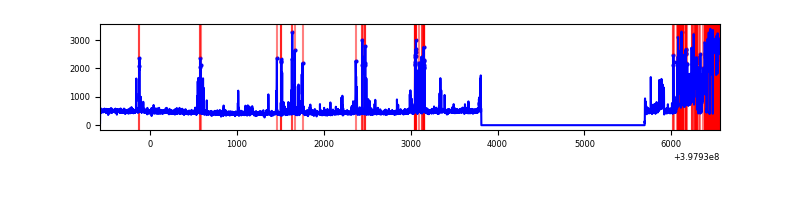 |
| C | 7137 | 5256 | 80 | 80 | 1.12% | 1.52% | 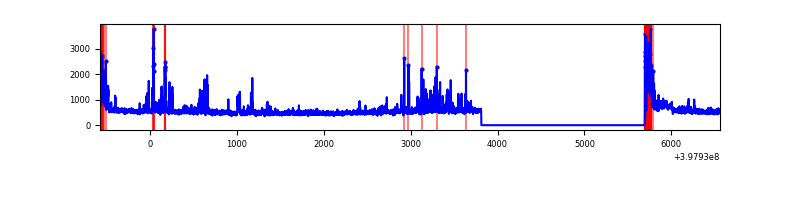 |
| D | 7137 | 5256 | 167 | 167 | 2.34% | 3.18% | 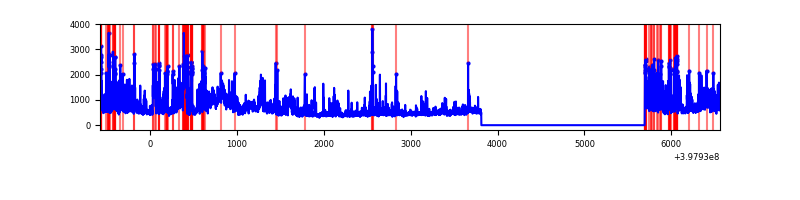 |
Top three noisy pixels from each quadrant. If the there are fewer than three noisy pixels in the level2.evt file, extra rows are filled as -1
| Pixel properties | Quadrant properties | ||||||
|---|---|---|---|---|---|---|---|
| Quadrant | DetID | PixID | Counts | Sigma | Mean | Median | Sigma |
| A | 10 | 83 | 260075 | 2109.17 | 609 | 598 | 123.0 |
| A | 13 | 248 | 33460 | 267.12 | 609 | 598 | 123.0 |
| A | 13 | 254 | 9042 | 68.64 | 609 | 598 | 123.0 |
| B | 0 | 182 | 537482 | 4700.61 | 586 | 570 | 114.2 |
| B | 5 | 172 | 222436 | 1942.41 | 586 | 570 | 114.2 |
| B | 5 | 255 | 158229 | 1380.29 | 586 | 570 | 114.2 |
| C | 0 | 10 | 320874 | 2316.42 | 589 | 594 | 138.3 |
| C | 14 | 254 | 253993 | 1832.7 | 589 | 594 | 138.3 |
| C | 15 | 214 | 242981 | 1753.06 | 589 | 594 | 138.3 |
| D | 10 | 253 | 792571 | 5547.94 | 587 | 572 | 142.8 |
| D | 2 | 249 | 336206 | 2351.11 | 587 | 572 | 142.8 |
| D | 12 | 233 | 211047 | 1474.37 | 587 | 572 | 142.8 |
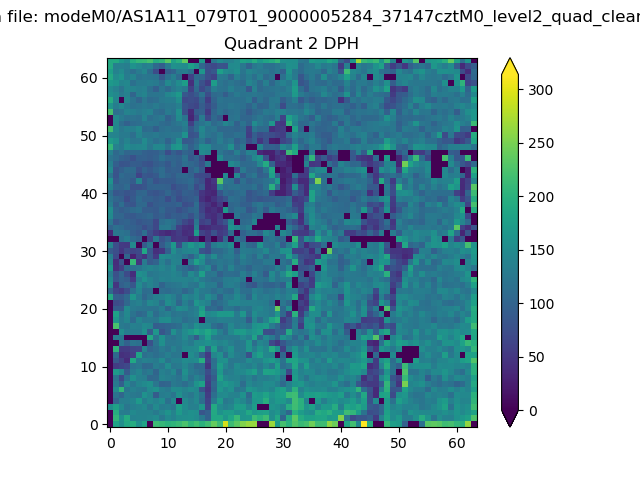
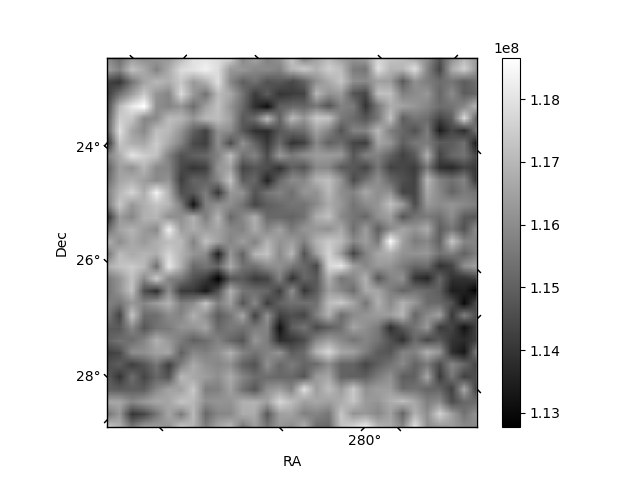
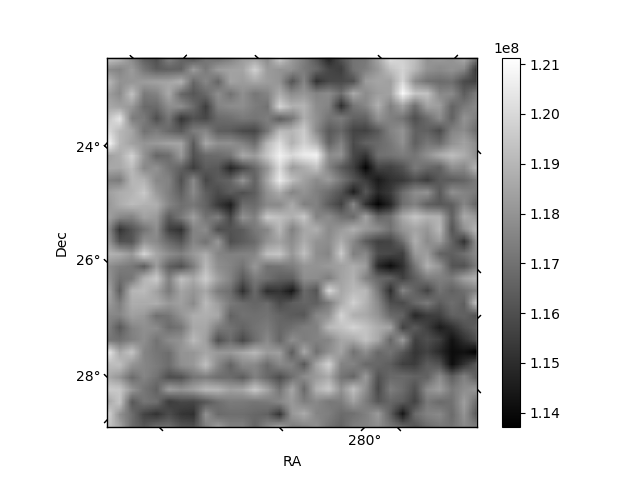
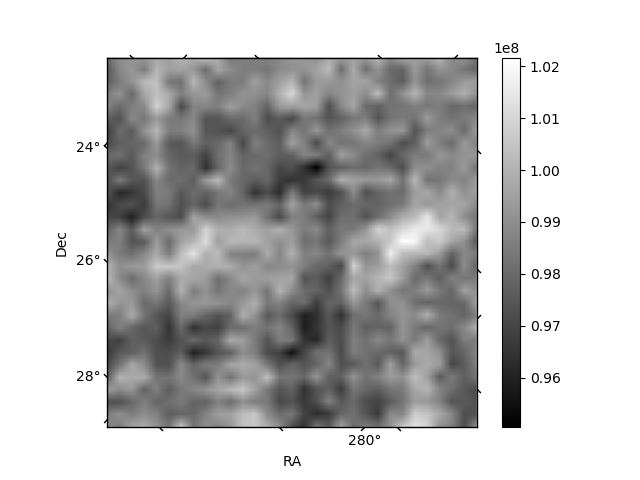
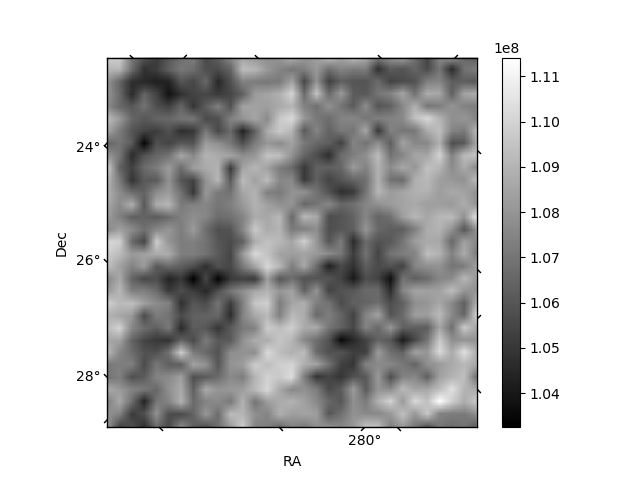
Histogram calculated using DETX and DETY for each event in the final _common_clean file
| Quadrant A | 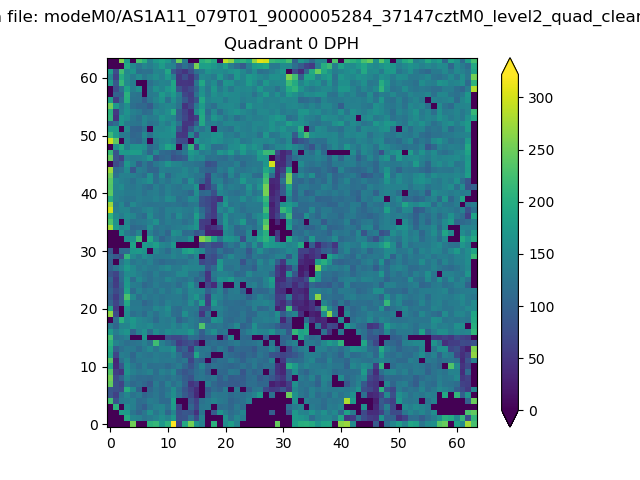 |
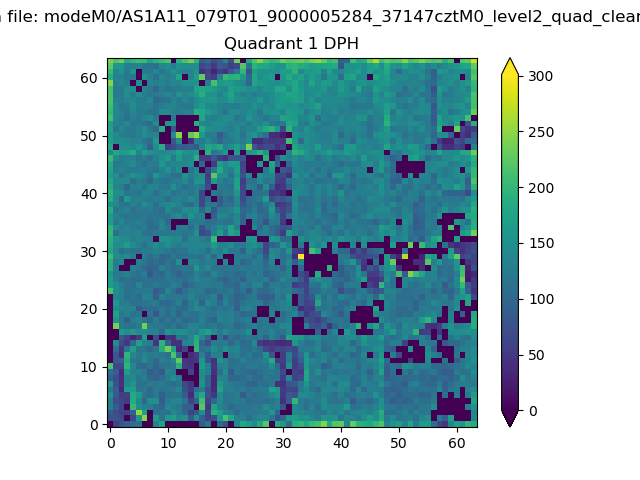 |
Quadrant B |
|---|---|---|---|
| Quadrant D | 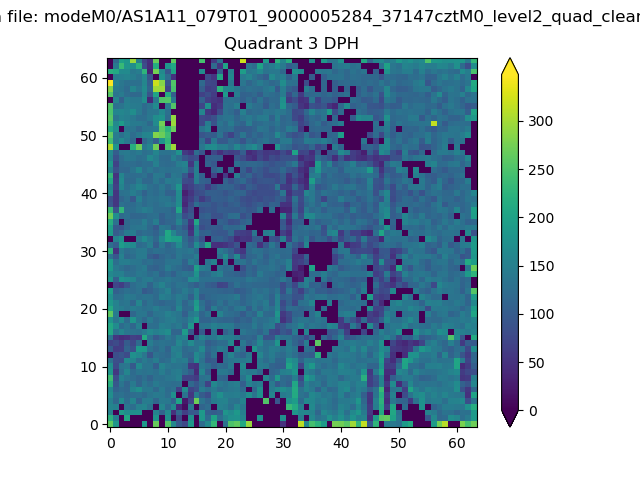 |
 |
Quadrant C |
| Plot type | Count rate plots | Images |
|---|---|---|
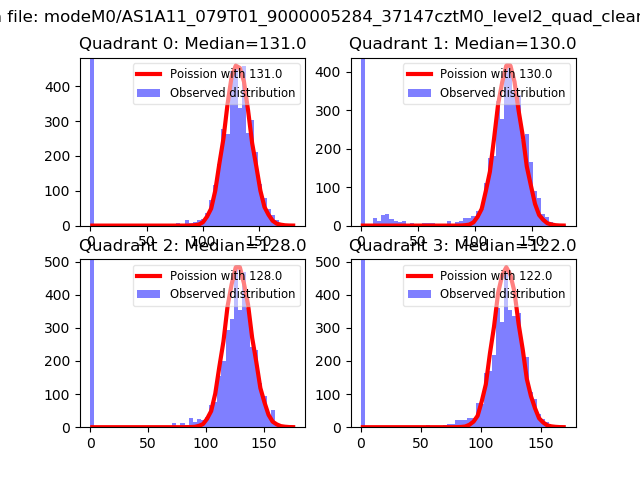
| Comparison with Poisson distribution Blue bars denote a histogram of data divided into 1 sec bins. Red curve is a Poisson curve with rate = median count rate of data. |
 |
 |
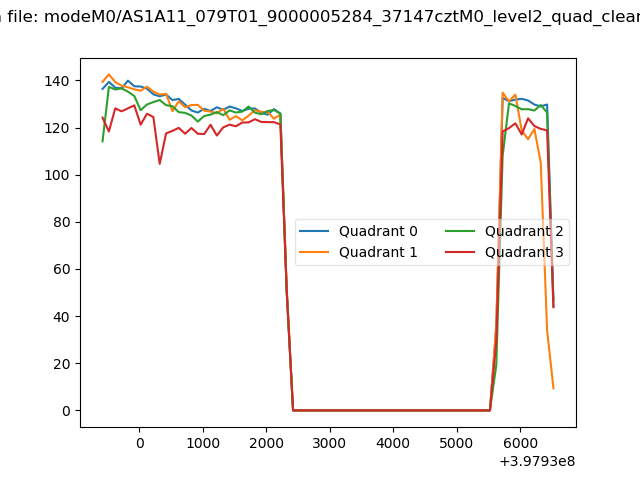
| Quadrant-wise count rates Data is divided into 100 sec bins |
 |
|
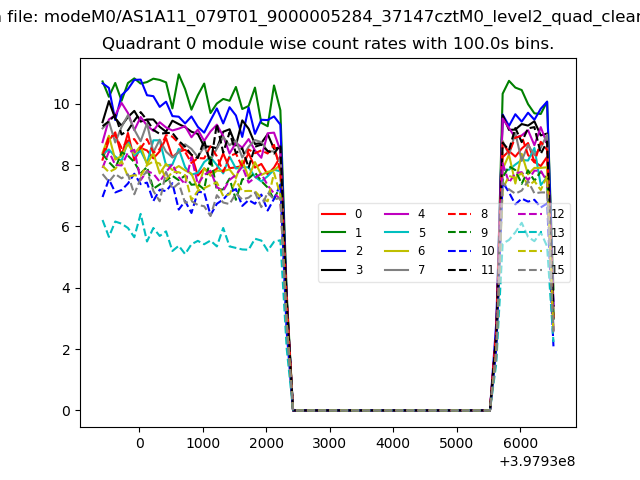
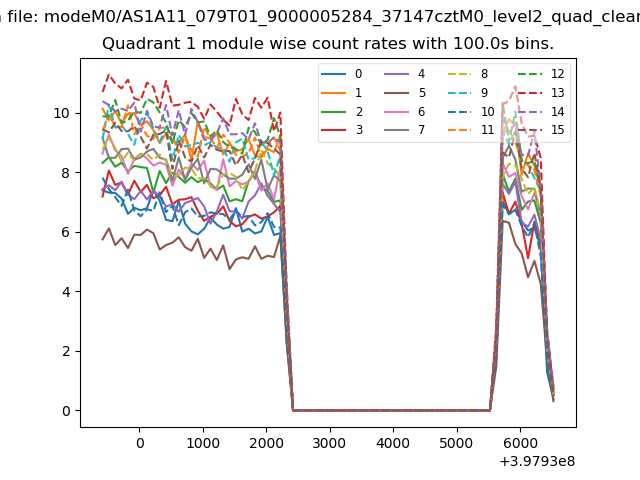
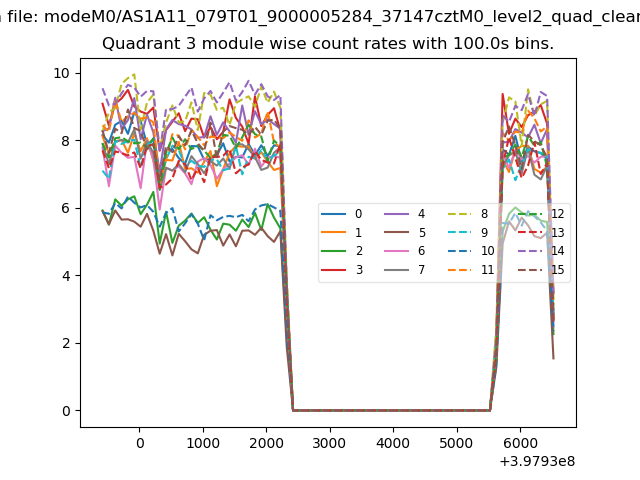
| Module-wise count rates for Quadrant A Data is divided into 100 sec bins |
 |
 |
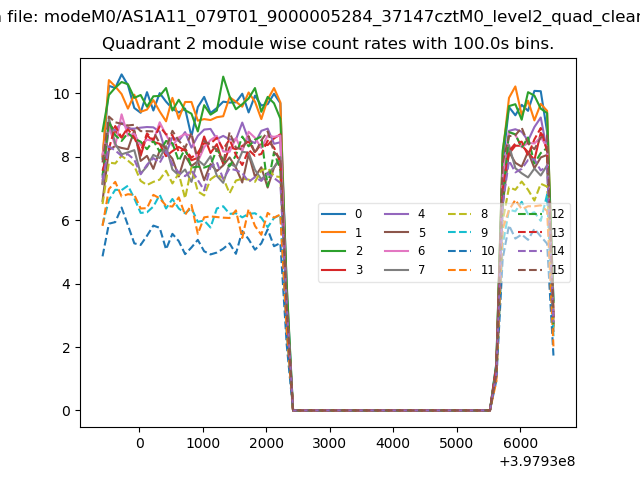
| Module-wise count rates for Quadrant B Data is divided into 100 sec bins |
 |
 |
| Module-wise count rates for Quadrant C Data is divided into 100 sec bins |
 |
 |
| Module-wise count rates for Quadrant D Data is divided into 100 sec bins |
 |
 |
| Parameter | Plot |
|---|---|
| CZT HV Monitor | 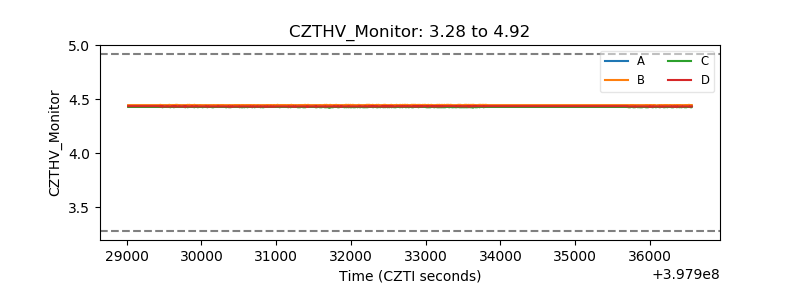 |
| D_VDD | 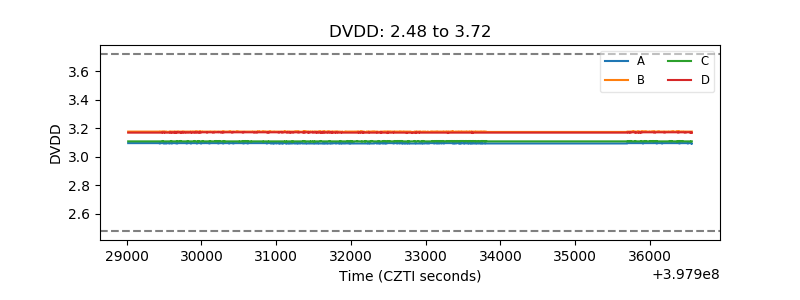 |
| Temperature 1 | 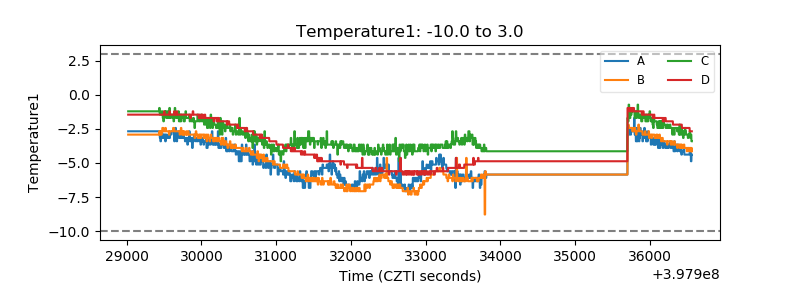 |
| Veto HV Monitor |  |
| Veto LLD | 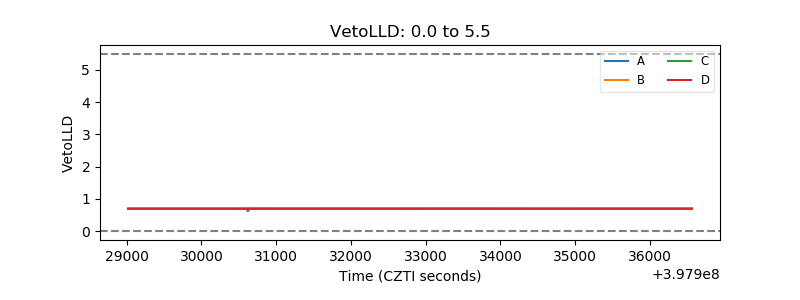 |
| Alpha Counter | 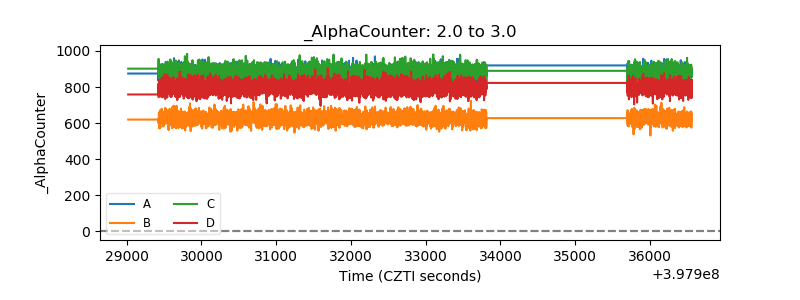 |
| _CPM_Rate | 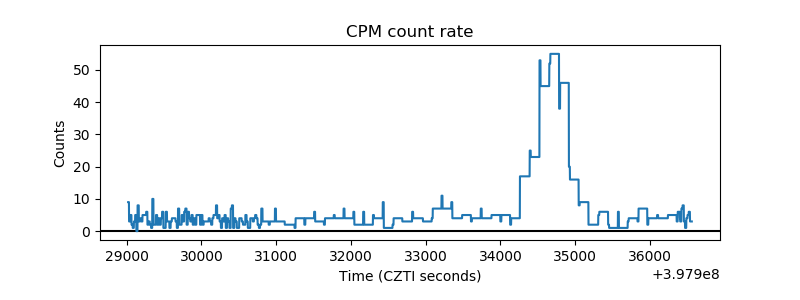 |
| CZT Counter | 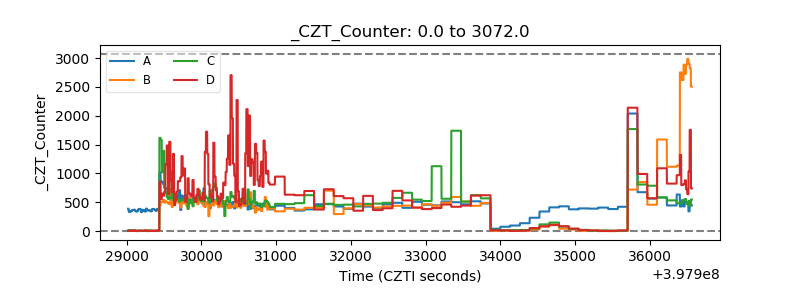 |
| +2.5 Volts monitor | 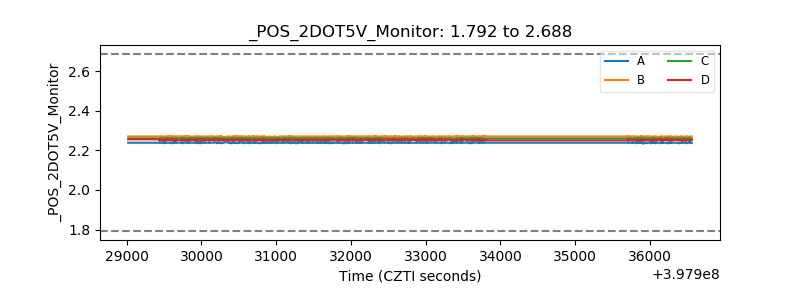 |
| +5 Volts monitor | 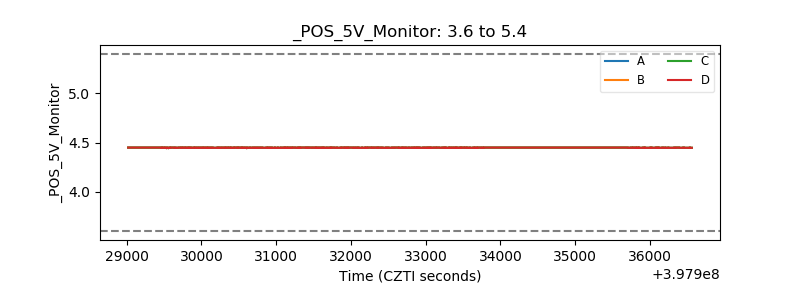 |
| _ROLL_ROT | 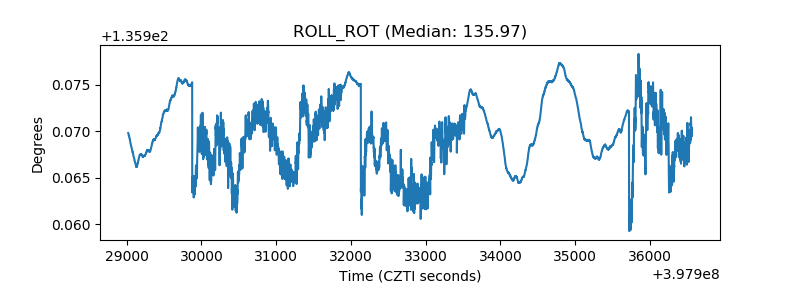 |
| _Roll_DEC | 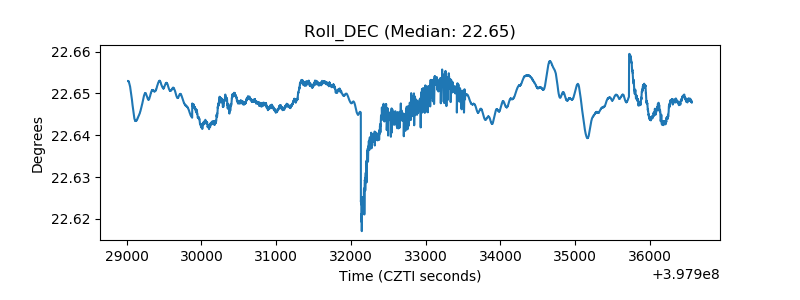 |
| _Roll_RA | 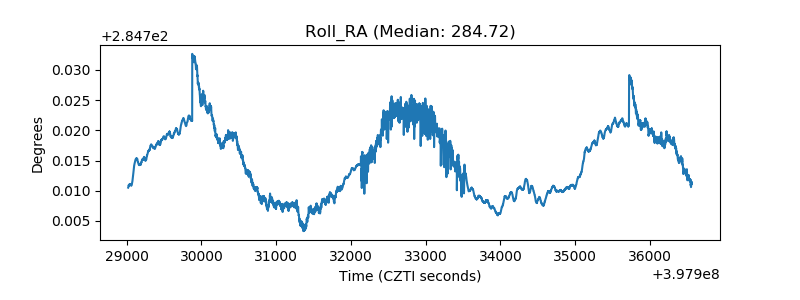 |
| Veto Counter | 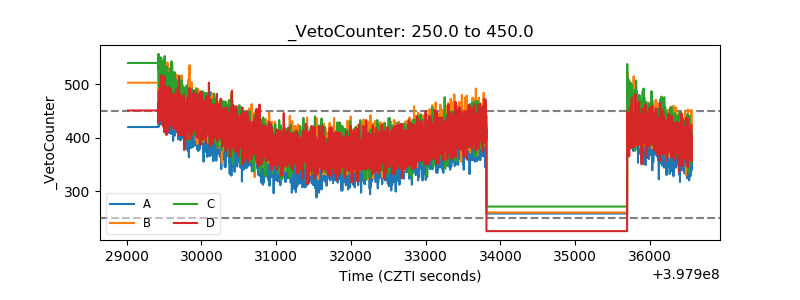 |