| Param | Original file | Final file |
|---|---|---|
| Filename | modeM0/AS1A11_079T01_9000005284_37148cztM0_level2.evt | modeM0/AS1A11_079T01_9000005284_37148cztM0_level2_quad_clean.evt |
| Size (bytes) | 476,248,320 | 65,053,440 |
| Size | 454.2 MB | 62.0 MB |
| Events in quadrant A | 2,781,134 | 414,980 |
| Events in quadrant B | 3,895,113 | 382,231 |
| Events in quadrant C | 3,127,101 | 405,164 |
| Events in quadrant D | 4,246,604 | 382,137 |
| Mode M9 | |||
|---|---|---|---|
| Quadrant | BADHDUFLAG | Total packets | Discarded packets |
| A | 0 | 27 | 0 |
| B | 0 | 27 | 0 |
| C | 0 | 27 | 0 |
| D | 0 | 28 | 0 |
| Mode SS | |||
|---|---|---|---|
| Quadrant | BADHDUFLAG | Total packets | Discarded packets |
| A | 0 | 112 | 0 |
| B | 0 | 112 | 0 |
| C | 0 | 112 | 0 |
| D | 0 | 112 | 0 |
| Mode M0 | |||
|---|---|---|---|
| Quadrant | BADHDUFLAG | Total packets | Discarded packets |
| A | 0 | 11873 | 3 |
| B | 0 | 15297 | 2 |
| C | 0 | 12521 | 2 |
| D | 0 | 16342 | 2 |
| Quadrant | Total seconds | Saturated seconds | Saturation percentage |
|---|---|---|---|
| A | 5501 | 24 | 0.436284% |
| B | 5501 | 418 | 7.598618% |
| C | 5501 | 90 | 1.636066% |
| D | 5501 | 187 | 3.399382% |
Noise dominated data is calculated using 1-second bins in cleaned event files. If a bin has >2000 counts, and if more than 50% of those come from <1% of pixels, then it is considered to be noise-dominated and hence unusable.
| Quadrant | # 1 sec bins | Bins with >0 counts | Bins with >2000 counts | High rate bins dominated by noise | Noise dominated (total time) | Noise dominated (detector-on time) | Marked lightcurve |
|---|---|---|---|---|---|---|---|
| A | 7053 | 5502 | 16 | 16 | 0.23% | 0.29% | 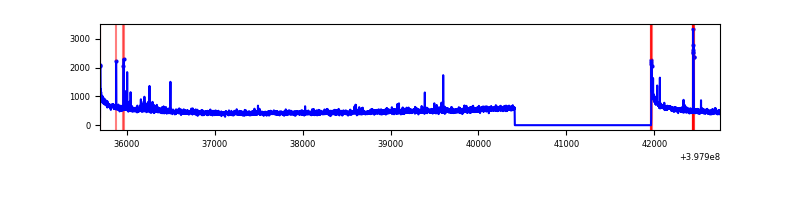 |
| B | 7053 | 5502 | 365 | 365 | 5.18% | 6.63% | 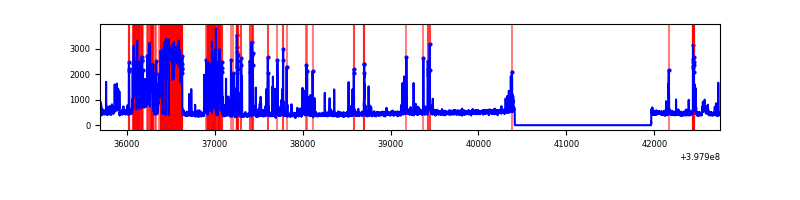 |
| C | 7053 | 5502 | 62 | 62 | 0.88% | 1.13% | 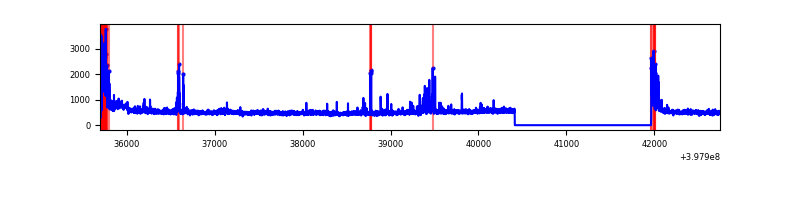 |
| D | 7053 | 5502 | 243 | 243 | 3.45% | 4.42% | 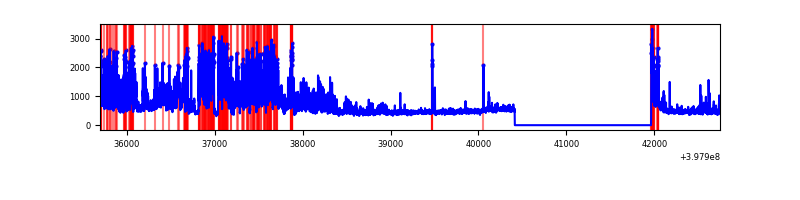 |
Top three noisy pixels from each quadrant. If the there are fewer than three noisy pixels in the level2.evt file, extra rows are filled as -1
| Pixel properties | Quadrant properties | ||||||
|---|---|---|---|---|---|---|---|
| Quadrant | DetID | PixID | Counts | Sigma | Mean | Median | Sigma |
| A | 10 | 83 | 265443 | 2095.37 | 627 | 615 | 126.4 |
| A | 13 | 248 | 35230 | 273.88 | 627 | 615 | 126.4 |
| A | 15 | 174 | 18998 | 145.45 | 627 | 615 | 126.4 |
| B | 0 | 182 | 757490 | 6507.94 | 598 | 580 | 116.3 |
| B | 5 | 172 | 505352 | 4340.05 | 598 | 580 | 116.3 |
| B | 5 | 255 | 200591 | 1719.7 | 598 | 580 | 116.3 |
| C | 0 | 10 | 300723 | 2107.18 | 607 | 612 | 142.4 |
| C | 15 | 214 | 251142 | 1759.05 | 607 | 612 | 142.4 |
| C | 0 | 207 | 131940 | 922.1 | 607 | 612 | 142.4 |
| D | 12 | 235 | 1065151 | 7273.97 | 604 | 590 | 146.4 |
| D | 2 | 249 | 478977 | 3268.74 | 604 | 590 | 146.4 |
| D | 12 | 233 | 209773 | 1429.31 | 604 | 590 | 146.4 |
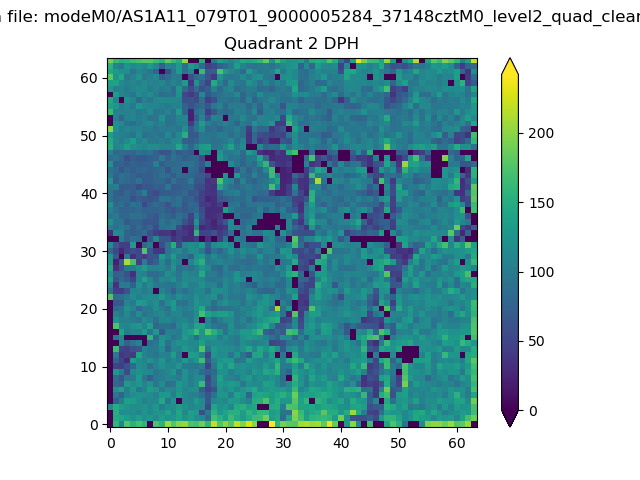
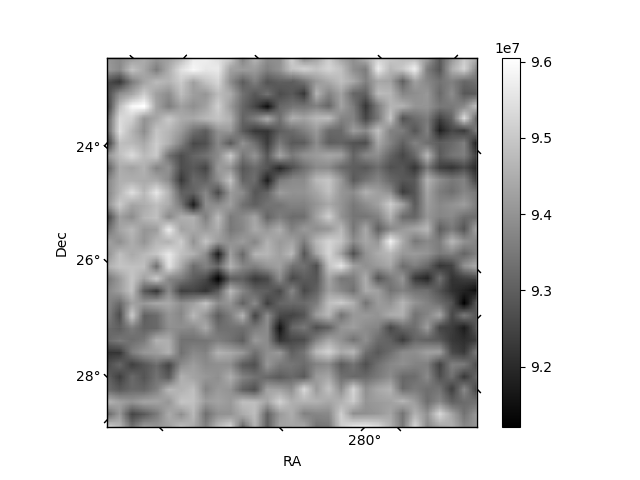
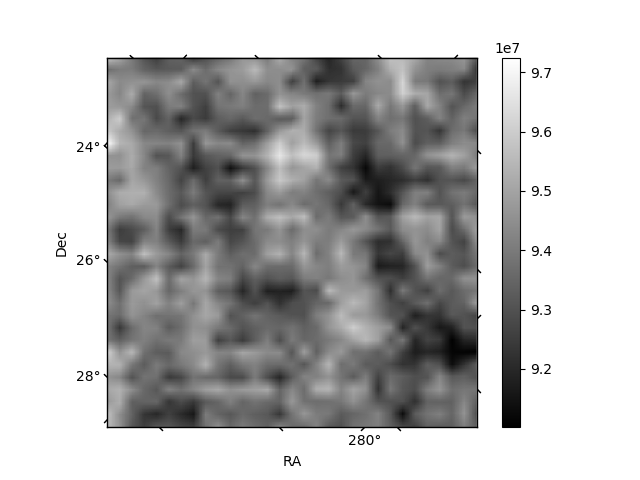
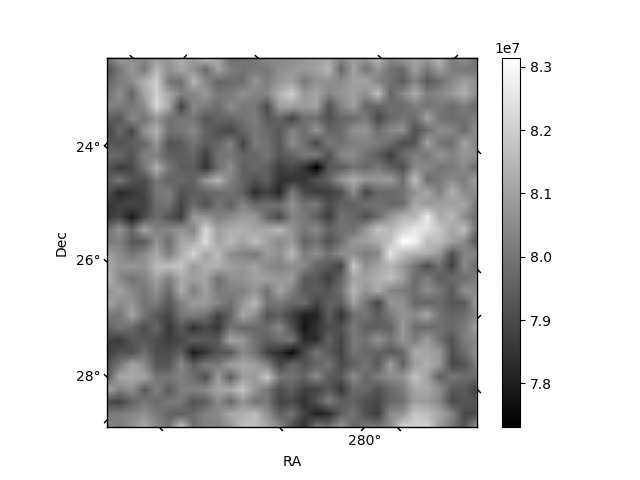
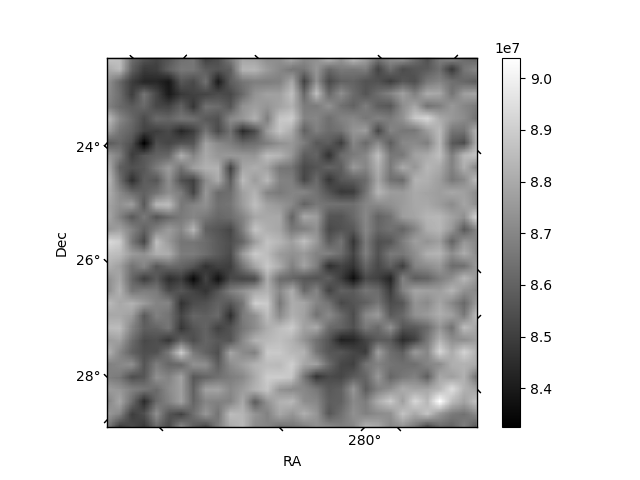
Histogram calculated using DETX and DETY for each event in the final _common_clean file
| Quadrant A | 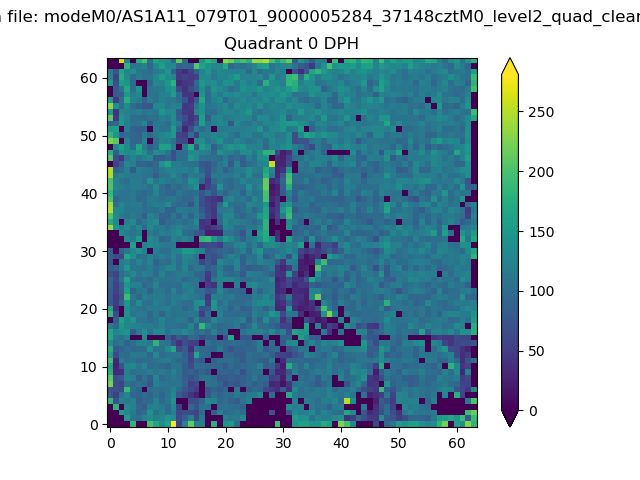 |
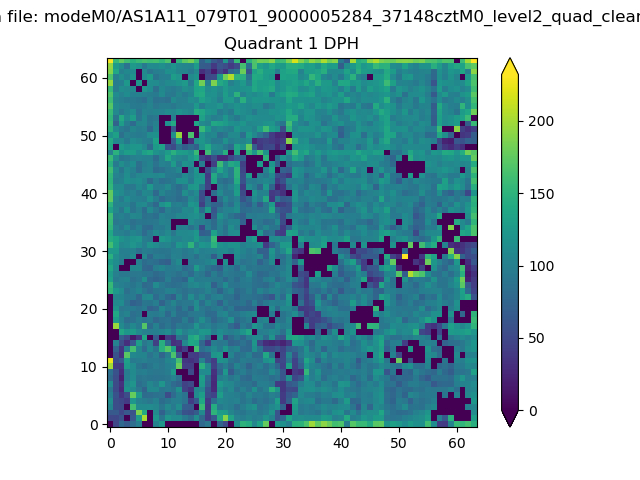 |
Quadrant B |
|---|---|---|---|
| Quadrant D | 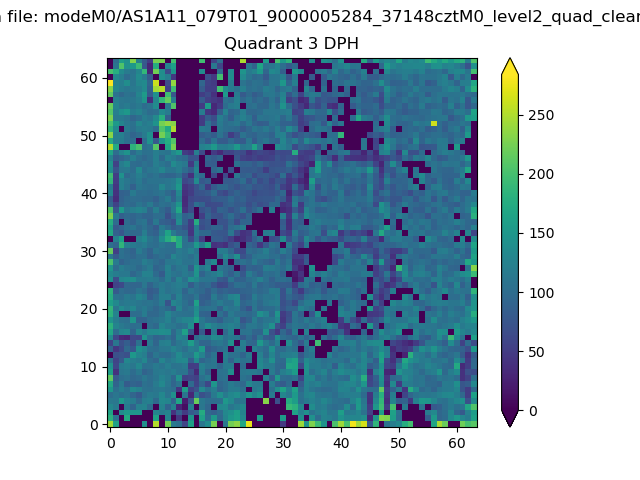 |
 |
Quadrant C |
| Plot type | Count rate plots | Images |
|---|---|---|
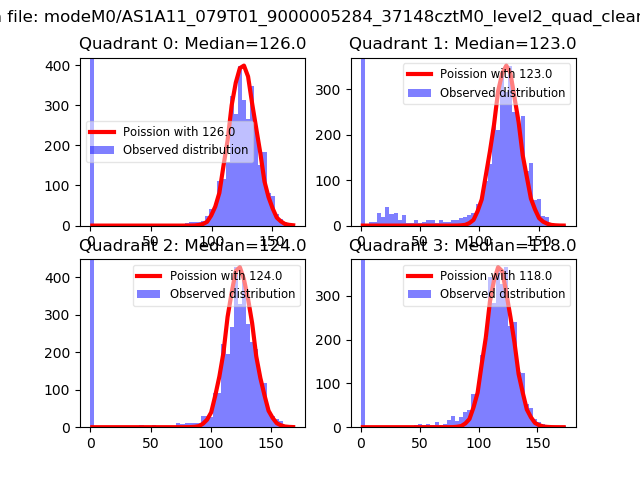
| Comparison with Poisson distribution Blue bars denote a histogram of data divided into 1 sec bins. Red curve is a Poisson curve with rate = median count rate of data. |
 |
 |
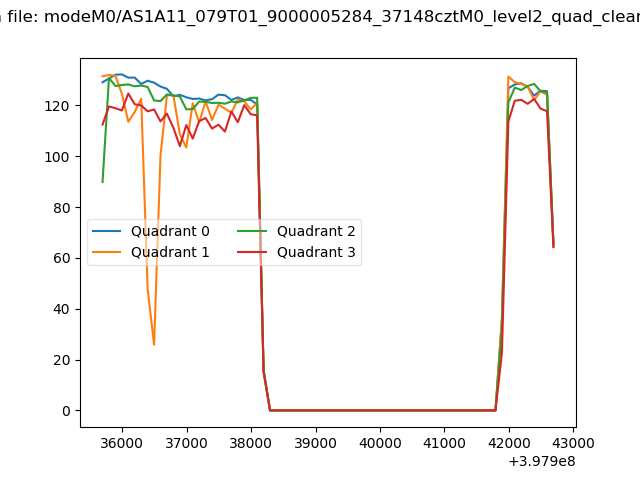
| Quadrant-wise count rates Data is divided into 100 sec bins |
 |
|
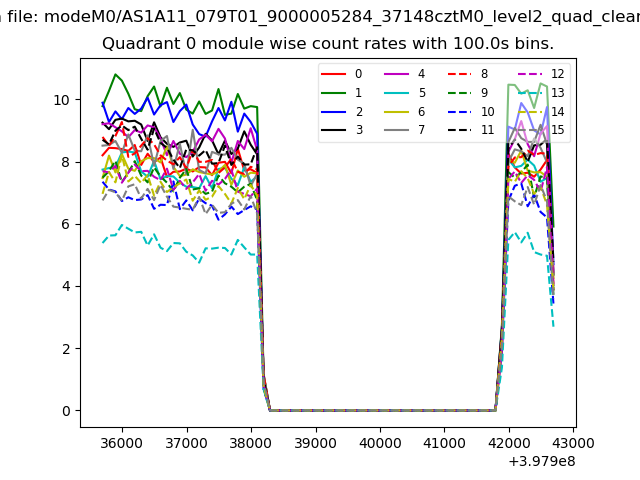
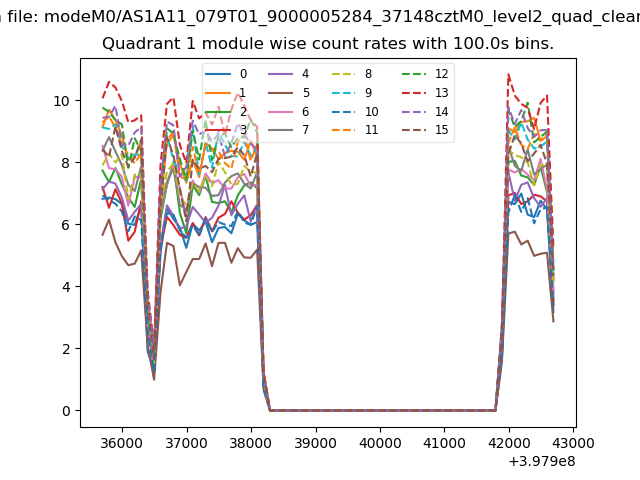
| Module-wise count rates for Quadrant A Data is divided into 100 sec bins |
 |
 |
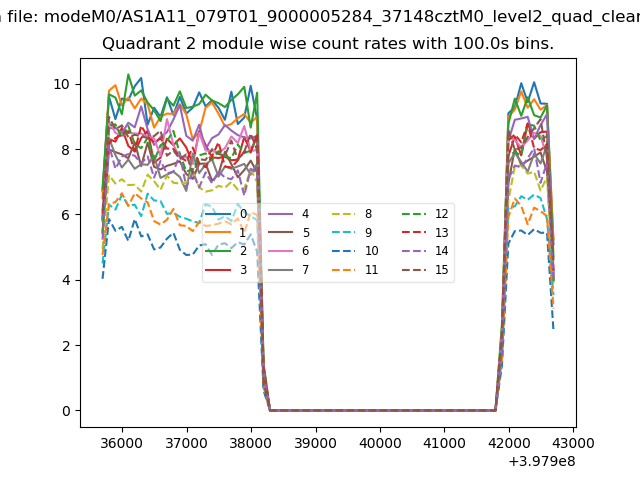
| Module-wise count rates for Quadrant B Data is divided into 100 sec bins |
 |
 |
| Module-wise count rates for Quadrant C Data is divided into 100 sec bins |
 |
 |
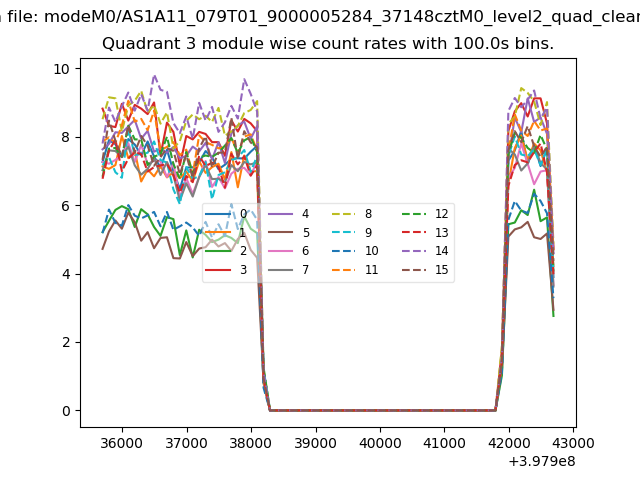
| Module-wise count rates for Quadrant D Data is divided into 100 sec bins |
 |
 |
| Parameter | Plot |
|---|---|
| CZT HV Monitor | 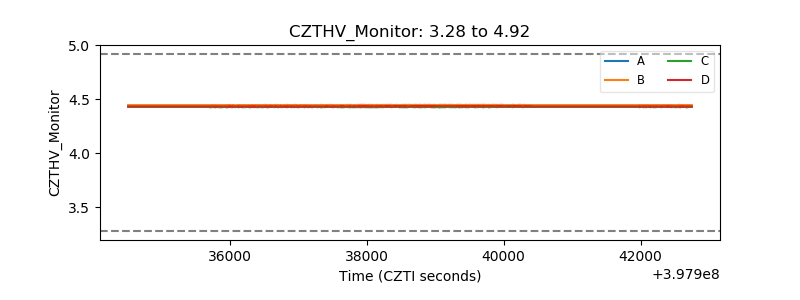 |
| D_VDD | 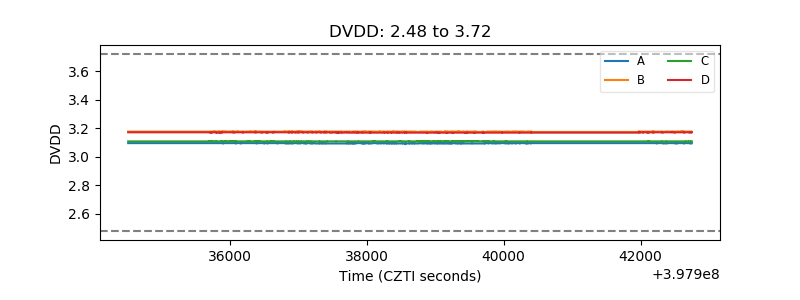 |
| Temperature 1 | 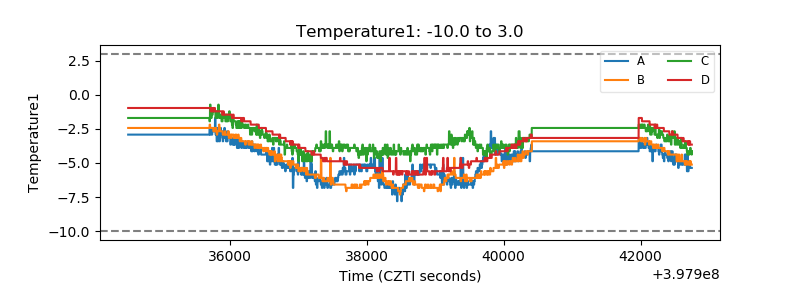 |
| Veto HV Monitor | 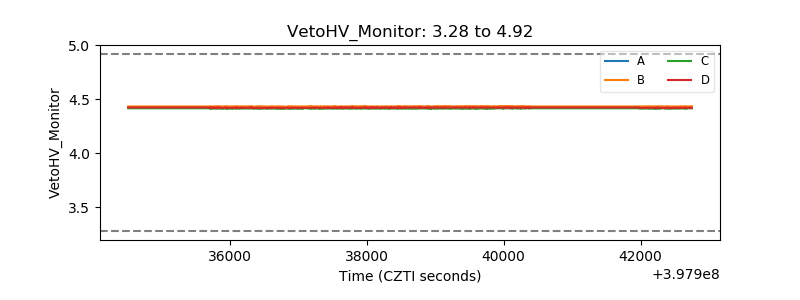 |
| Veto LLD | 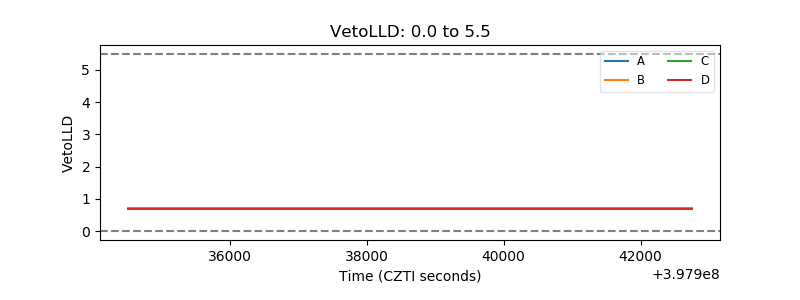 |
| Alpha Counter | 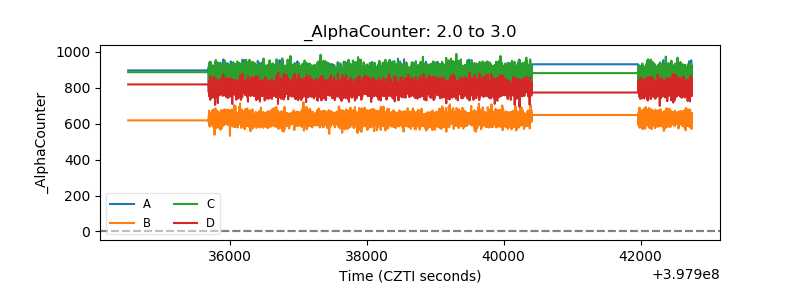 |
| _CPM_Rate | 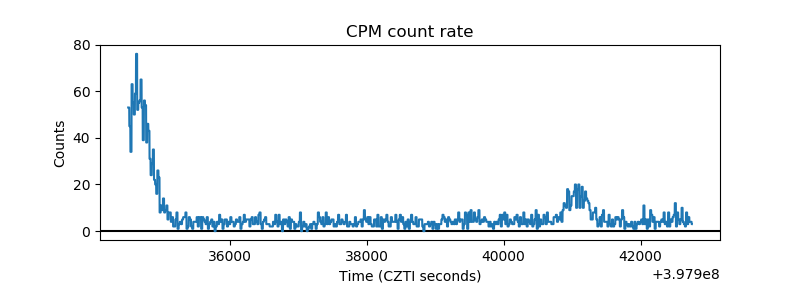 |
| CZT Counter | 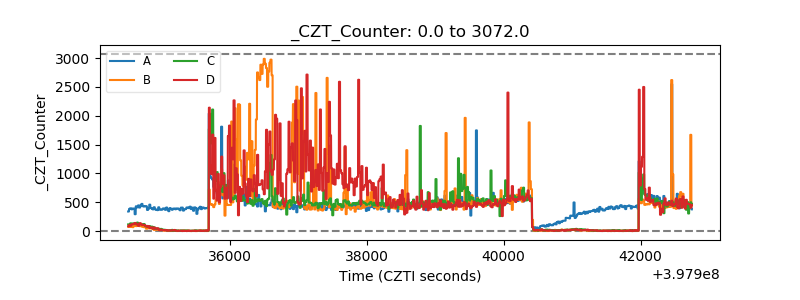 |
| +2.5 Volts monitor |  |
| +5 Volts monitor | 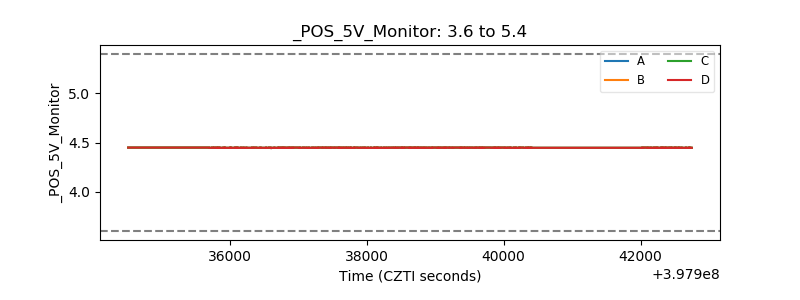 |
| _ROLL_ROT | 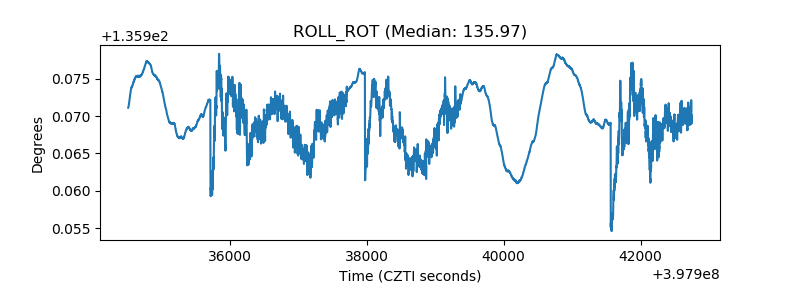 |
| _Roll_DEC | 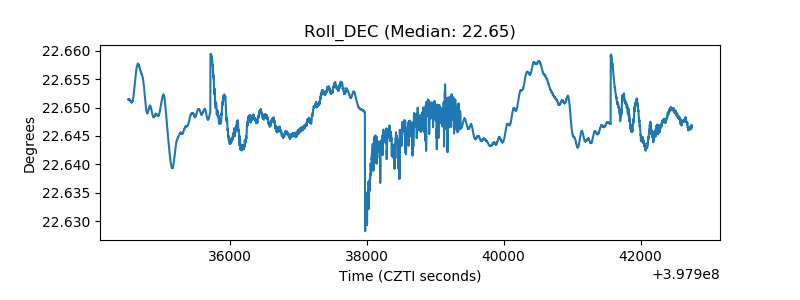 |
| _Roll_RA | 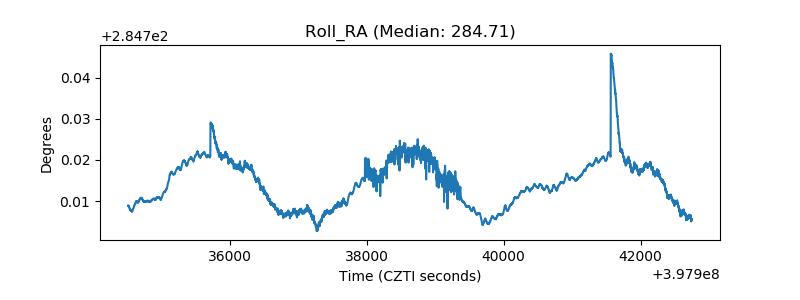 |
| Veto Counter | 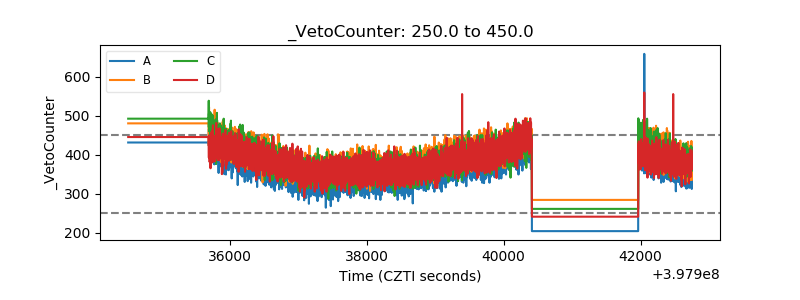 |