| Param | Original file | Final file |
|---|---|---|
| Filename | modeM0/AS1A11_079T01_9000005284_37149cztM0_level2.evt | modeM0/AS1A11_079T01_9000005284_37149cztM0_level2_quad_clean.evt |
| Size (bytes) | 426,012,480 | 72,650,880 |
| Size | 406.3 MB | 69.3 MB |
| Events in quadrant A | 2,917,272 | 456,695 |
| Events in quadrant B | 3,026,849 | 454,268 |
| Events in quadrant C | 3,048,055 | 451,045 |
| Events in quadrant D | 3,510,906 | 427,925 |
| Mode M9 | |||
|---|---|---|---|
| Quadrant | BADHDUFLAG | Total packets | Discarded packets |
| A | 0 | 24 | 0 |
| B | 0 | 24 | 0 |
| C | 0 | 24 | 0 |
| D | 0 | 25 | 0 |
| Mode SS | |||
|---|---|---|---|
| Quadrant | BADHDUFLAG | Total packets | Discarded packets |
| A | 0 | 118 | 0 |
| B | 0 | 118 | 0 |
| C | 0 | 118 | 0 |
| D | 0 | 118 | 0 |
| Mode M0 | |||
|---|---|---|---|
| Quadrant | BADHDUFLAG | Total packets | Discarded packets |
| A | 0 | 12531 | 3 |
| B | 0 | 12969 | 2 |
| C | 0 | 12678 | 2 |
| D | 0 | 14542 | 2 |
| Quadrant | Total seconds | Saturated seconds | Saturation percentage |
|---|---|---|---|
| A | 5869 | 25 | 0.425967% |
| B | 5869 | 81 | 1.380133% |
| C | 5869 | 23 | 0.391890% |
| D | 5869 | 176 | 2.998807% |
Noise dominated data is calculated using 1-second bins in cleaned event files. If a bin has >2000 counts, and if more than 50% of those come from <1% of pixels, then it is considered to be noise-dominated and hence unusable.
| Quadrant | # 1 sec bins | Bins with >0 counts | Bins with >2000 counts | High rate bins dominated by noise | Noise dominated (total time) | Noise dominated (detector-on time) | Marked lightcurve |
|---|---|---|---|---|---|---|---|
| A | 7212 | 5870 | 20 | 20 | 0.28% | 0.34% | 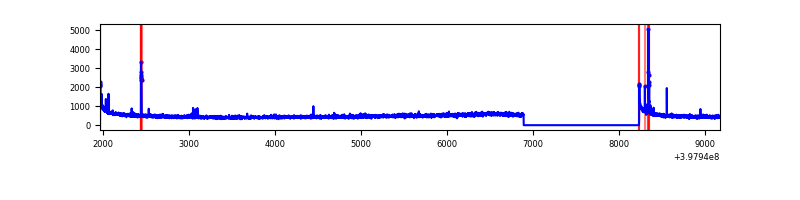 |
| B | 7212 | 5870 | 58 | 58 | 0.80% | 0.99% | 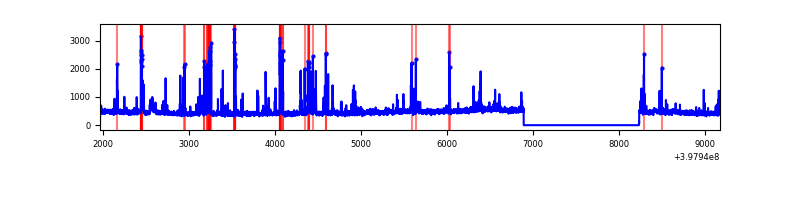 |
| C | 7212 | 5870 | 14 | 14 | 0.19% | 0.24% | 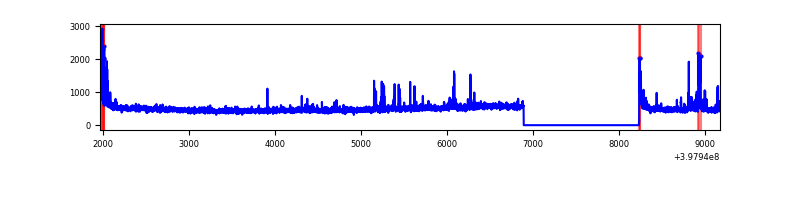 |
| D | 7212 | 5870 | 159 | 159 | 2.20% | 2.71% | 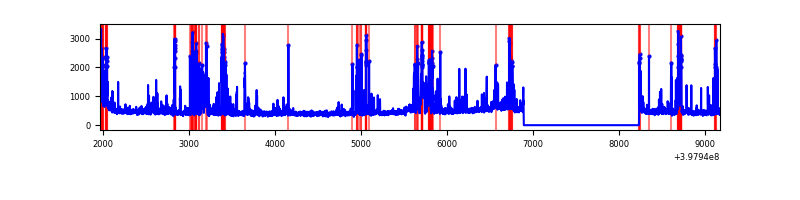 |
Top three noisy pixels from each quadrant. If the there are fewer than three noisy pixels in the level2.evt file, extra rows are filled as -1
| Pixel properties | Quadrant properties | ||||||
|---|---|---|---|---|---|---|---|
| Quadrant | DetID | PixID | Counts | Sigma | Mean | Median | Sigma |
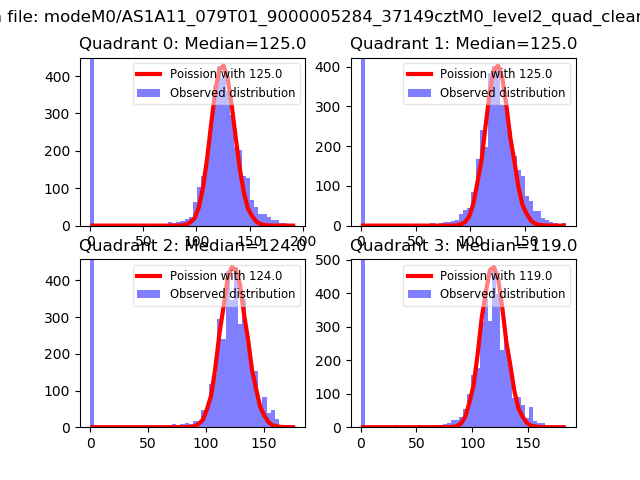
| A | 10 | 83 | 272060 | 2032.55 | 663 | 651 | 133.5 |
| A | 15 | 237 | 32236 | 236.54 | 663 | 651 | 133.5 |
| A | 15 | 174 | 18532 | 133.91 | 663 | 651 | 133.5 |
| B | 5 | 172 | 315665 | 2496.2 | 656 | 640 | 126.2 |
| B | 0 | 182 | 79087 | 621.6 | 656 | 640 | 126.2 |
| B | 5 | 200 | 18844 | 144.25 | 656 | 640 | 126.2 |
| C | 15 | 214 | 271662 | 1786.05 | 648 | 655 | 151.7 |
| C | 0 | 10 | 121221 | 794.58 | 648 | 655 | 151.7 |
| C | 15 | 159 | 51366 | 334.21 | 648 | 655 | 151.7 |
| D | 2 | 249 | 484920 | 3091.32 | 641 | 623 | 156.7 |
| D | 2 | 250 | 276135 | 1758.62 | 641 | 623 | 156.7 |
| D | 10 | 118 | 64101 | 405.19 | 641 | 623 | 156.7 |
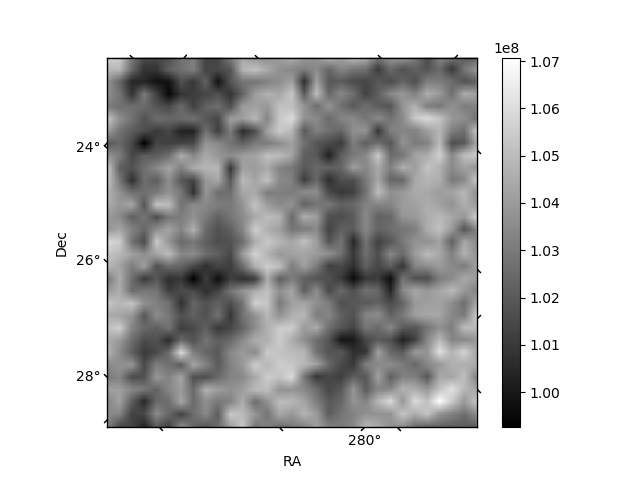
Histogram calculated using DETX and DETY for each event in the final _common_clean file
| Quadrant A | 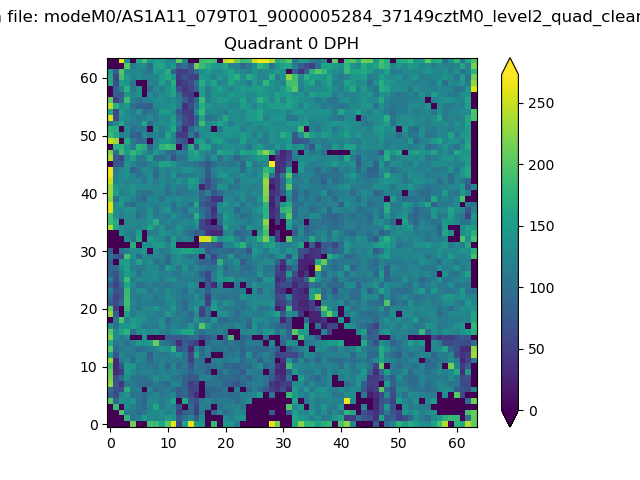 |
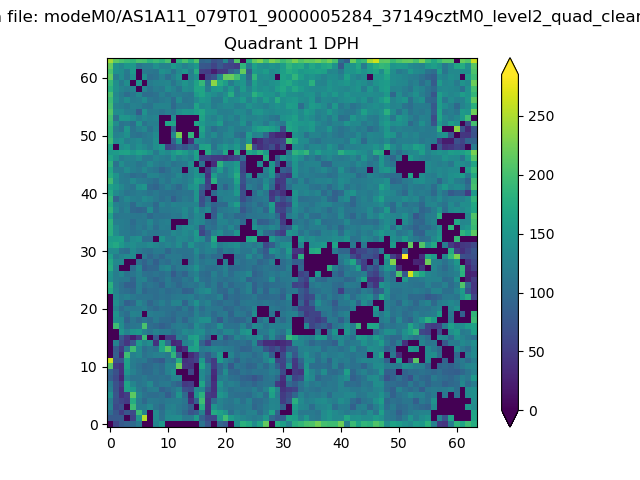 |
Quadrant B |
|---|---|---|---|
| Quadrant D | 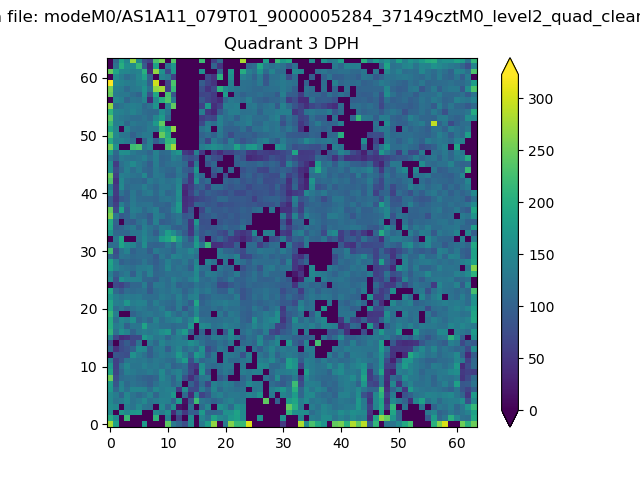 |
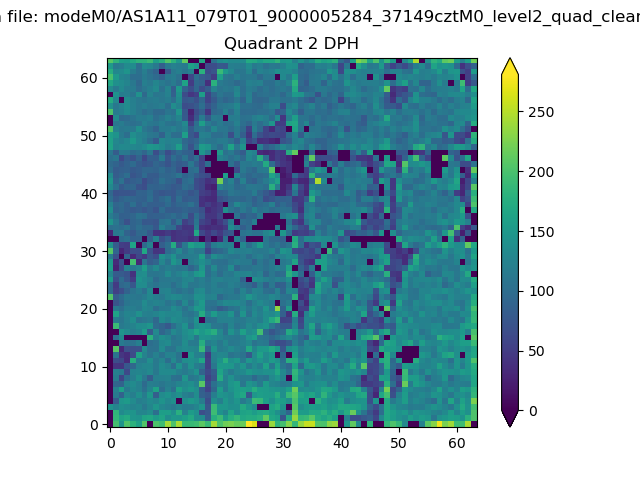 |
Quadrant C |
| Plot type | Count rate plots | Images |
|---|---|---|
| Comparison with Poisson distribution Blue bars denote a histogram of data divided into 1 sec bins. Red curve is a Poisson curve with rate = median count rate of data. |
 |
 |
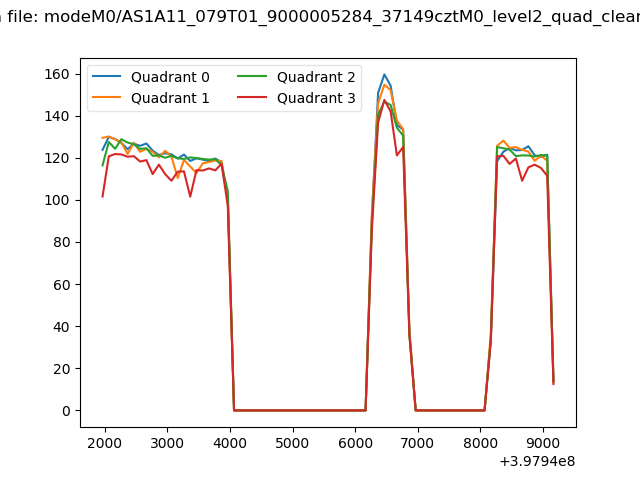
| Quadrant-wise count rates Data is divided into 100 sec bins |
 |
|
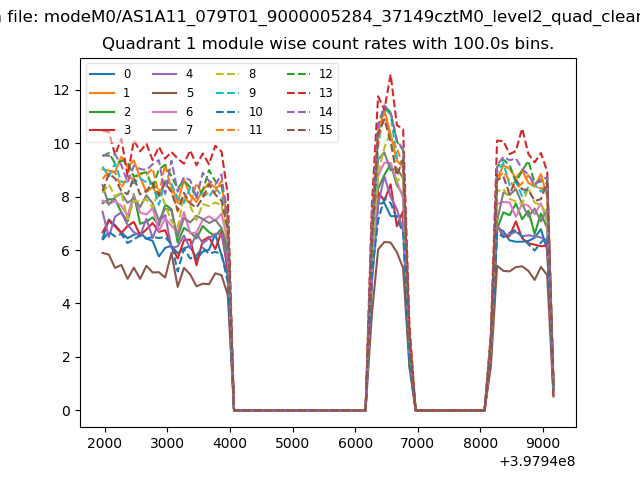
| Module-wise count rates for Quadrant A Data is divided into 100 sec bins |
 |
 |
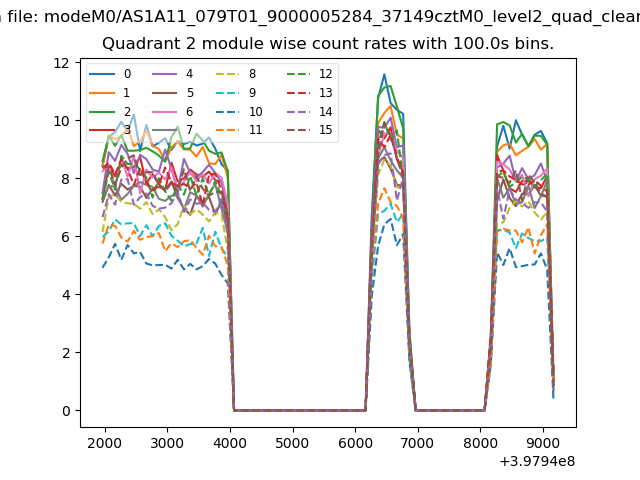
| Module-wise count rates for Quadrant B Data is divided into 100 sec bins |
 |
 |
| Module-wise count rates for Quadrant C Data is divided into 100 sec bins |
 |
 |
| Module-wise count rates for Quadrant D Data is divided into 100 sec bins |
 |
 |
| Parameter | Plot |
|---|---|
| CZT HV Monitor | 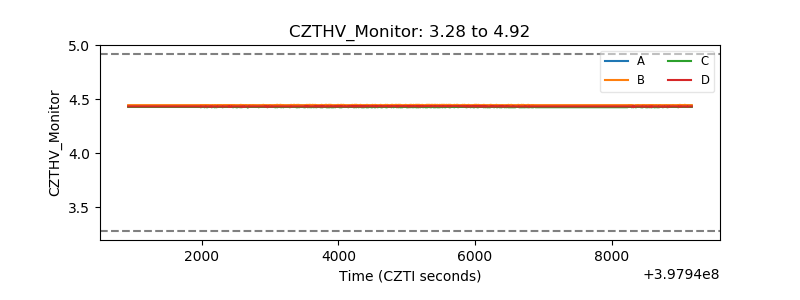 |
| D_VDD | 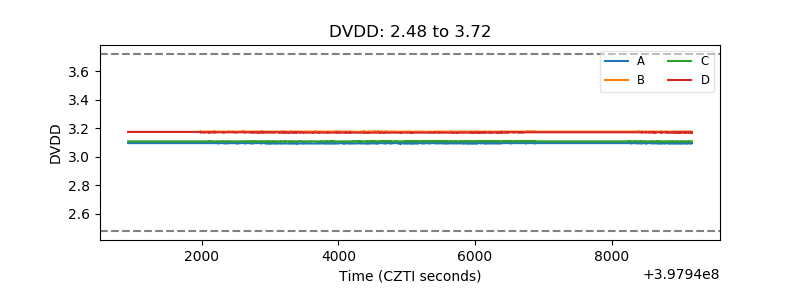 |
| Temperature 1 | 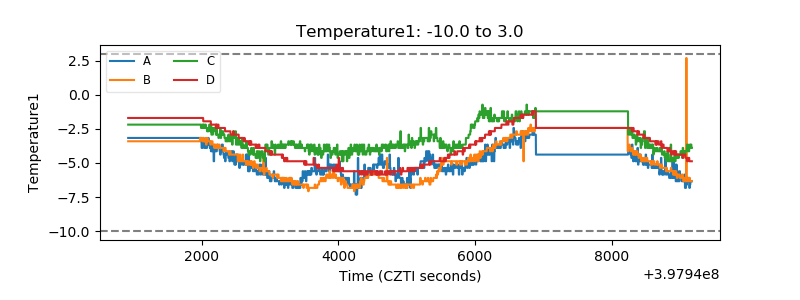 |
| Veto HV Monitor | 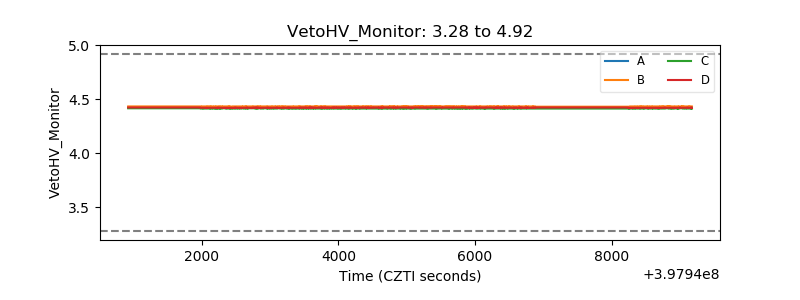 |
| Veto LLD | 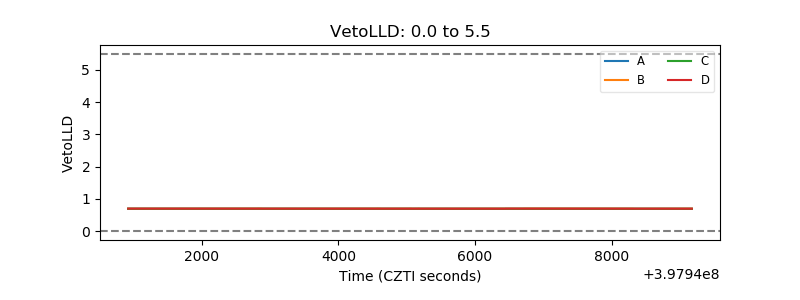 |
| Alpha Counter | 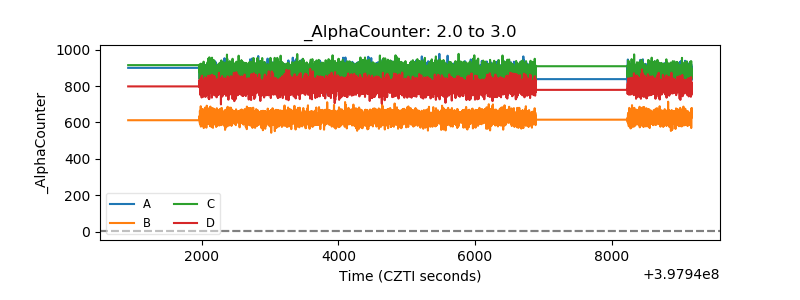 |
| _CPM_Rate | 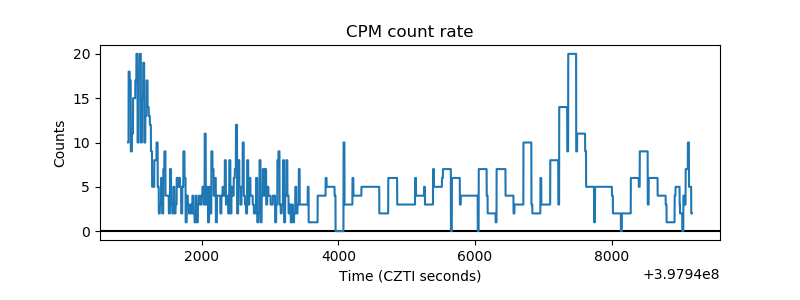 |
| CZT Counter | 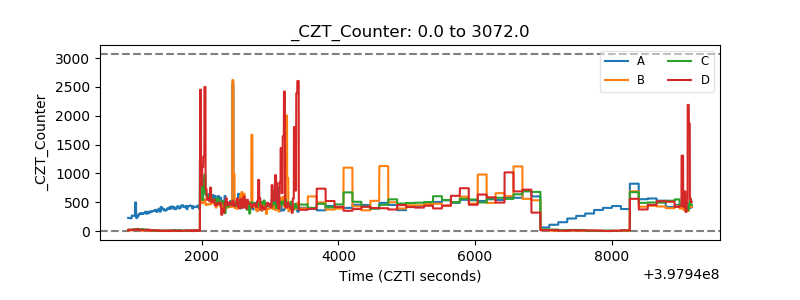 |
| +2.5 Volts monitor | 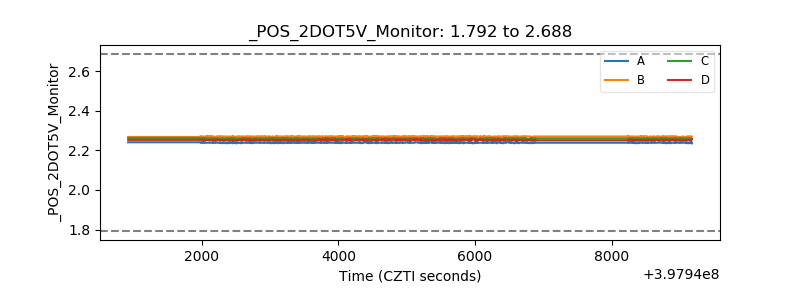 |
| +5 Volts monitor | 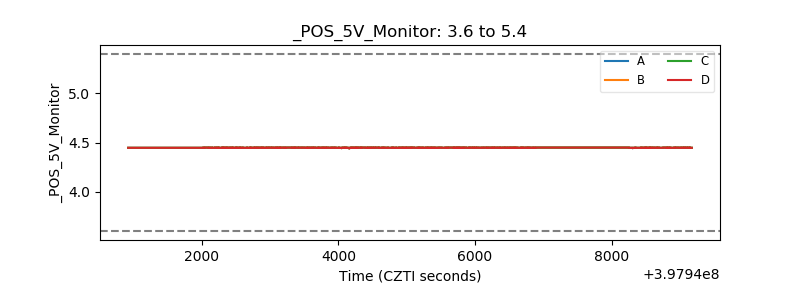 |
| _ROLL_ROT | 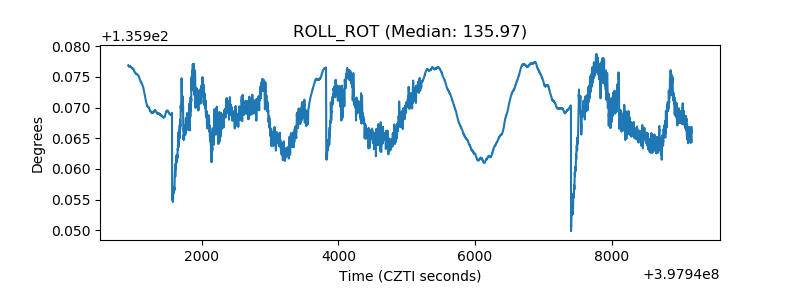 |
| _Roll_DEC | 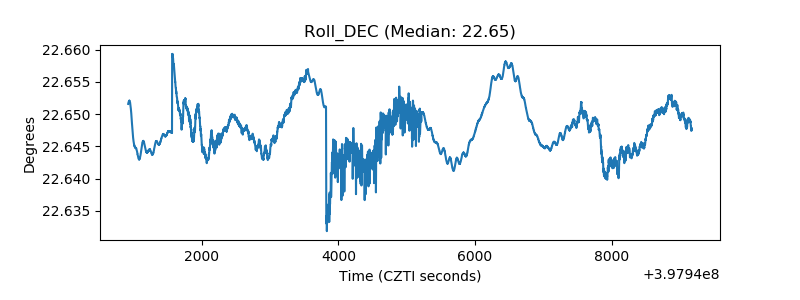 |
| _Roll_RA | 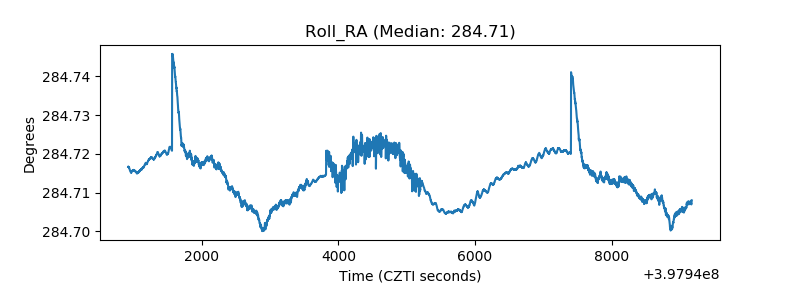 |
| Veto Counter | 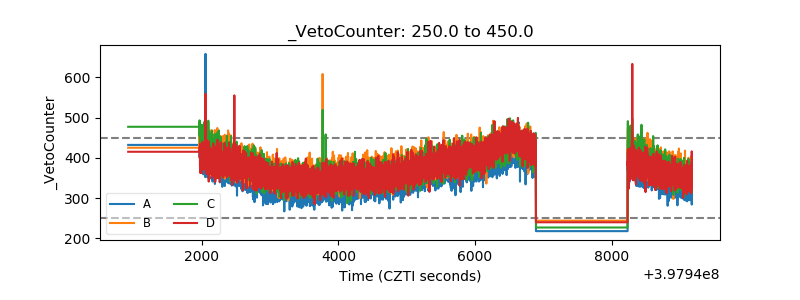 |