| Param | Original file | Final file |
|---|---|---|
| Filename | modeM0/AS1A11_079T01_9000005284_37150cztM0_level2.evt | modeM0/AS1A11_079T01_9000005284_37150cztM0_level2_quad_clean.evt |
| Size (bytes) | 478,442,880 | 82,595,520 |
| Size | 456.3 MB | 78.8 MB |
| Events in quadrant A | 3,149,629 | 528,173 |
| Events in quadrant B | 3,099,015 | 524,865 |
| Events in quadrant C | 3,596,723 | 518,966 |
| Events in quadrant D | 4,211,649 | 484,513 |
| Mode M9 | |||
|---|---|---|---|
| Quadrant | BADHDUFLAG | Total packets | Discarded packets |
| A | 0 | 27 | 0 |
| B | 0 | 27 | 0 |
| C | 0 | 27 | 0 |
| D | 0 | 27 | 0 |
| Mode SS | |||
|---|---|---|---|
| Quadrant | BADHDUFLAG | Total packets | Discarded packets |
| A | 0 | 130 | 0 |
| B | 0 | 130 | 0 |
| C | 0 | 130 | 0 |
| D | 0 | 130 | 0 |
| Mode M0 | |||
|---|---|---|---|
| Quadrant | BADHDUFLAG | Total packets | Discarded packets |
| A | 0 | 13477 | 3 |
| B | 0 | 13442 | 2 |
| C | 0 | 14628 | 2 |
| D | 0 | 16953 | 2 |
| Quadrant | Total seconds | Saturated seconds | Saturation percentage |
|---|---|---|---|
| A | 6376 | 18 | 0.282309% |
| B | 6376 | 43 | 0.674404% |
| C | 6376 | 27 | 0.423463% |
| D | 6376 | 320 | 5.018821% |
Noise dominated data is calculated using 1-second bins in cleaned event files. If a bin has >2000 counts, and if more than 50% of those come from <1% of pixels, then it is considered to be noise-dominated and hence unusable.
| Quadrant | # 1 sec bins | Bins with >0 counts | Bins with >2000 counts | High rate bins dominated by noise | Noise dominated (total time) | Noise dominated (detector-on time) | Marked lightcurve |
|---|---|---|---|---|---|---|---|
| A | 9033 | 6378 | 12 | 12 | 0.13% | 0.19% | 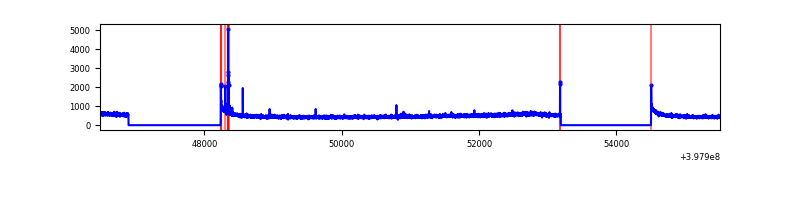 |
| B | 9033 | 6378 | 27 | 27 | 0.30% | 0.42% | 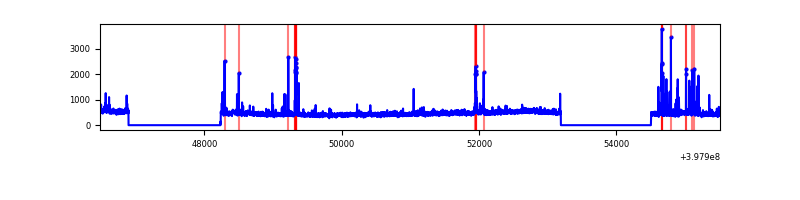 |
| C | 9033 | 6378 | 26 | 26 | 0.29% | 0.41% | 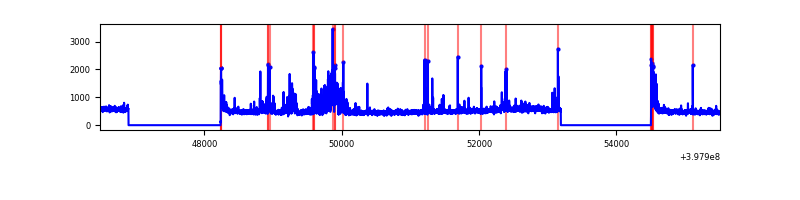 |
| D | 9033 | 6378 | 286 | 286 | 3.17% | 4.48% | 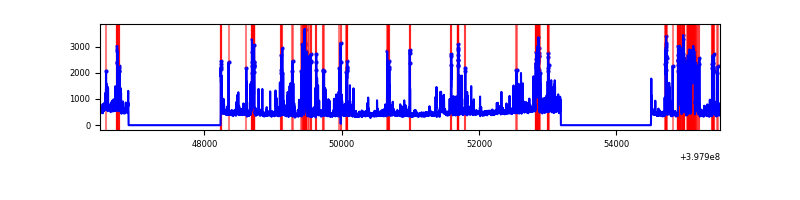 |
Top three noisy pixels from each quadrant. If the there are fewer than three noisy pixels in the level2.evt file, extra rows are filled as -1
| Pixel properties | Quadrant properties | ||||||
|---|---|---|---|---|---|---|---|
| Quadrant | DetID | PixID | Counts | Sigma | Mean | Median | Sigma |
| A | 10 | 83 | 282863 | 1899.94 | 730 | 715 | 148.5 |
| A | 15 | 237 | 36246 | 239.26 | 730 | 715 | 148.5 |
| A | 13 | 254 | 8846 | 54.75 | 730 | 715 | 148.5 |
| B | 5 | 172 | 176107 | 1250.98 | 722 | 703 | 140.2 |
| B | 5 | 200 | 29382 | 204.54 | 722 | 703 | 140.2 |
| B | 0 | 182 | 18589 | 127.56 | 722 | 703 | 140.2 |
| C | 15 | 159 | 323561 | 1938.56 | 708 | 713 | 166.5 |
| C | 15 | 214 | 292201 | 1750.26 | 708 | 713 | 166.5 |
| C | 0 | 10 | 108772 | 648.85 | 708 | 713 | 166.5 |
| D | 2 | 249 | 1038388 | 6033.14 | 697 | 677 | 172.0 |
| D | 10 | 118 | 109974 | 635.44 | 697 | 677 | 172.0 |
| D | 2 | 250 | 107710 | 622.28 | 697 | 677 | 172.0 |
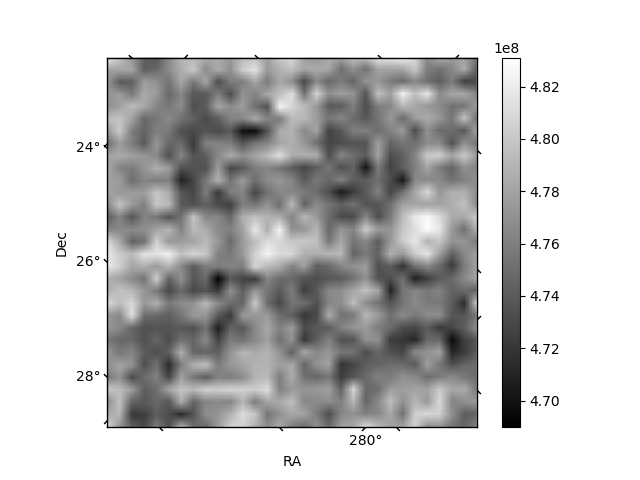
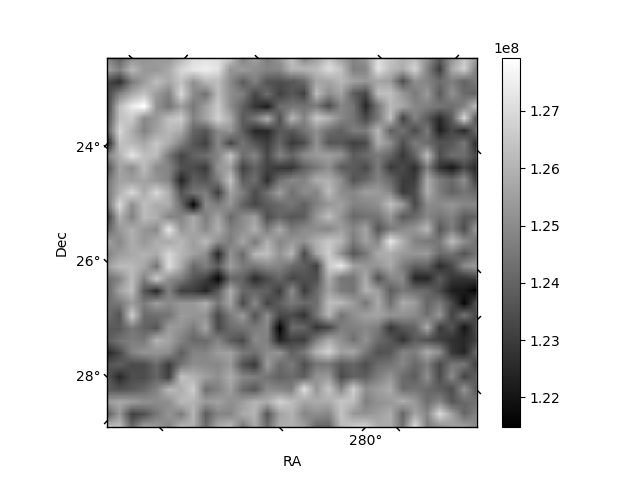
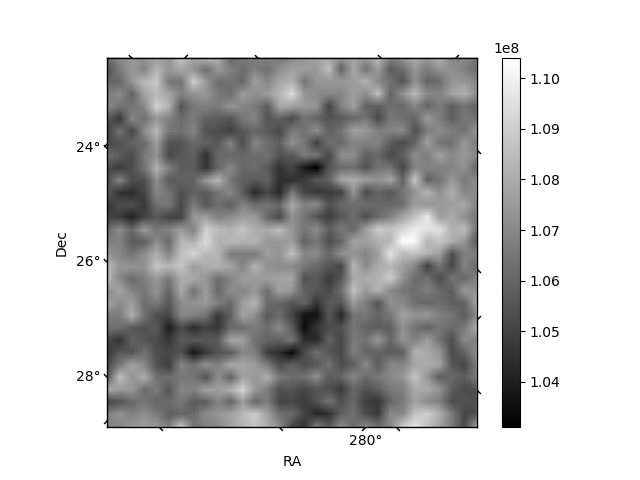
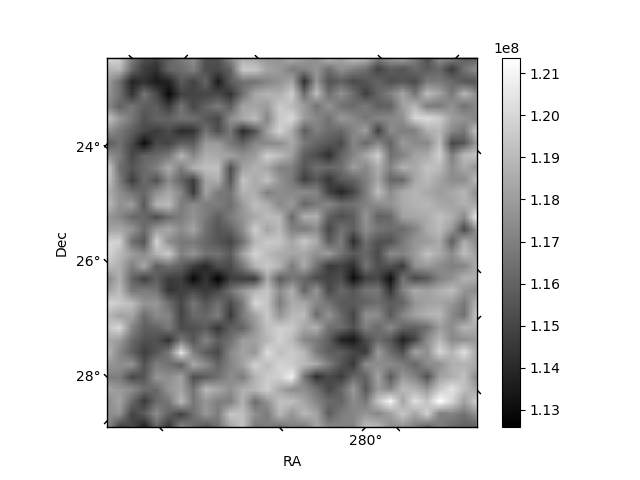
Histogram calculated using DETX and DETY for each event in the final _common_clean file
| Quadrant A | 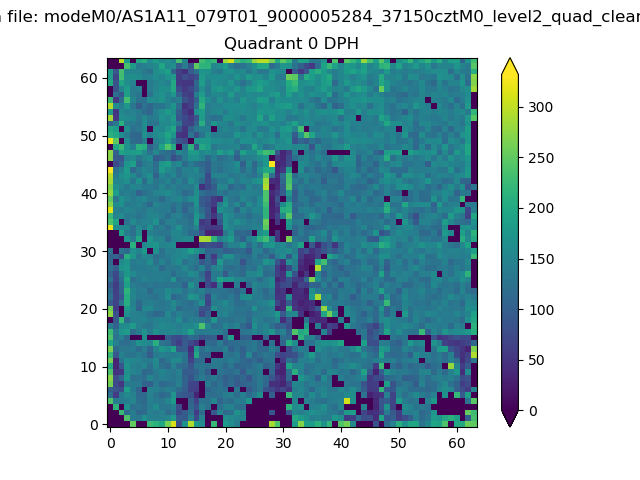 |
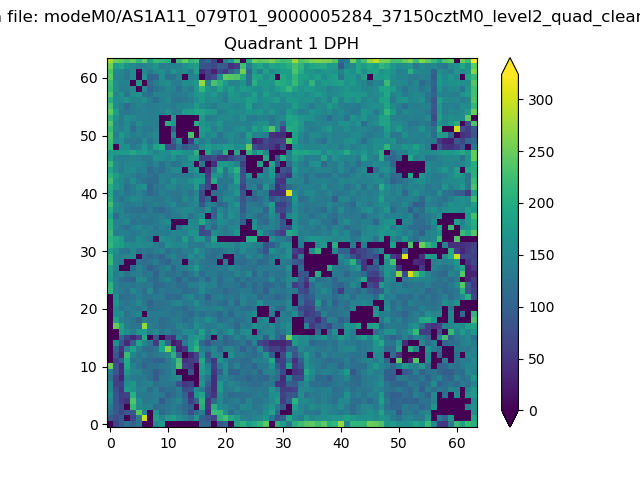 |
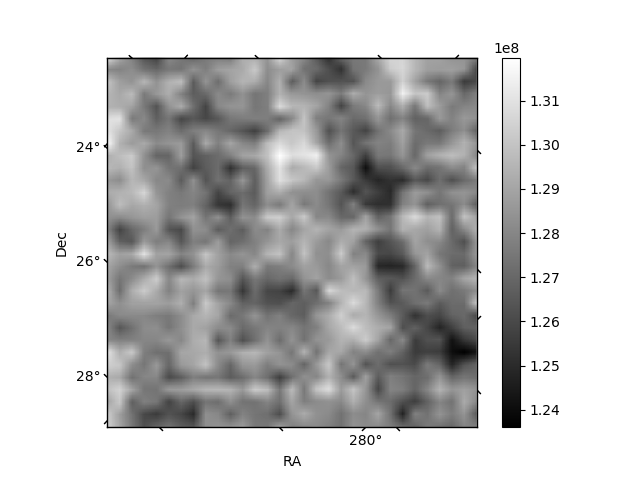
Quadrant B |
|---|---|---|---|
| Quadrant D | 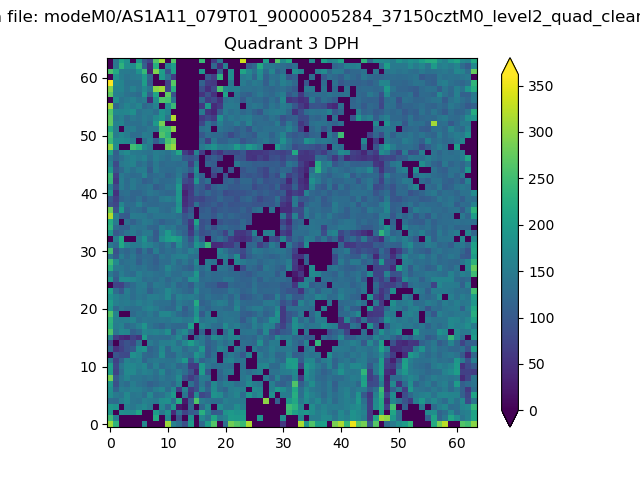 |
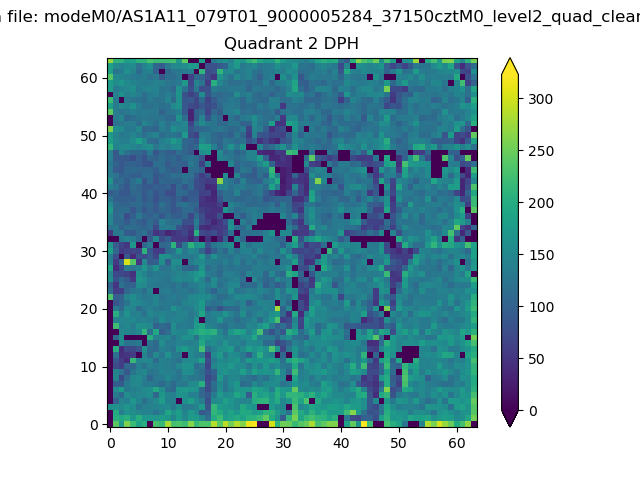 |
Quadrant C |
| Plot type | Count rate plots | Images |
|---|---|---|
| Comparison with Poisson distribution Blue bars denote a histogram of data divided into 1 sec bins. Red curve is a Poisson curve with rate = median count rate of data. |
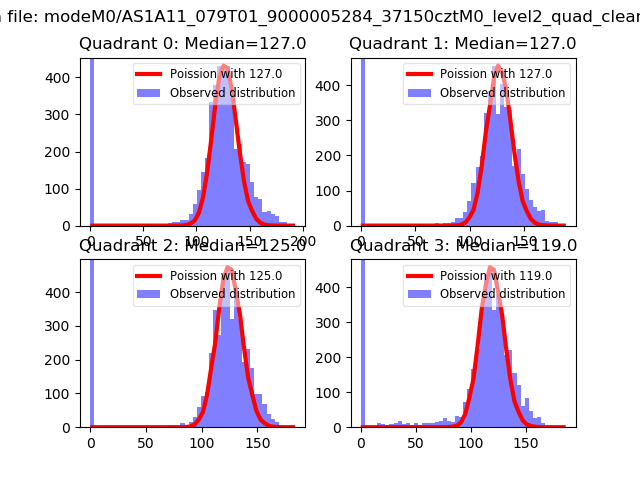 |
 |
| Quadrant-wise count rates Data is divided into 100 sec bins |
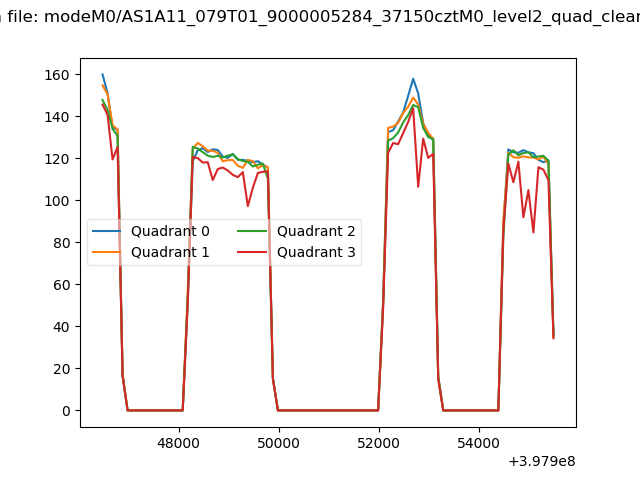 |
|
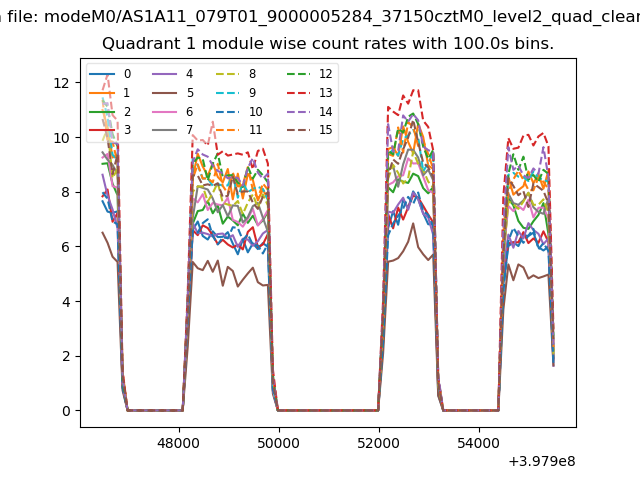
| Module-wise count rates for Quadrant A Data is divided into 100 sec bins |
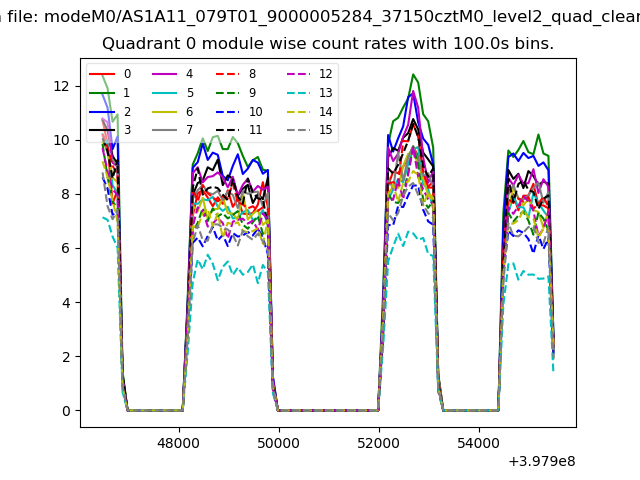 |
 |
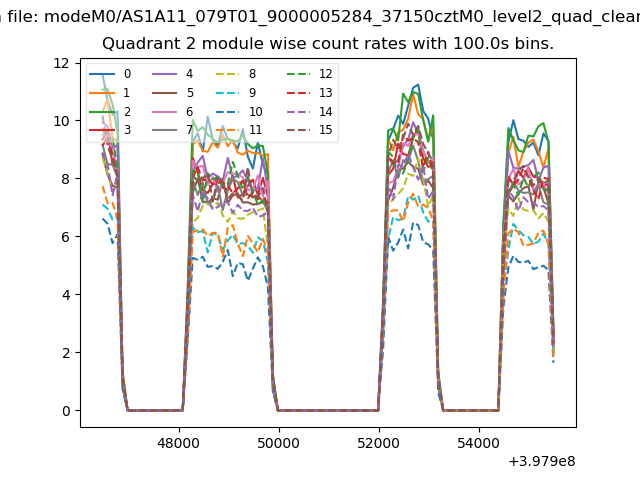
| Module-wise count rates for Quadrant B Data is divided into 100 sec bins |
 |
 |
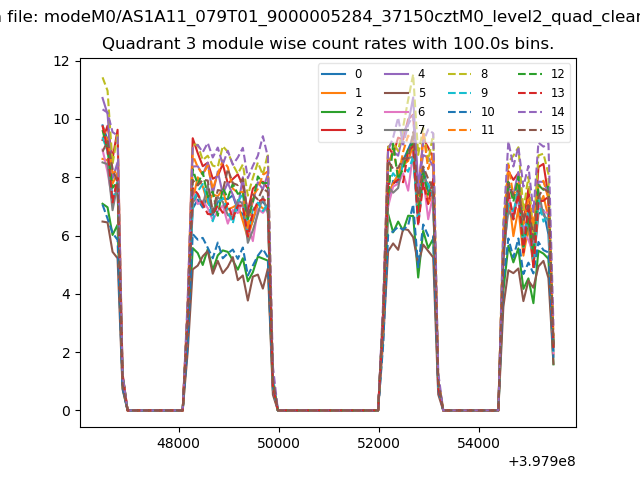
| Module-wise count rates for Quadrant C Data is divided into 100 sec bins |
 |
 |
| Module-wise count rates for Quadrant D Data is divided into 100 sec bins |
 |
 |
| Parameter | Plot |
|---|---|
| CZT HV Monitor |  |
| D_VDD | 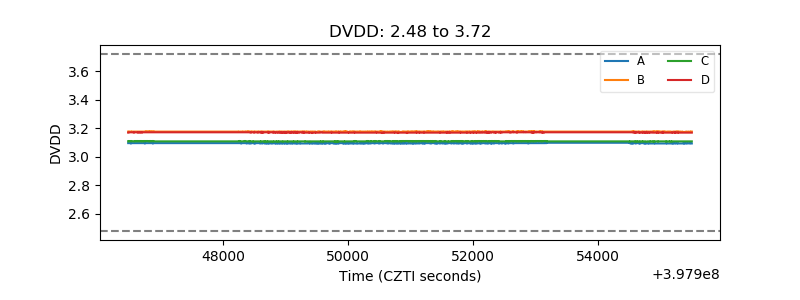 |
| Temperature 1 | 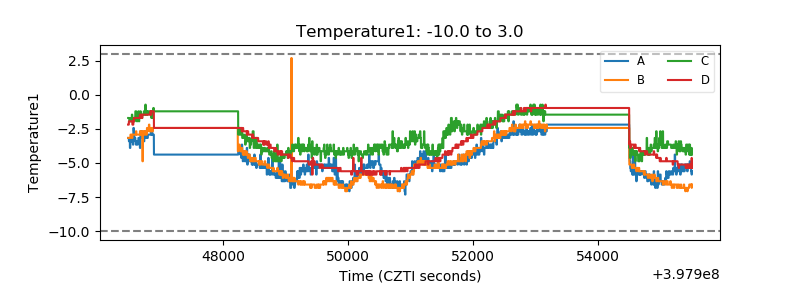 |
| Veto HV Monitor | 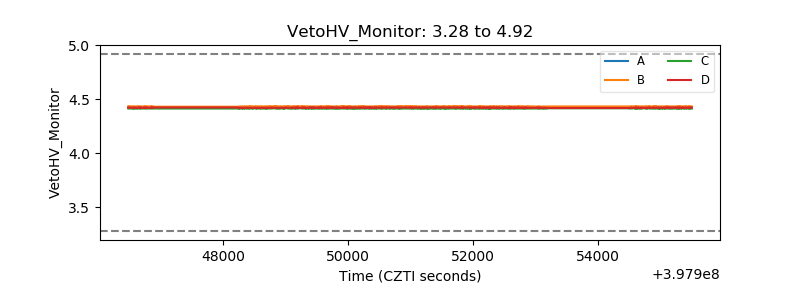 |
| Veto LLD | 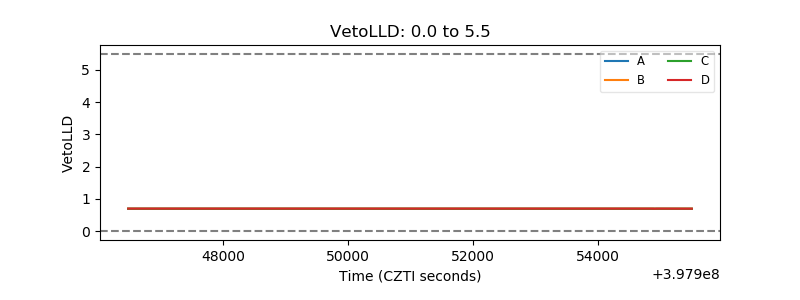 |
| Alpha Counter | 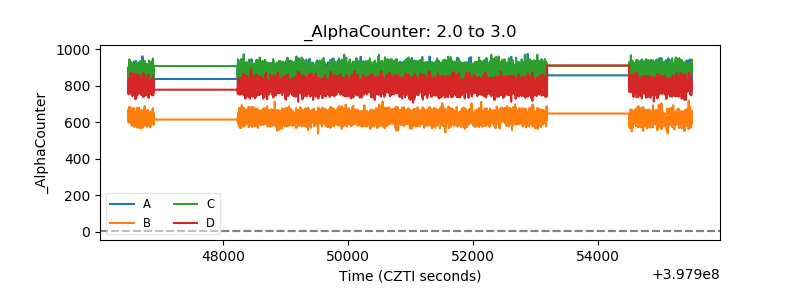 |
| _CPM_Rate | 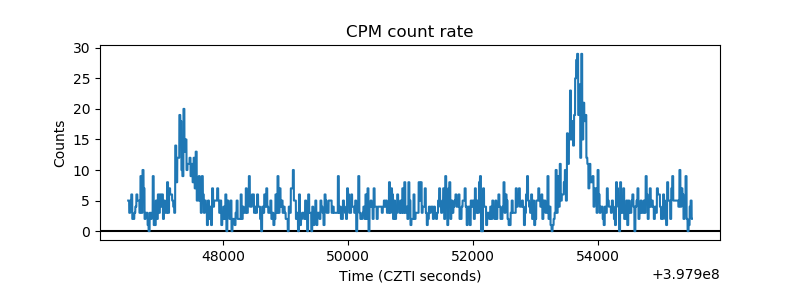 |
| CZT Counter | 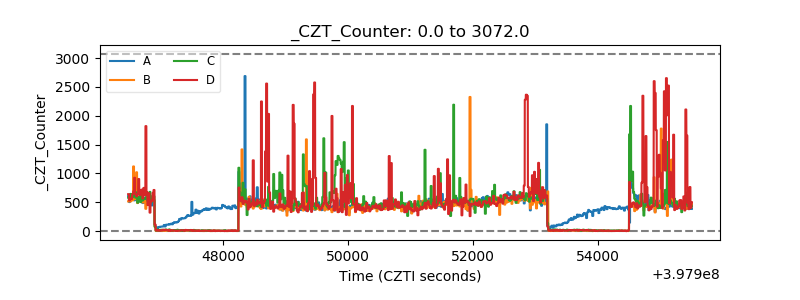 |
| +2.5 Volts monitor | 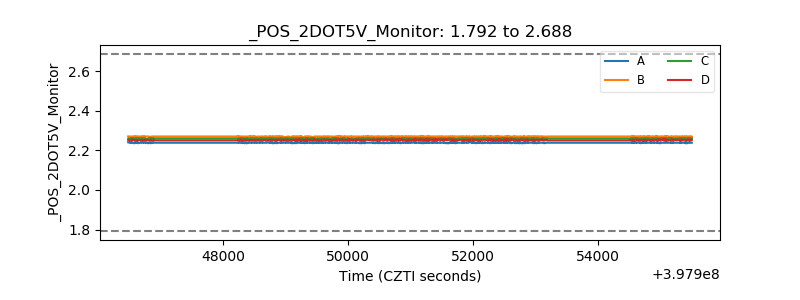 |
| +5 Volts monitor | 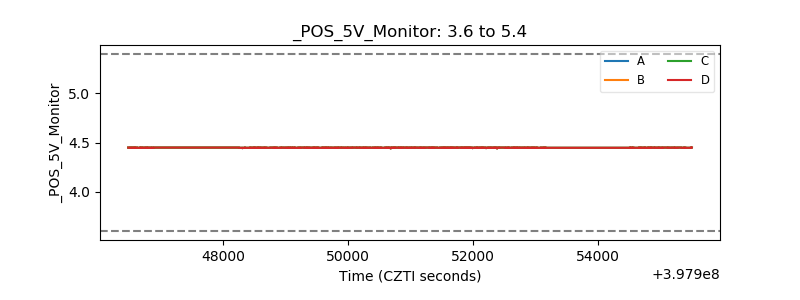 |
| _ROLL_ROT | 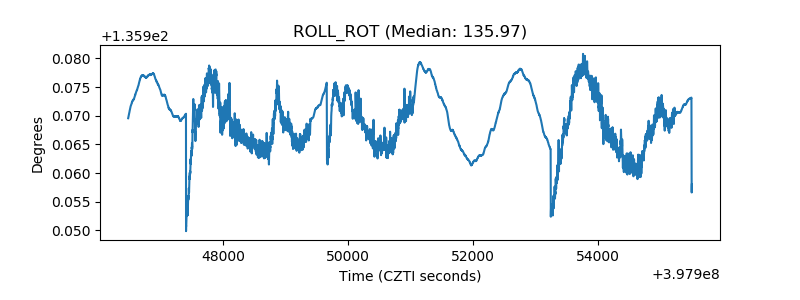 |
| _Roll_DEC | 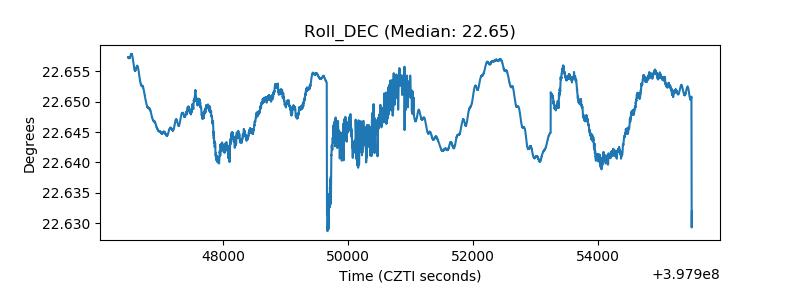 |
| _Roll_RA | 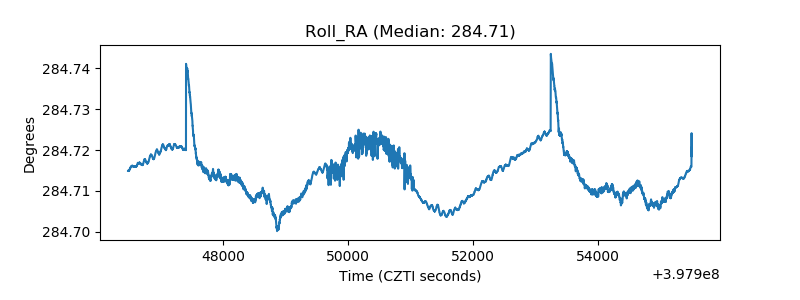 |
| Veto Counter | 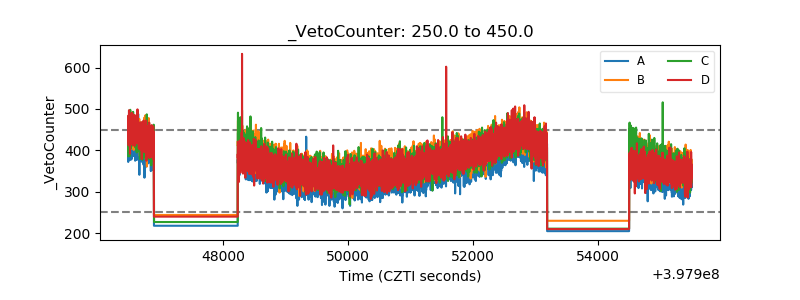 |