| Param | Original file | Final file |
|---|---|---|
| Filename | modeM0/AS1A11_079T01_9000005284_37152cztM0_level2.evt | modeM0/AS1A11_079T01_9000005284_37152cztM0_level2_quad_clean.evt |
| Size (bytes) | 787,236,480 | 122,774,400 |
| Size | 750.8 MB | 117.1 MB |
| Events in quadrant A | 5,409,851 | 756,080 |
| Events in quadrant B | 5,499,712 | 754,943 |
| Events in quadrant C | 5,901,091 | 746,526 |
| Events in quadrant D | 6,292,995 | 706,033 |
| Mode M9 | |||
|---|---|---|---|
| Quadrant | BADHDUFLAG | Total packets | Discarded packets |
| A | 0 | 41 | 0 |
| B | 0 | 41 | 0 |
| C | 0 | 41 | 0 |
| D | 0 | 41 | 0 |
| Mode SS | |||
|---|---|---|---|
| Quadrant | BADHDUFLAG | Total packets | Discarded packets |
| A | 0 | 224 | 0 |
| B | 0 | 224 | 0 |
| C | 0 | 224 | 0 |
| D | 0 | 224 | 0 |
| Mode M0 | |||
|---|---|---|---|
| Quadrant | BADHDUFLAG | Total packets | Discarded packets |
| A | 0 | 22966 | 4 |
| B | 0 | 23609 | 3 |
| C | 0 | 24174 | 3 |
| D | 0 | 26468 | 3 |
| Quadrant | Total seconds | Saturated seconds | Saturation percentage |
|---|---|---|---|
| A | 10898 | 54 | 0.495504% |
| B | 10898 | 132 | 1.211231% |
| C | 10898 | 142 | 1.302991% |
| D | 10898 | 296 | 2.716095% |
Noise dominated data is calculated using 1-second bins in cleaned event files. If a bin has >2000 counts, and if more than 50% of those come from <1% of pixels, then it is considered to be noise-dominated and hence unusable.
| Quadrant | # 1 sec bins | Bins with >0 counts | Bins with >2000 counts | High rate bins dominated by noise | Noise dominated (total time) | Noise dominated (detector-on time) | Marked lightcurve |
|---|---|---|---|---|---|---|---|
| A | 15018 | 10901 | 30 | 30 | 0.20% | 0.28% | 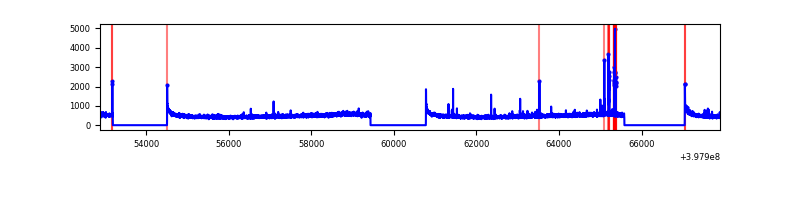 |
| B | 15018 | 10901 | 70 | 70 | 0.47% | 0.64% | 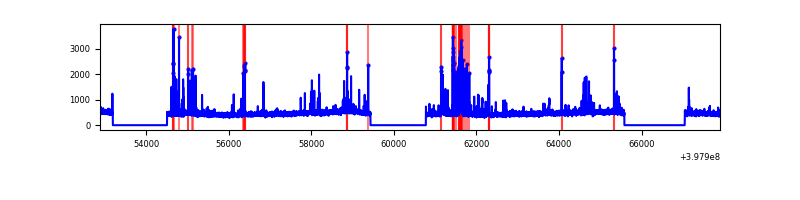 |
| C | 15018 | 10901 | 122 | 122 | 0.81% | 1.12% | 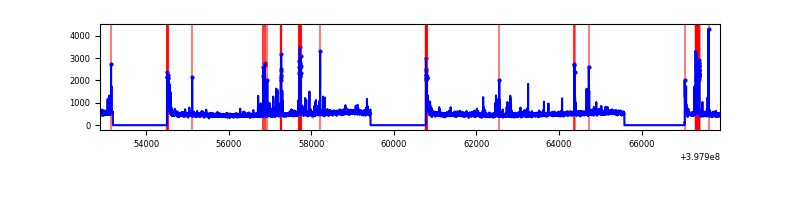 |
| D | 15018 | 10901 | 255 | 255 | 1.70% | 2.34% | 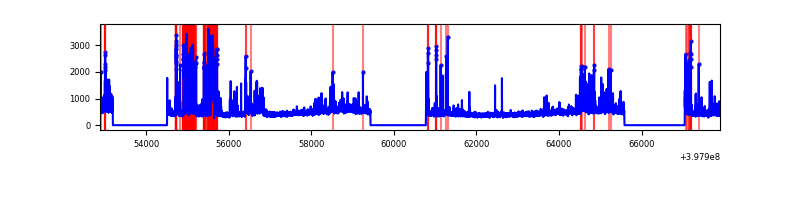 |
Top three noisy pixels from each quadrant. If the there are fewer than three noisy pixels in the level2.evt file, extra rows are filled as -1
| Pixel properties | Quadrant properties | ||||||
|---|---|---|---|---|---|---|---|
| Quadrant | DetID | PixID | Counts | Sigma | Mean | Median | Sigma |
| A | 10 | 83 | 454426 | 1811.36 | 1245 | 1222 | 250.2 |
| A | 15 | 237 | 102632 | 405.31 | 1245 | 1222 | 250.2 |
| A | 9 | 143 | 27952 | 106.83 | 1245 | 1222 | 250.2 |
| B | 5 | 172 | 435780 | 1818.98 | 1231 | 1196 | 238.9 |
| B | 5 | 200 | 86955 | 358.95 | 1231 | 1196 | 238.9 |
| B | 4 | 232 | 48958 | 199.91 | 1231 | 1196 | 238.9 |
| C | 15 | 214 | 492528 | 1728.56 | 1209 | 1217 | 284.2 |
| C | 14 | 254 | 466974 | 1638.66 | 1209 | 1217 | 284.2 |
| C | 0 | 10 | 197205 | 689.54 | 1209 | 1217 | 284.2 |
| D | 2 | 249 | 872774 | 2996.88 | 1200 | 1170 | 290.8 |
| D | 12 | 17 | 299708 | 1026.48 | 1200 | 1170 | 290.8 |
| D | 13 | 249 | 105695 | 359.39 | 1200 | 1170 | 290.8 |
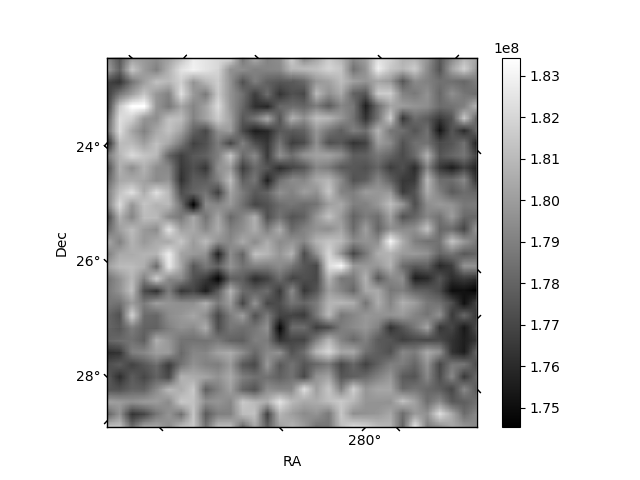
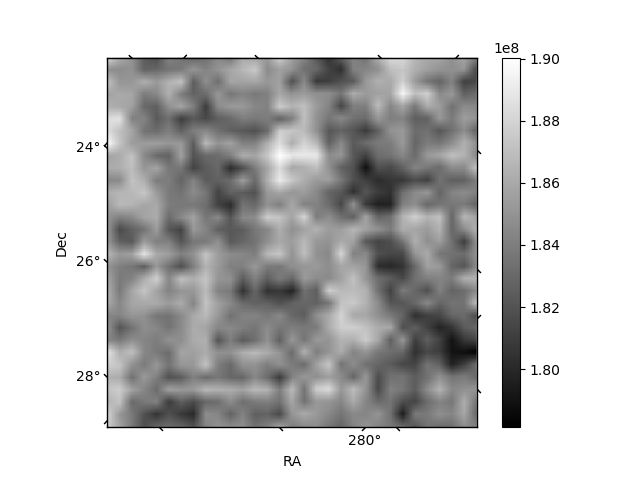
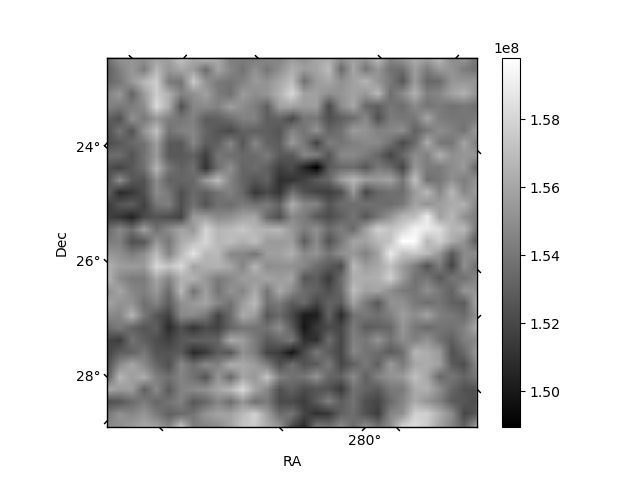
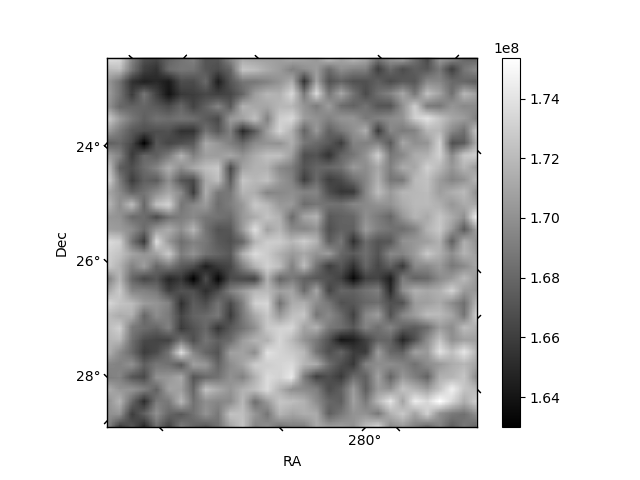
Histogram calculated using DETX and DETY for each event in the final _common_clean file
| Quadrant A | 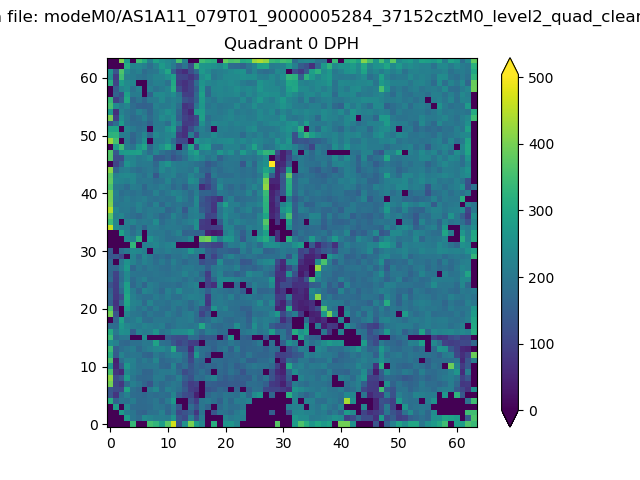 |
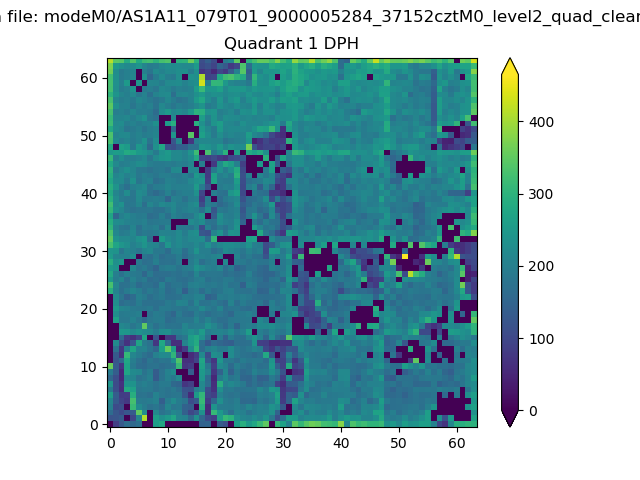 |
Quadrant B |
|---|---|---|---|
| Quadrant D | 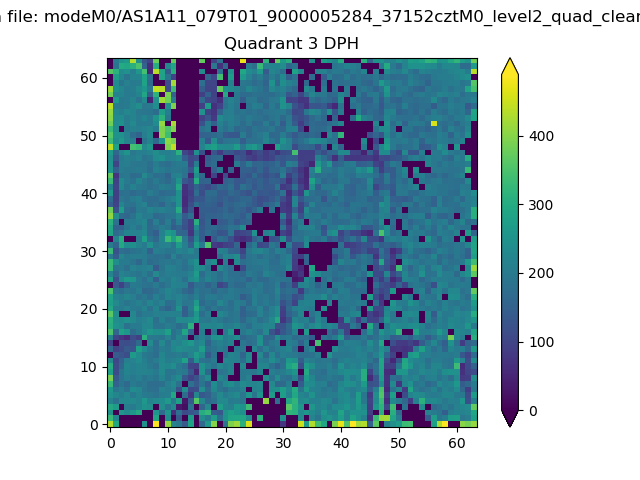 |
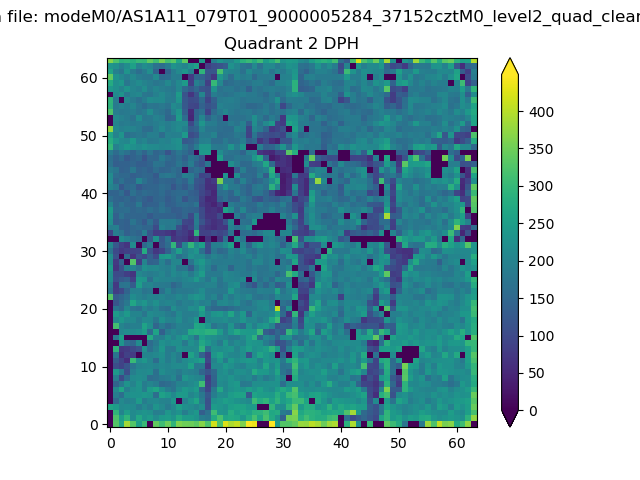 |
Quadrant C |
| Plot type | Count rate plots | Images |
|---|---|---|
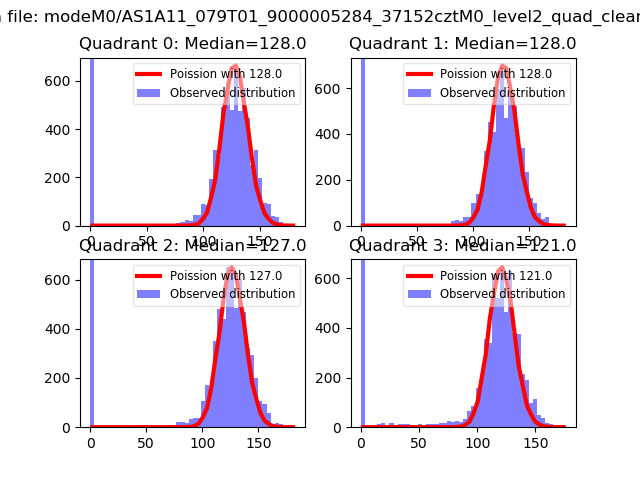
| Comparison with Poisson distribution Blue bars denote a histogram of data divided into 1 sec bins. Red curve is a Poisson curve with rate = median count rate of data. |
 |
 |
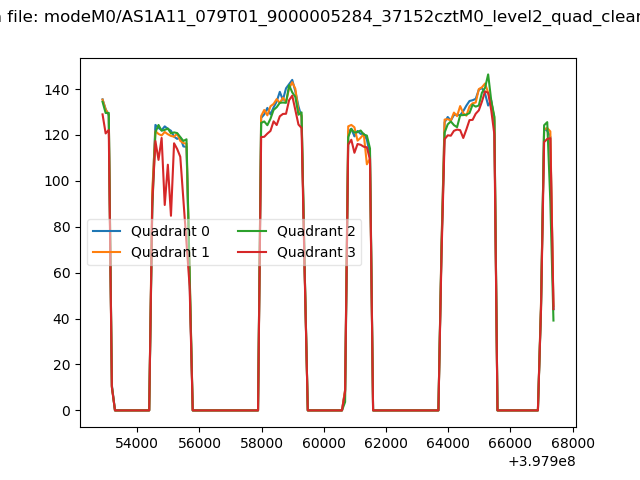
| Quadrant-wise count rates Data is divided into 100 sec bins |
 |
|
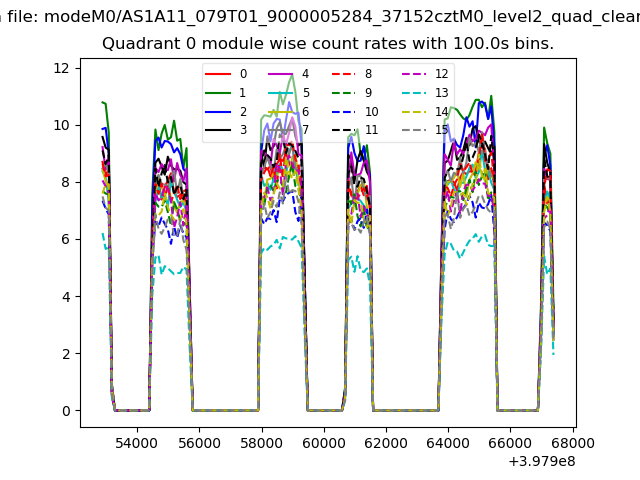
| Module-wise count rates for Quadrant A Data is divided into 100 sec bins |
 |
 |
| Module-wise count rates for Quadrant B Data is divided into 100 sec bins |
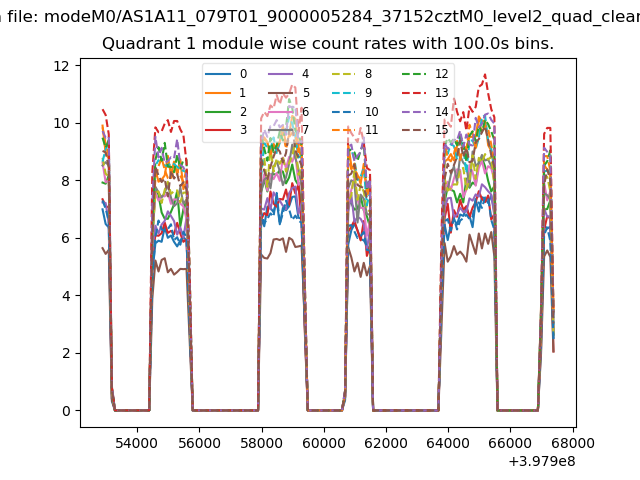 |
 |
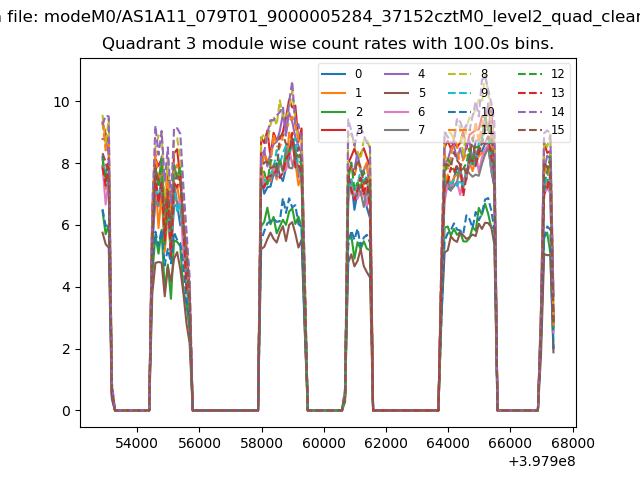
| Module-wise count rates for Quadrant C Data is divided into 100 sec bins |
 |
 |
| Module-wise count rates for Quadrant D Data is divided into 100 sec bins |
 |
 |
| Parameter | Plot |
|---|---|
| CZT HV Monitor | 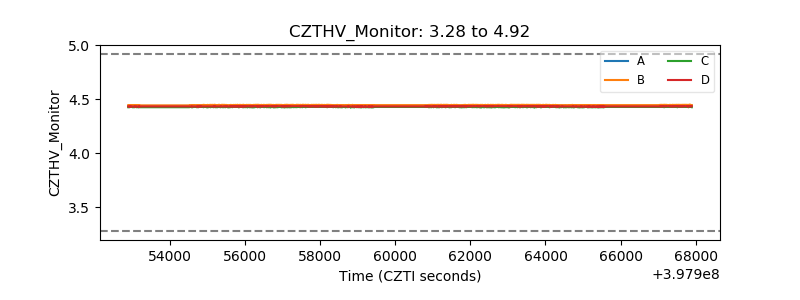 |
| D_VDD | 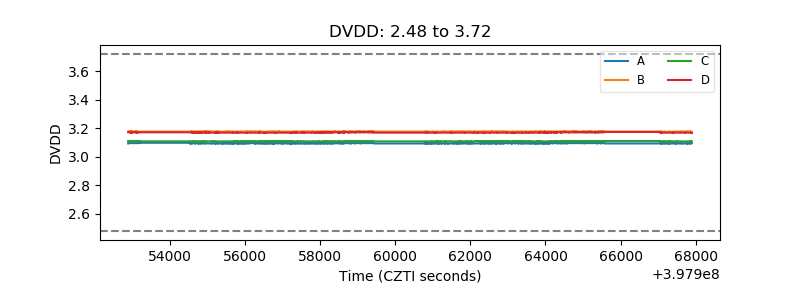 |
| Temperature 1 |  |
| Veto HV Monitor | 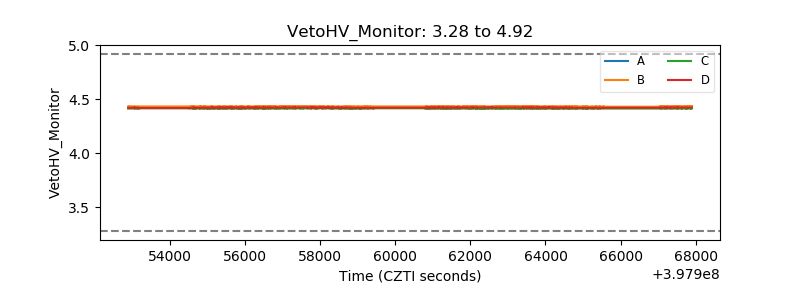 |
| Veto LLD | 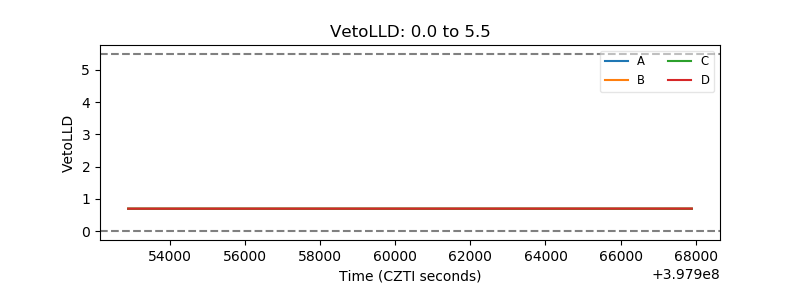 |
| Alpha Counter | 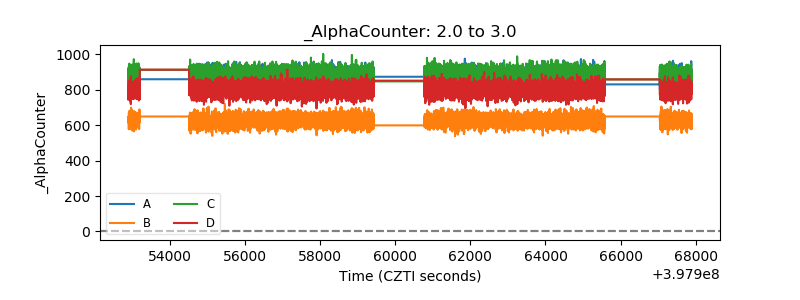 |
| _CPM_Rate | 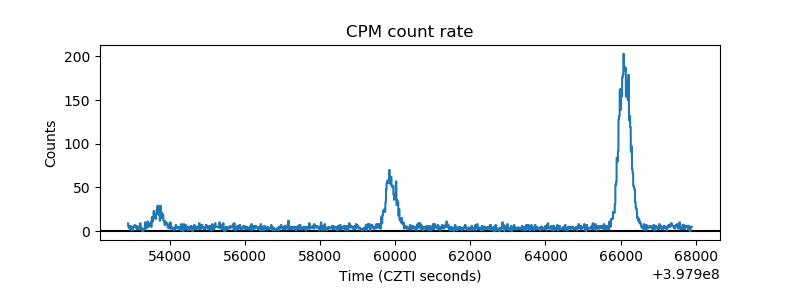 |
| CZT Counter | 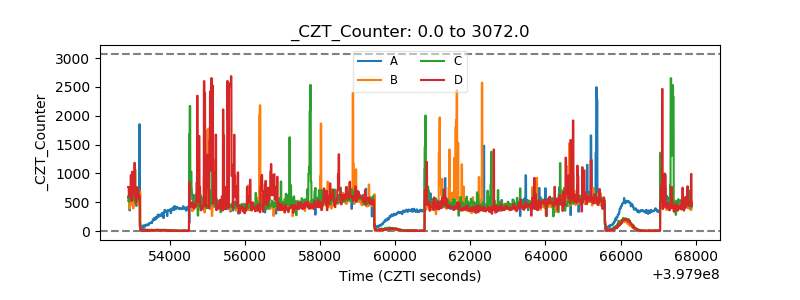 |
| +2.5 Volts monitor | 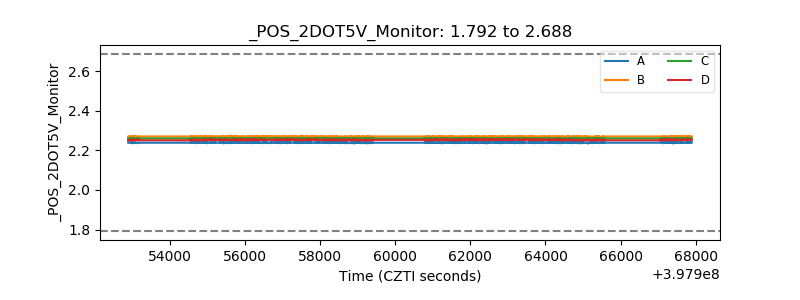 |
| +5 Volts monitor | 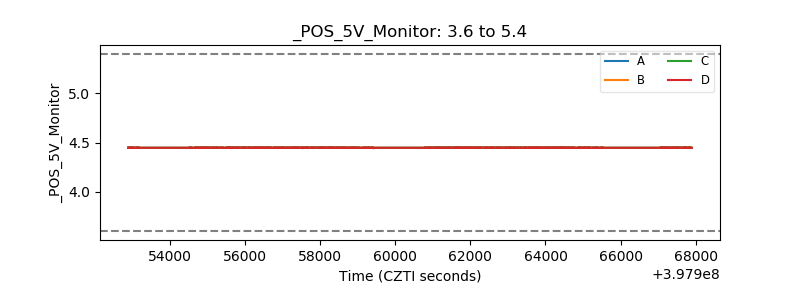 |
| _ROLL_ROT | 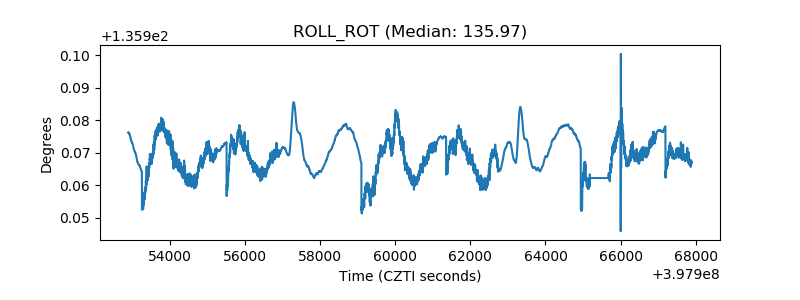 |
| _Roll_DEC | 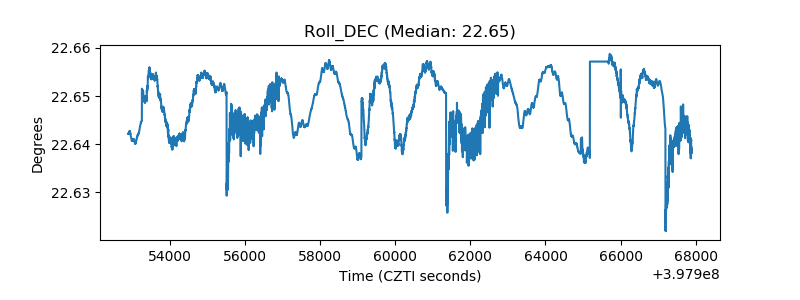 |
| _Roll_RA | 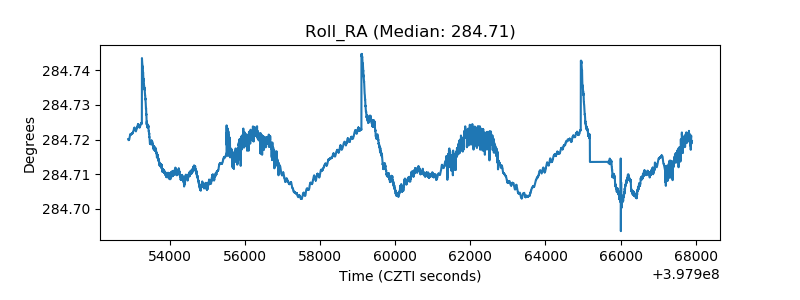 |
| Veto Counter | 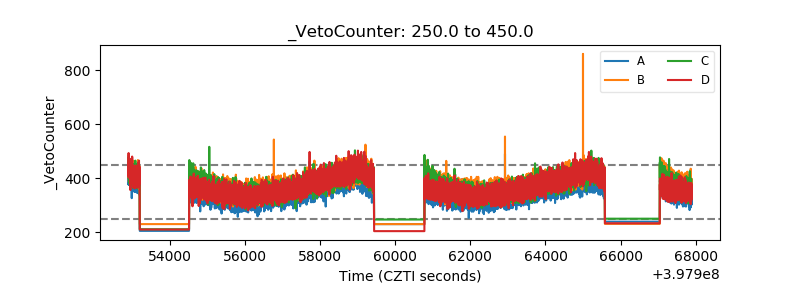 |