| Param | Original file | Final file |
|---|---|---|
| Filename | modeM0/AS1A11_079T01_9000005284_37154cztM0_level2.evt | modeM0/AS1A11_079T01_9000005284_37154cztM0_level2_quad_clean.evt |
| Size (bytes) | 406,399,680 | 51,739,200 |
| Size | 387.6 MB | 49.3 MB |
| Events in quadrant A | 2,680,124 | 306,286 |
| Events in quadrant B | 2,739,421 | 306,889 |
| Events in quadrant C | 2,745,934 | 302,023 |
| Events in quadrant D | 3,778,519 | 276,360 |
| Mode M9 | |||
|---|---|---|---|
| Quadrant | BADHDUFLAG | Total packets | Discarded packets |
| A | 0 | 28 | 0 |
| B | 0 | 28 | 0 |
| C | 0 | 28 | 0 |
| D | 0 | 29 | 0 |
| Mode SS | |||
|---|---|---|---|
| Quadrant | BADHDUFLAG | Total packets | Discarded packets |
| A | 0 | 110 | 0 |
| B | 0 | 110 | 0 |
| C | 0 | 110 | 0 |
| D | 0 | 110 | 0 |
| Mode M0 | |||
|---|---|---|---|
| Quadrant | BADHDUFLAG | Total packets | Discarded packets |
| A | 0 | 11181 | 3 |
| B | 0 | 11587 | 2 |
| C | 0 | 11203 | 2 |
| D | 0 | 14886 | 2 |
| Quadrant | Total seconds | Saturated seconds | Saturation percentage |
|---|---|---|---|
| A | 5345 | 8 | 0.149673% |
| B | 5345 | 53 | 0.991581% |
| C | 5345 | 14 | 0.261927% |
| D | 5345 | 345 | 6.454630% |
Noise dominated data is calculated using 1-second bins in cleaned event files. If a bin has >2000 counts, and if more than 50% of those come from <1% of pixels, then it is considered to be noise-dominated and hence unusable.
| Quadrant | # 1 sec bins | Bins with >0 counts | Bins with >2000 counts | High rate bins dominated by noise | Noise dominated (total time) | Noise dominated (detector-on time) | Marked lightcurve |
|---|---|---|---|---|---|---|---|
| A | 7018 | 5346 | 4 | 4 | 0.06% | 0.07% | 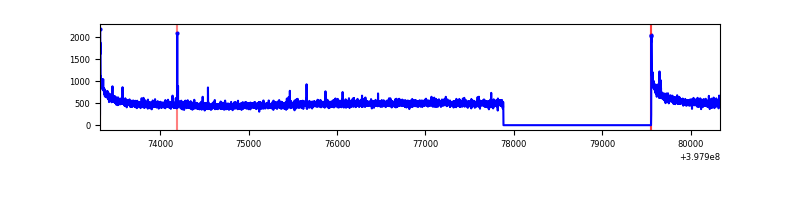 |
| B | 7018 | 5346 | 32 | 32 | 0.46% | 0.60% | 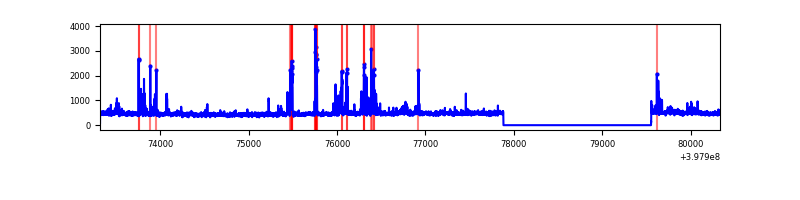 |
| C | 7018 | 5346 | 5 | 5 | 0.07% | 0.09% | 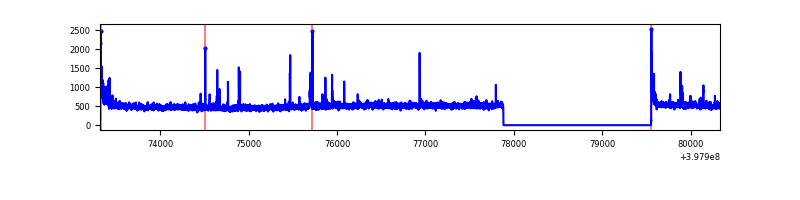 |
| D | 7018 | 5346 | 296 | 296 | 4.22% | 5.54% | 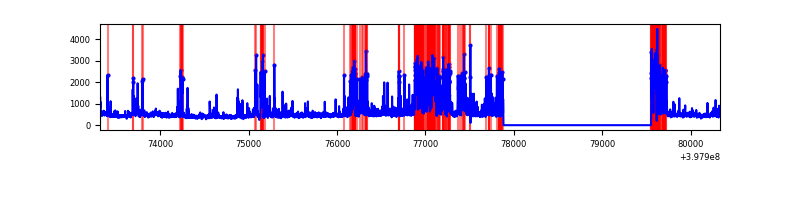 |
Top three noisy pixels from each quadrant. If the there are fewer than three noisy pixels in the level2.evt file, extra rows are filled as -1
| Pixel properties | Quadrant properties | ||||||
|---|---|---|---|---|---|---|---|
| Quadrant | DetID | PixID | Counts | Sigma | Mean | Median | Sigma |
| A | 10 | 83 | 256250 | 2015.4 | 621 | 609 | 126.8 |
| A | 9 | 143 | 9662 | 71.37 | 621 | 609 | 126.8 |
| A | 13 | 6 | 8840 | 64.89 | 621 | 609 | 126.8 |
| B | 5 | 172 | 193393 | 1622.29 | 616 | 601 | 118.8 |
| B | 5 | 255 | 69360 | 578.59 | 616 | 601 | 118.8 |
| B | 5 | 207 | 34085 | 281.76 | 616 | 601 | 118.8 |
| C | 15 | 214 | 250153 | 1756.8 | 602 | 606 | 142.0 |
| C | 0 | 10 | 77065 | 538.27 | 602 | 606 | 142.0 |
| C | 14 | 254 | 50558 | 351.66 | 602 | 606 | 142.0 |
| D | 2 | 249 | 979936 | 6810.88 | 586 | 570 | 143.8 |
| D | 12 | 227 | 109699 | 758.92 | 586 | 570 | 143.8 |
| D | 13 | 249 | 83784 | 578.7 | 586 | 570 | 143.8 |
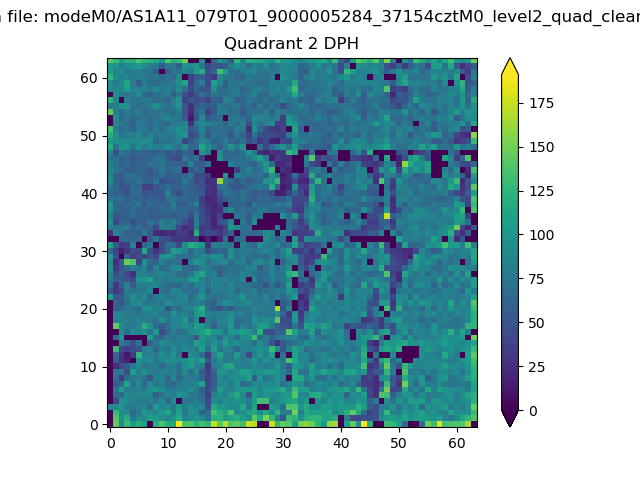
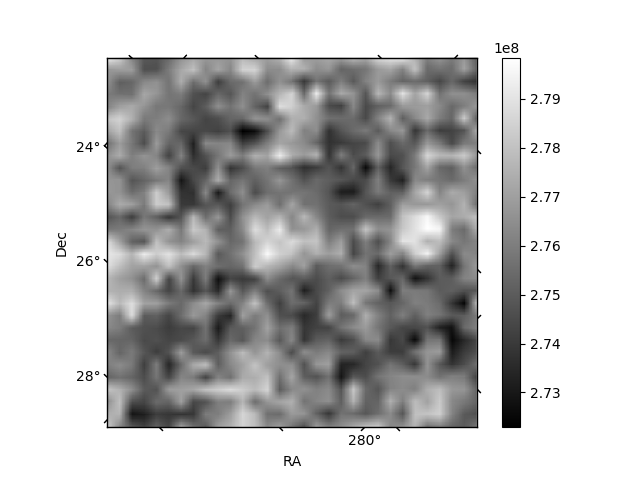
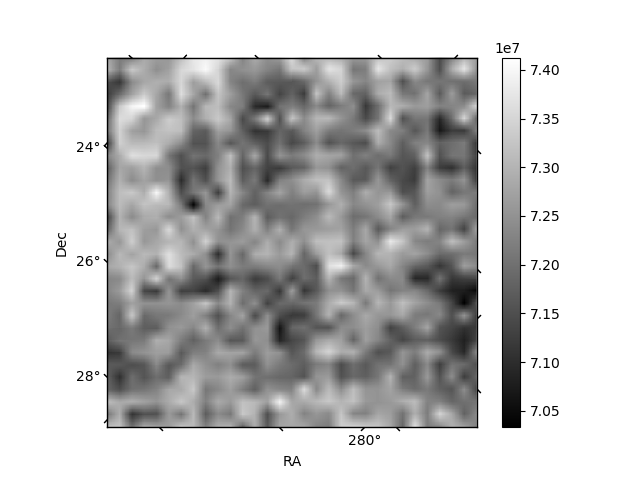
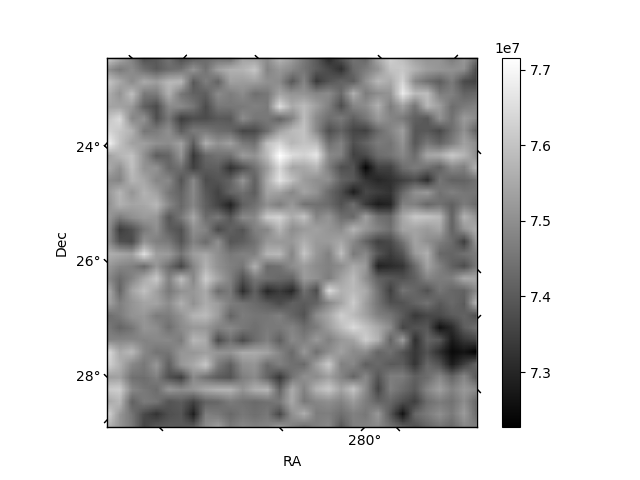
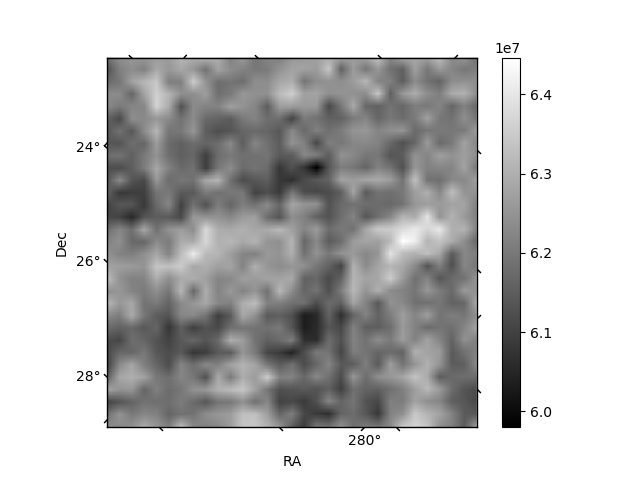
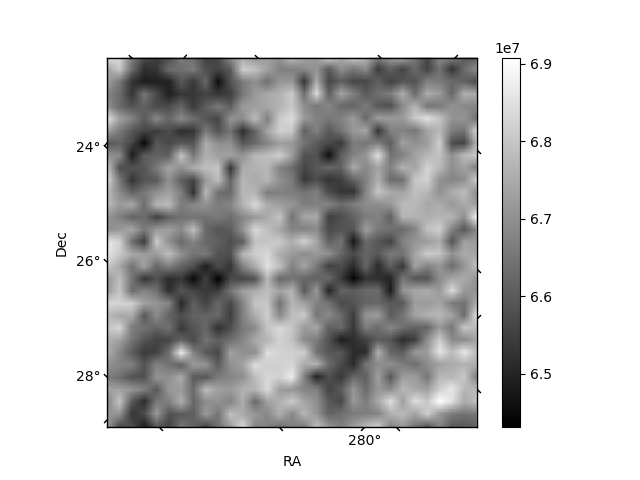
Histogram calculated using DETX and DETY for each event in the final _common_clean file
| Quadrant A | 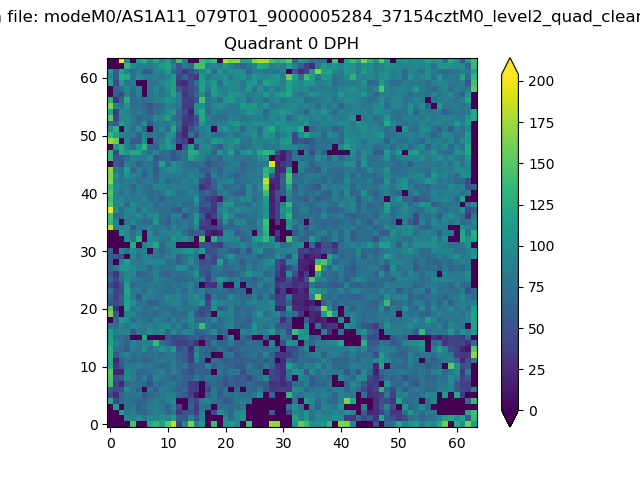 |
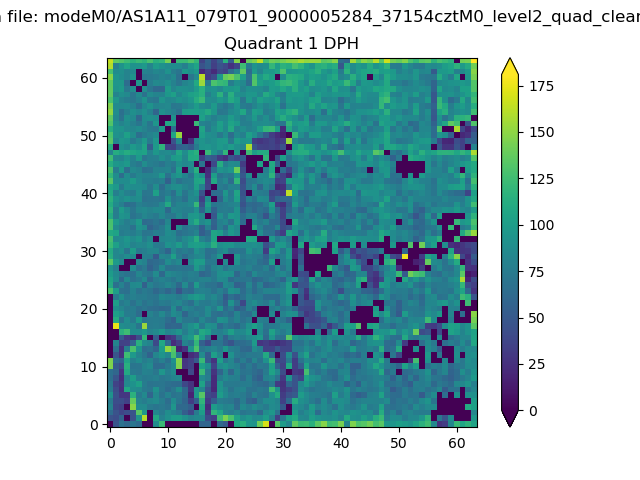 |
Quadrant B |
|---|---|---|---|
| Quadrant D | 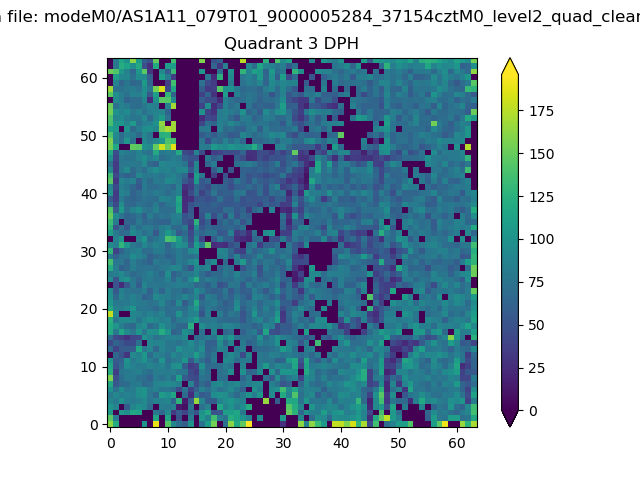 |
 |
Quadrant C |
| Plot type | Count rate plots | Images |
|---|---|---|
| Comparison with Poisson distribution Blue bars denote a histogram of data divided into 1 sec bins. Red curve is a Poisson curve with rate = median count rate of data. |
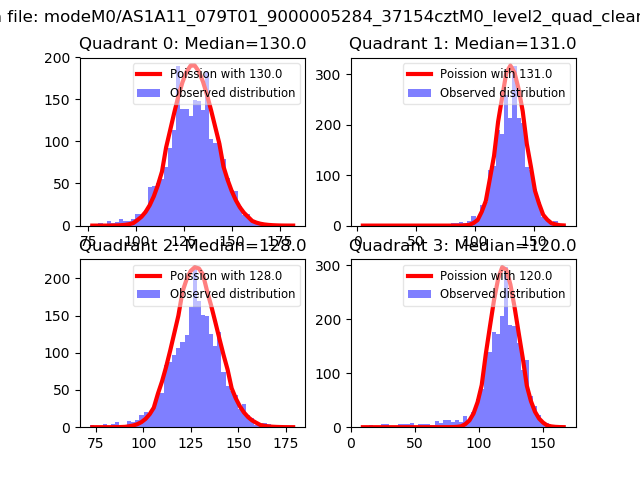 |
 |
| Quadrant-wise count rates Data is divided into 100 sec bins |
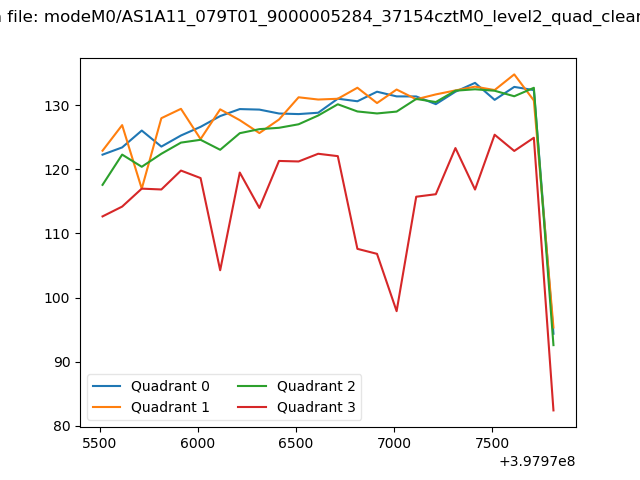 |
|
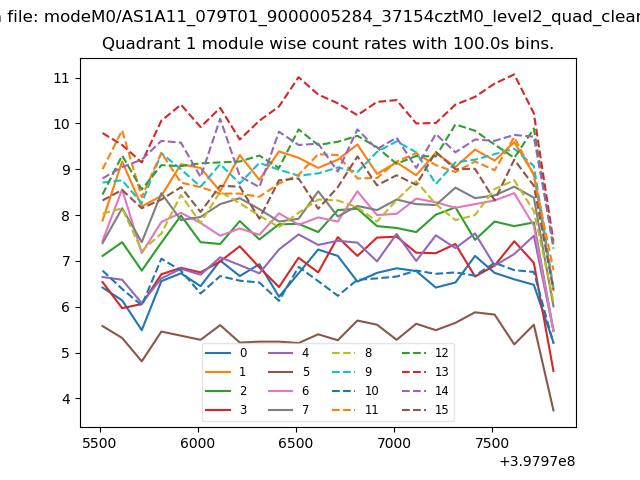
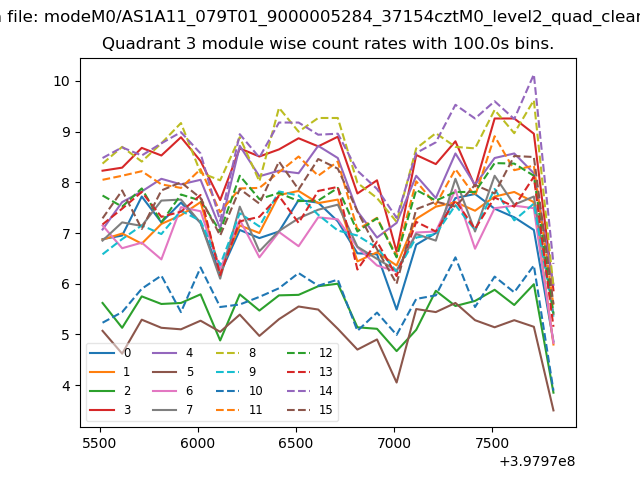
| Module-wise count rates for Quadrant A Data is divided into 100 sec bins |
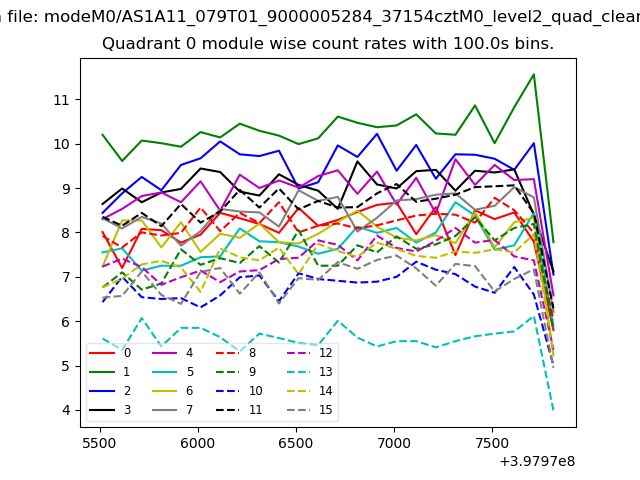 |
 |
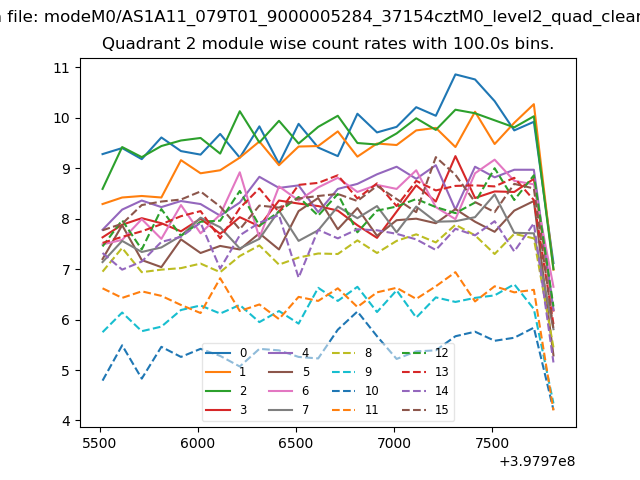
| Module-wise count rates for Quadrant B Data is divided into 100 sec bins |
 |
 |
| Module-wise count rates for Quadrant C Data is divided into 100 sec bins |
 |
 |
| Module-wise count rates for Quadrant D Data is divided into 100 sec bins |
 |
 |
| Parameter | Plot |
|---|---|
| CZT HV Monitor | 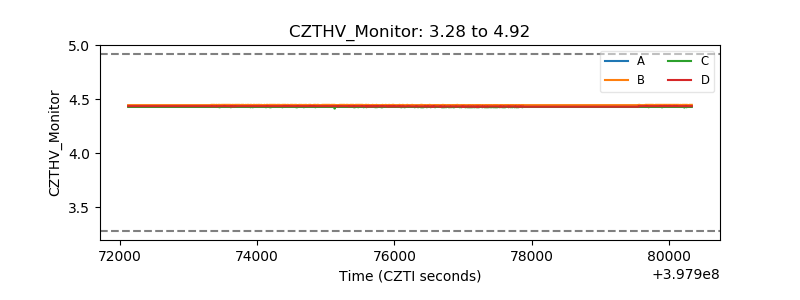 |
| D_VDD | 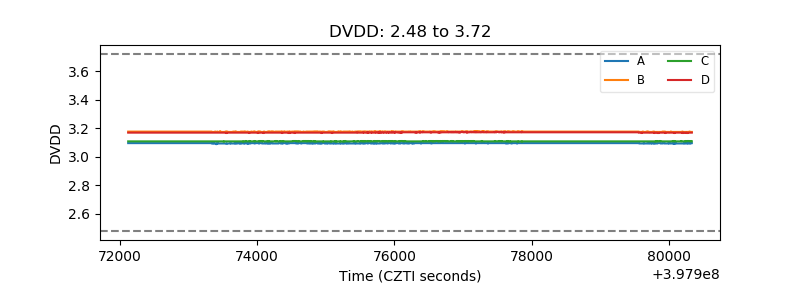 |
| Temperature 1 | 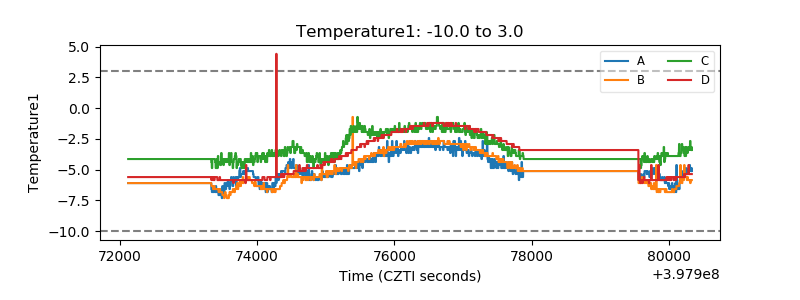 |
| Veto HV Monitor | 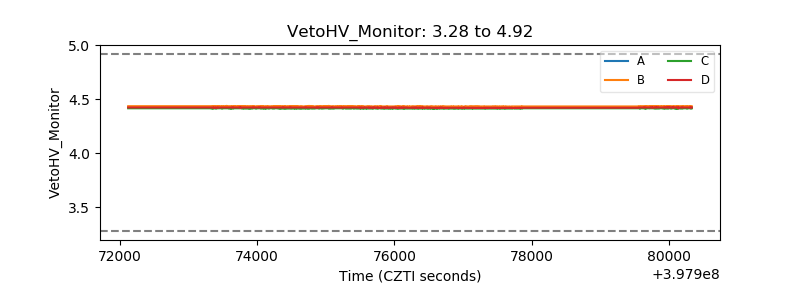 |
| Veto LLD | 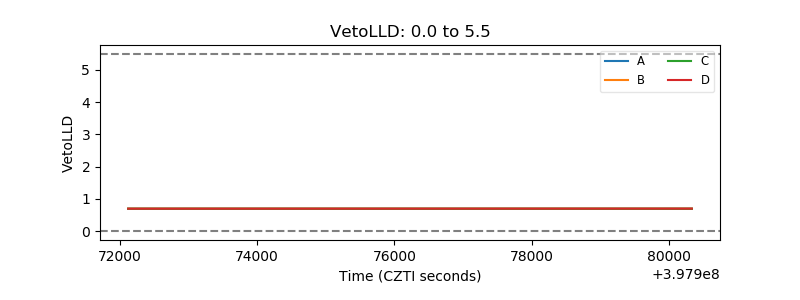 |
| Alpha Counter | 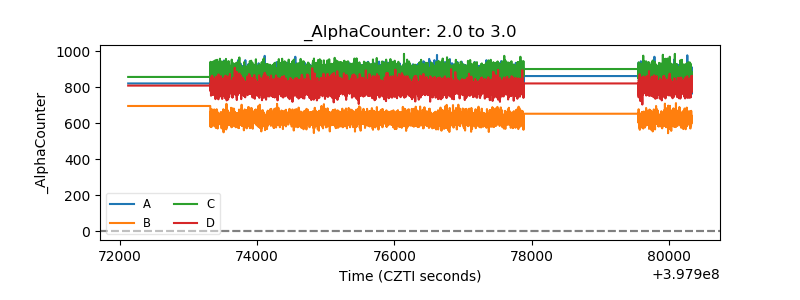 |
| _CPM_Rate | 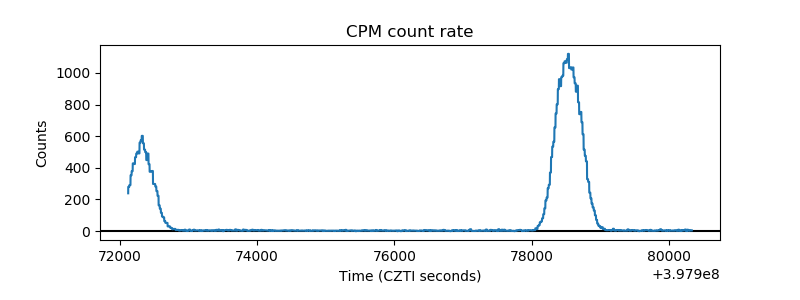 |
| CZT Counter | 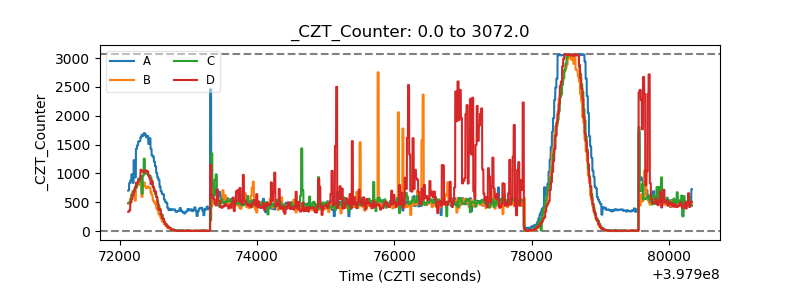 |
| +2.5 Volts monitor | 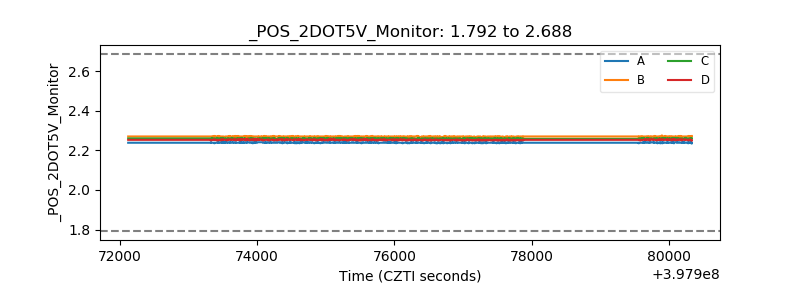 |
| +5 Volts monitor | 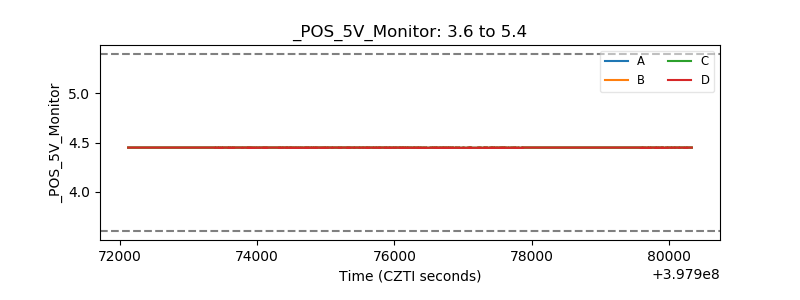 |
| _ROLL_ROT | 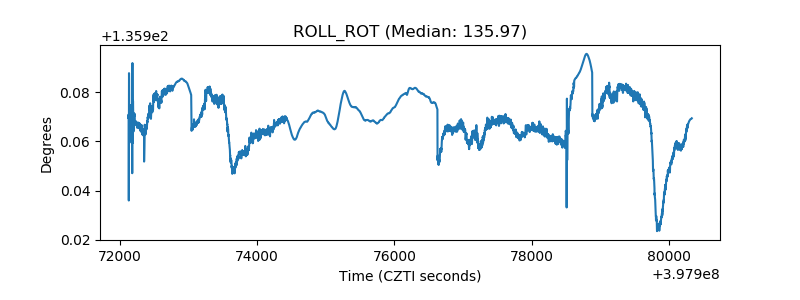 |
| _Roll_DEC | 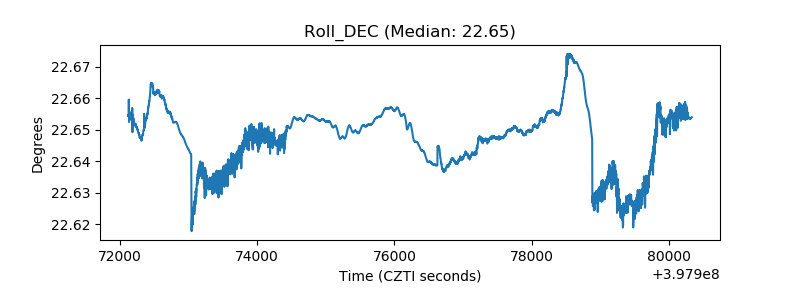 |
| _Roll_RA | 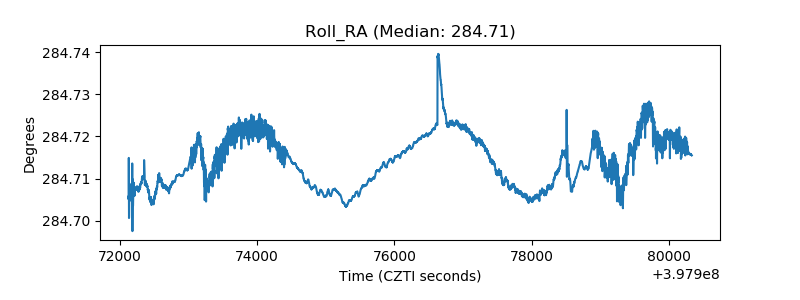 |
| Veto Counter | 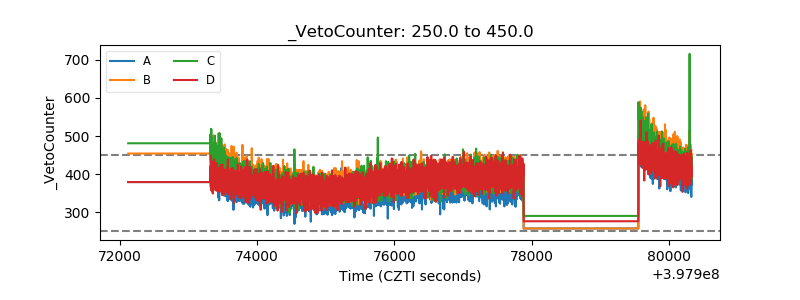 |