| Param | Original file | Final file |
|---|---|---|
| Filename | modeM0/AS1A11_079T01_9000005284_37157cztM0_level2.evt | modeM0/AS1A11_079T01_9000005284_37157cztM0_level2_quad_clean.evt |
| Size (bytes) | 395,798,400 | 64,728,000 |
| Size | 377.5 MB | 61.7 MB |
| Events in quadrant A | 2,829,155 | 408,023 |
| Events in quadrant B | 2,904,461 | 409,985 |
| Events in quadrant C | 2,799,479 | 401,134 |
| Events in quadrant D | 3,099,444 | 375,681 |
| Mode M9 | |||
|---|---|---|---|
| Quadrant | BADHDUFLAG | Total packets | Discarded packets |
| A | 0 | 35 | 0 |
| B | 0 | 35 | 0 |
| C | 0 | 35 | 0 |
| D | 0 | 36 | 0 |
| Mode SS | |||
|---|---|---|---|
| Quadrant | BADHDUFLAG | Total packets | Discarded packets |
| A | 0 | 106 | 0 |
| B | 0 | 106 | 0 |
| C | 0 | 106 | 0 |
| D | 0 | 106 | 0 |
| Mode M0 | |||
|---|---|---|---|
| Quadrant | BADHDUFLAG | Total packets | Discarded packets |
| A | 0 | 11455 | 3 |
| B | 0 | 11628 | 2 |
| C | 0 | 11160 | 2 |
| D | 0 | 12351 | 2 |
| Quadrant | Total seconds | Saturated seconds | Saturation percentage |
|---|---|---|---|
| A | 5211 | 11 | 0.211092% |
| B | 5211 | 85 | 1.631165% |
| C | 5211 | 9 | 0.172712% |
| D | 5211 | 109 | 2.091729% |
Noise dominated data is calculated using 1-second bins in cleaned event files. If a bin has >2000 counts, and if more than 50% of those come from <1% of pixels, then it is considered to be noise-dominated and hence unusable.
| Quadrant | # 1 sec bins | Bins with >0 counts | Bins with >2000 counts | High rate bins dominated by noise | Noise dominated (total time) | Noise dominated (detector-on time) | Marked lightcurve |
|---|---|---|---|---|---|---|---|
| A | 7153 | 5212 | 2 | 2 | 0.03% | 0.04% | 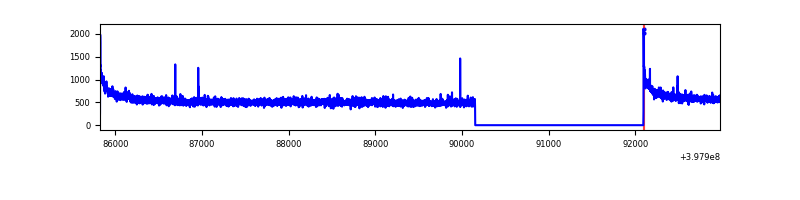 |
| B | 7153 | 5212 | 48 | 48 | 0.67% | 0.92% | 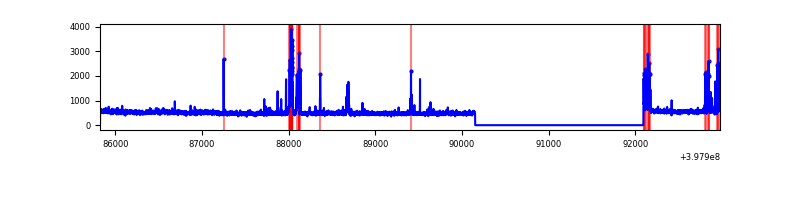 |
| C | 7153 | 5212 | 5 | 5 | 0.07% | 0.10% | 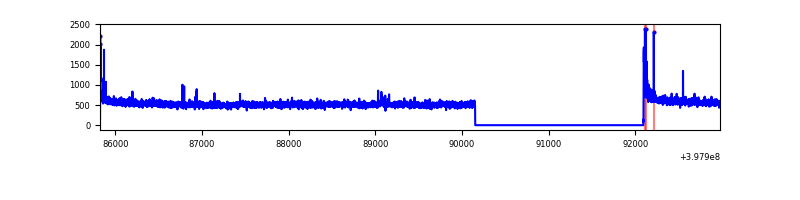 |
| D | 7153 | 5212 | 87 | 87 | 1.22% | 1.67% | 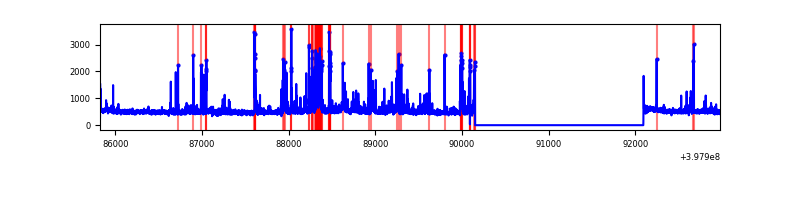 |
Top three noisy pixels from each quadrant. If the there are fewer than three noisy pixels in the level2.evt file, extra rows are filled as -1
| Pixel properties | Quadrant properties | ||||||
|---|---|---|---|---|---|---|---|
| Quadrant | DetID | PixID | Counts | Sigma | Mean | Median | Sigma |
| A | 10 | 83 | 250132 | 1884.06 | 663 | 651 | 132.4 |
| A | 9 | 143 | 7926 | 54.94 | 663 | 651 | 132.4 |
| A | 13 | 254 | 7375 | 50.78 | 663 | 651 | 132.4 |
| B | 5 | 172 | 290236 | 2341.76 | 652 | 638 | 123.7 |
| B | 5 | 200 | 24419 | 192.3 | 652 | 638 | 123.7 |
| B | 12 | 111 | 15184 | 117.62 | 652 | 638 | 123.7 |
| C | 15 | 214 | 243814 | 1668.18 | 635 | 641 | 145.8 |
| C | 0 | 10 | 62525 | 424.53 | 635 | 641 | 145.8 |
| C | 14 | 254 | 8185 | 51.75 | 635 | 641 | 145.8 |
| D | 2 | 249 | 310084 | 2017.63 | 634 | 618 | 153.4 |
| D | 2 | 153 | 79929 | 517.08 | 634 | 618 | 153.4 |
| D | 12 | 235 | 50997 | 328.46 | 634 | 618 | 153.4 |
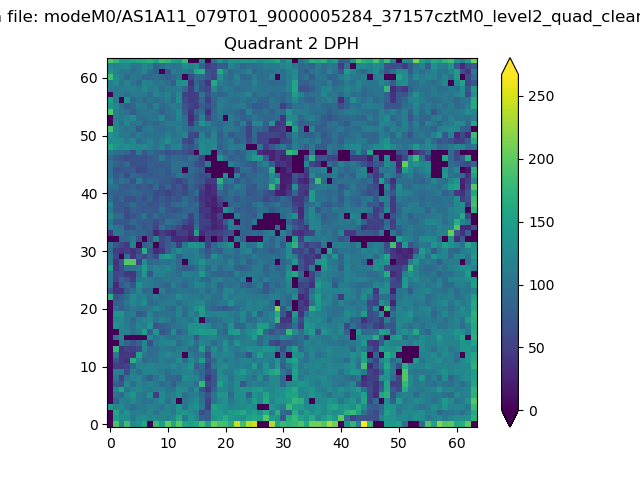
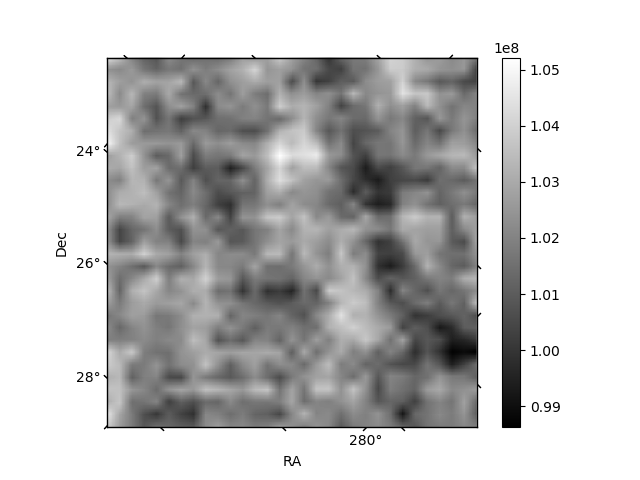
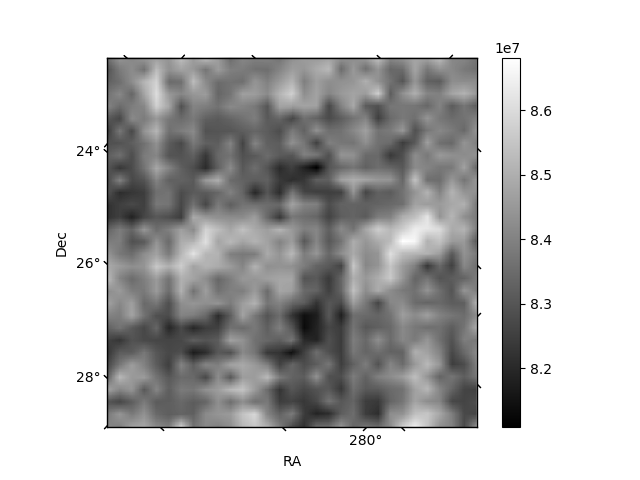
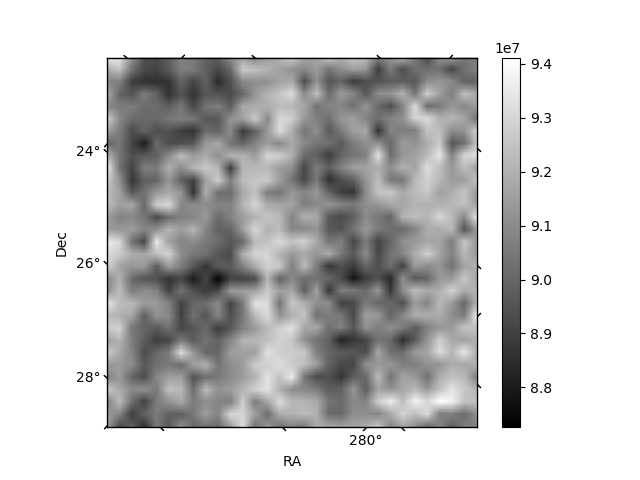
Histogram calculated using DETX and DETY for each event in the final _common_clean file
| Quadrant A | 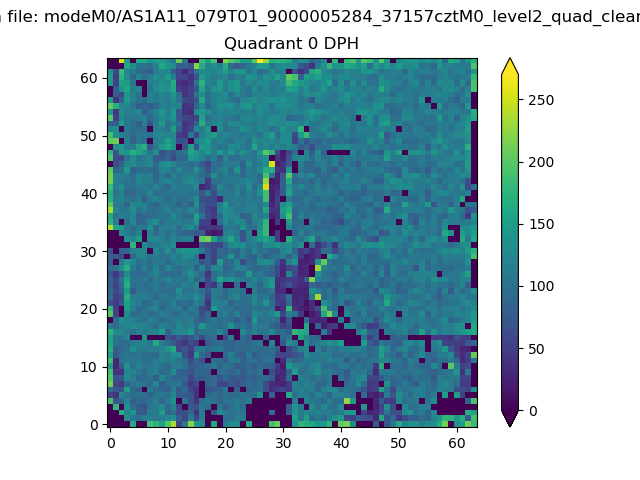 |
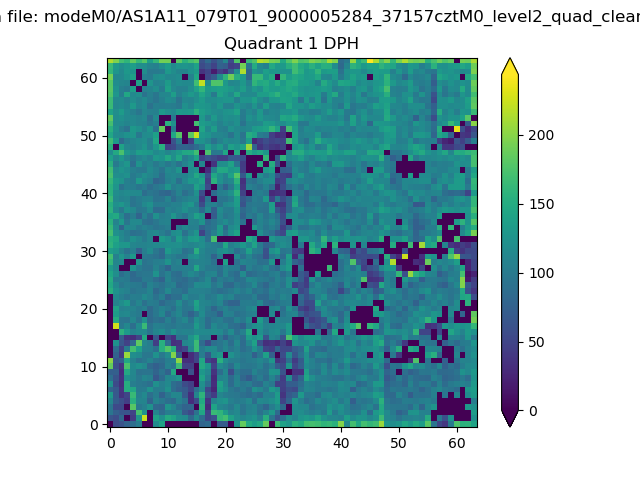 |
Quadrant B |
|---|---|---|---|
| Quadrant D | 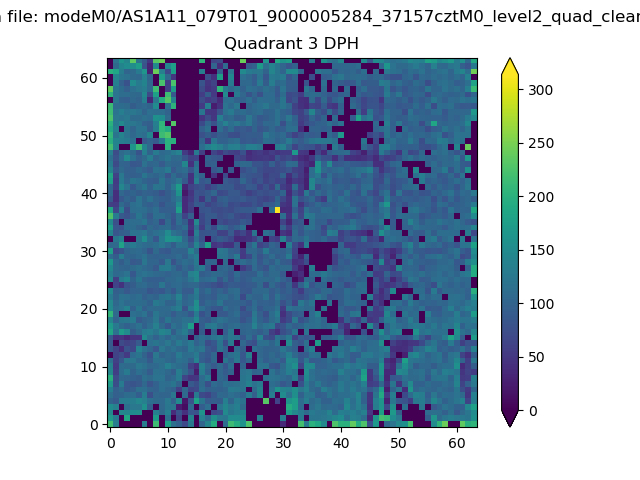 |
 |
Quadrant C |
| Plot type | Count rate plots | Images |
|---|---|---|
| Comparison with Poisson distribution Blue bars denote a histogram of data divided into 1 sec bins. Red curve is a Poisson curve with rate = median count rate of data. |
 |
 |
| Quadrant-wise count rates Data is divided into 100 sec bins |
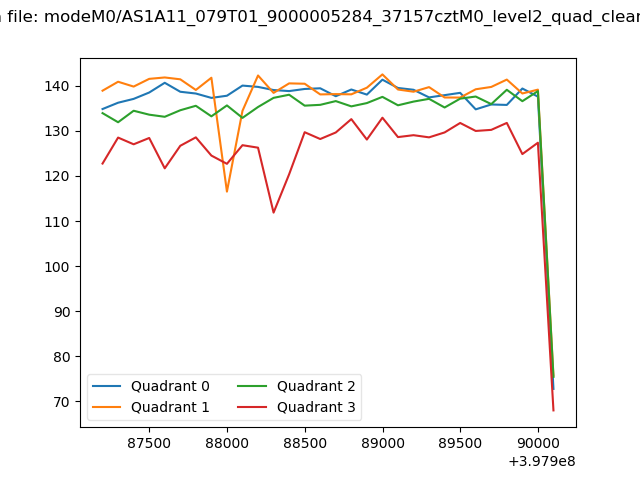 |
|
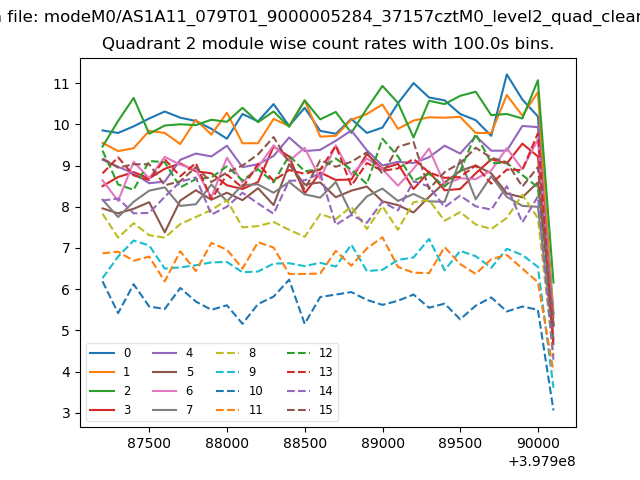
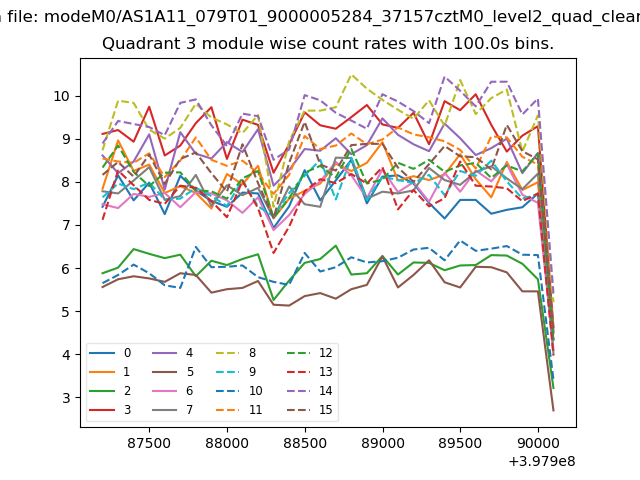
| Module-wise count rates for Quadrant A Data is divided into 100 sec bins |
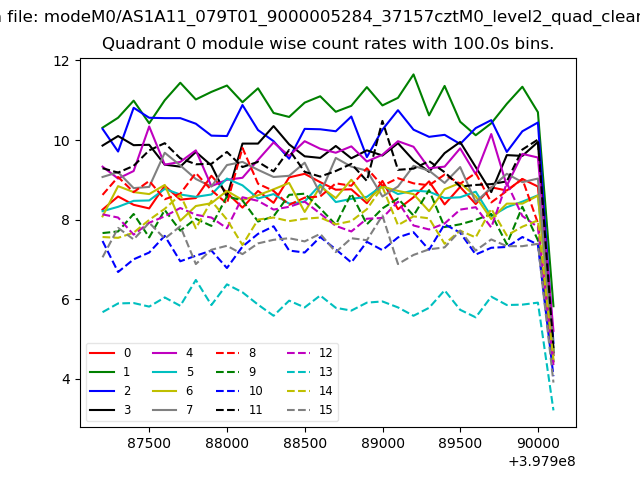 |
 |
| Module-wise count rates for Quadrant B Data is divided into 100 sec bins |
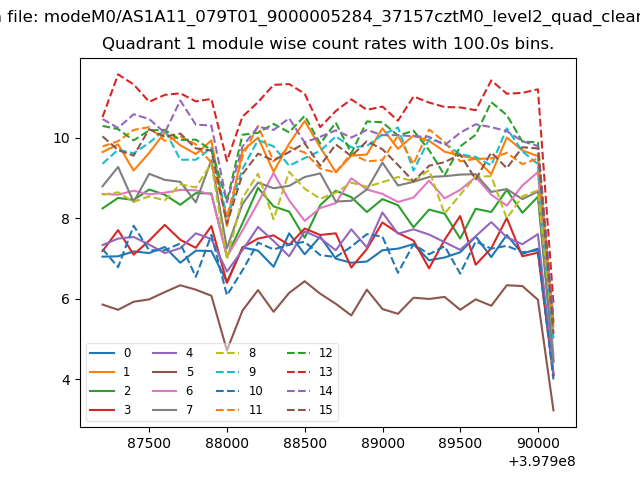 |
 |
| Module-wise count rates for Quadrant C Data is divided into 100 sec bins |
 |
 |
| Module-wise count rates for Quadrant D Data is divided into 100 sec bins |
 |
 |
| Parameter | Plot |
|---|---|
| CZT HV Monitor | 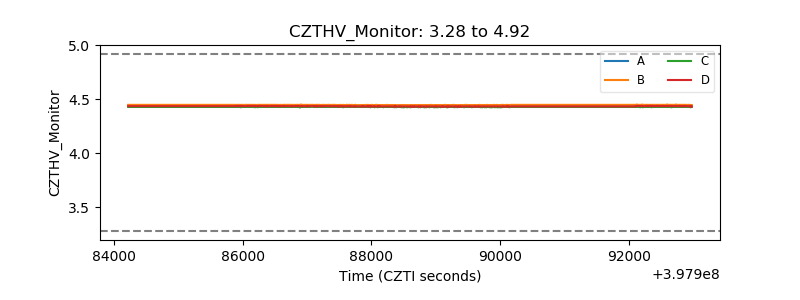 |
| D_VDD | 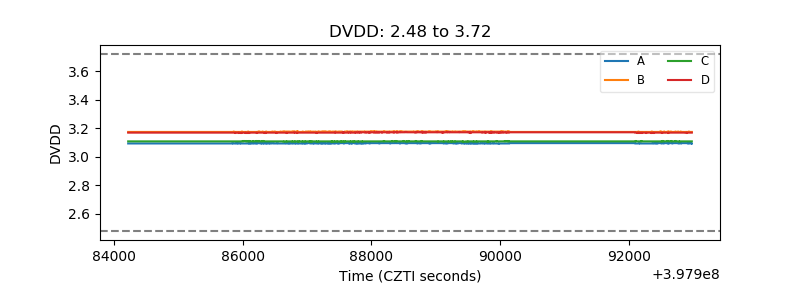 |
| Temperature 1 | 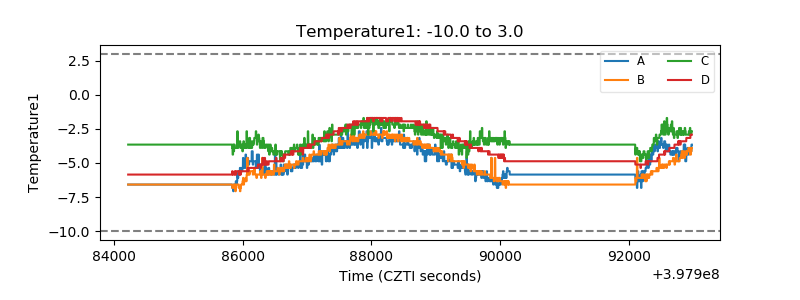 |
| Veto HV Monitor |  |
| Veto LLD | 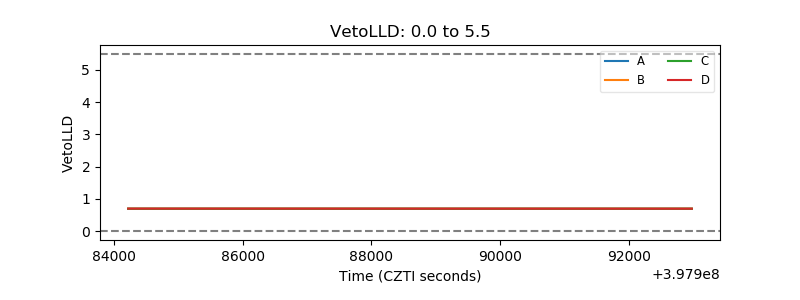 |
| Alpha Counter |  |
| _CPM_Rate |  |
| CZT Counter | 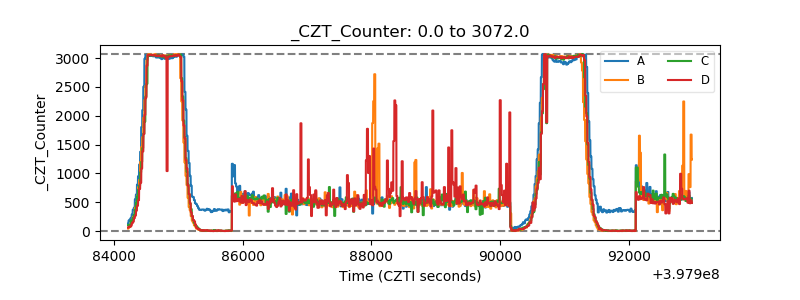 |
| +2.5 Volts monitor | 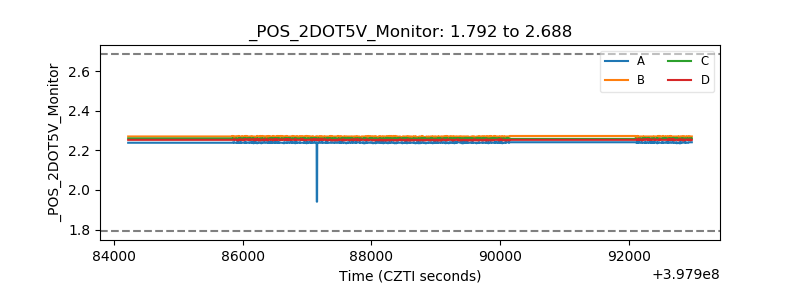 |
| +5 Volts monitor |  |
| _ROLL_ROT | 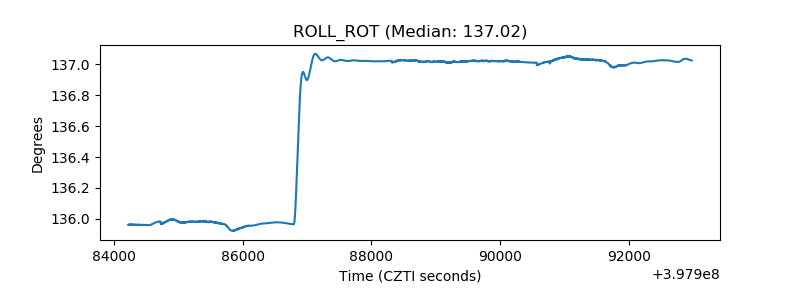 |
| _Roll_DEC | 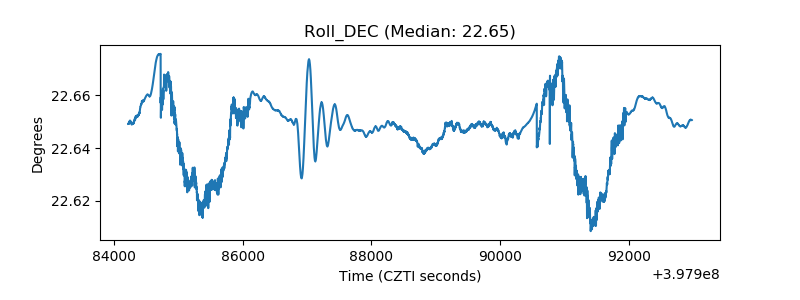 |
| _Roll_RA | 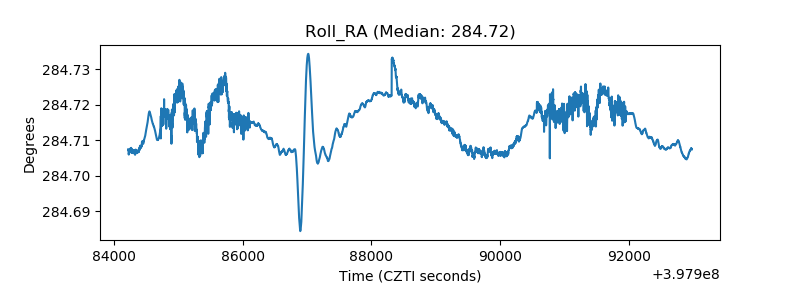 |
| Veto Counter | 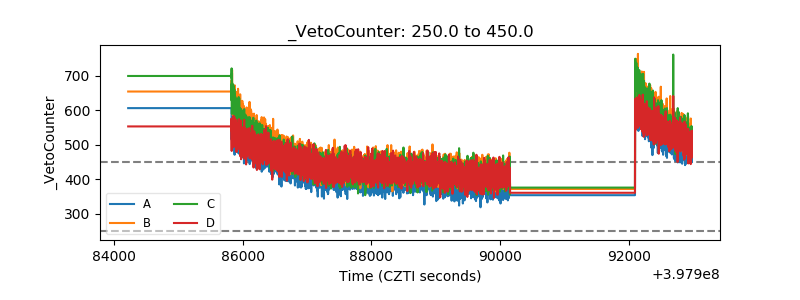 |