| Param | Original file | Final file |
|---|---|---|
| Filename | modeM0/AS1A11_079T01_9000005284_37158cztM0_level2.evt | modeM0/AS1A11_079T01_9000005284_37158cztM0_level2_quad_clean.evt |
| Size (bytes) | 427,331,520 | 77,253,120 |
| Size | 407.5 MB | 73.7 MB |
| Events in quadrant A | 2,866,763 | 515,171 |
| Events in quadrant B | 2,923,707 | 514,657 |
| Events in quadrant C | 2,807,333 | 501,332 |
| Events in quadrant D | 4,004,371 | 457,234 |
| Mode M9 | |||
|---|---|---|---|
| Quadrant | BADHDUFLAG | Total packets | Discarded packets |
| A | 0 | 31 | 0 |
| B | 0 | 31 | 0 |
| C | 0 | 31 | 0 |
| D | 0 | 32 | 0 |
| Mode SS | |||
|---|---|---|---|
| Quadrant | BADHDUFLAG | Total packets | Discarded packets |
| A | 0 | 104 | 0 |
| B | 0 | 104 | 0 |
| C | 0 | 104 | 0 |
| D | 0 | 104 | 0 |
| Mode M0 | |||
|---|---|---|---|
| Quadrant | BADHDUFLAG | Total packets | Discarded packets |
| A | 0 | 11457 | 3 |
| B | 0 | 11583 | 2 |
| C | 0 | 11113 | 2 |
| D | 0 | 14939 | 2 |
| Quadrant | Total seconds | Saturated seconds | Saturation percentage |
|---|---|---|---|
| A | 4994 | 20 | 0.400481% |
| B | 4994 | 83 | 1.661994% |
| C | 4994 | 25 | 0.500601% |
| D | 4994 | 379 | 7.589107% |
Noise dominated data is calculated using 1-second bins in cleaned event files. If a bin has >2000 counts, and if more than 50% of those come from <1% of pixels, then it is considered to be noise-dominated and hence unusable.
| Quadrant | # 1 sec bins | Bins with >0 counts | Bins with >2000 counts | High rate bins dominated by noise | Noise dominated (total time) | Noise dominated (detector-on time) | Marked lightcurve |
|---|---|---|---|---|---|---|---|
| A | 7027 | 4995 | 11 | 11 | 0.16% | 0.22% | 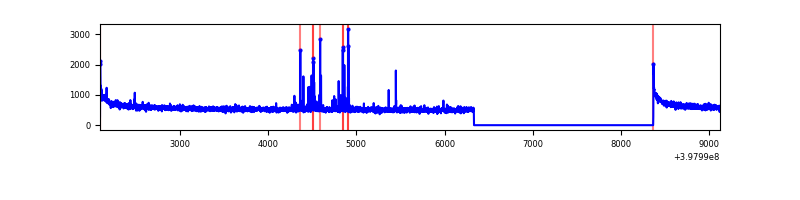 |
| B | 7027 | 4995 | 55 | 55 | 0.78% | 1.10% | 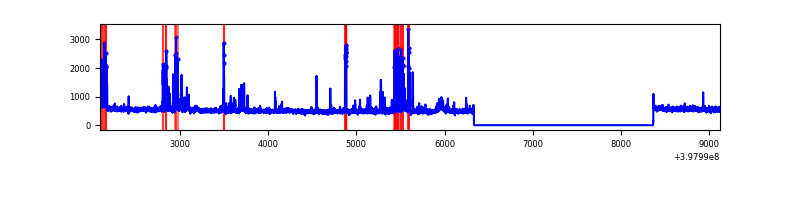 |
| C | 7027 | 4995 | 22 | 22 | 0.31% | 0.44% | 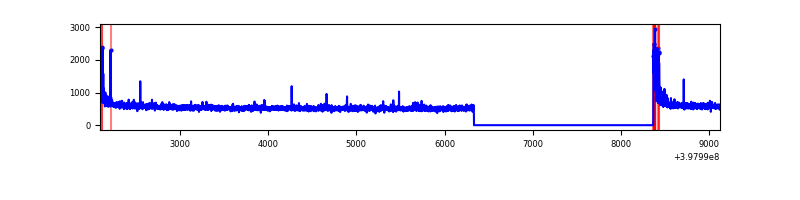 |
| D | 7027 | 4995 | 394 | 394 | 5.61% | 7.89% | 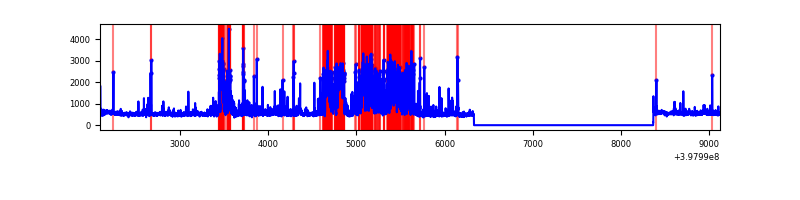 |
Top three noisy pixels from each quadrant. If the there are fewer than three noisy pixels in the level2.evt file, extra rows are filled as -1
| Pixel properties | Quadrant properties | ||||||
|---|---|---|---|---|---|---|---|
| Quadrant | DetID | PixID | Counts | Sigma | Mean | Median | Sigma |
| A | 10 | 83 | 251271 | 1928.12 | 656 | 645 | 130.0 |
| A | 13 | 248 | 67909 | 517.48 | 656 | 645 | 130.0 |
| A | 13 | 254 | 7780 | 54.89 | 656 | 645 | 130.0 |
| B | 5 | 172 | 365316 | 3030.9 | 639 | 626 | 120.3 |
| B | 4 | 232 | 17162 | 137.43 | 639 | 626 | 120.3 |
| B | 12 | 111 | 14674 | 116.75 | 639 | 626 | 120.3 |
| C | 15 | 214 | 228195 | 1567.83 | 623 | 628 | 145.1 |
| C | 0 | 10 | 132367 | 907.62 | 623 | 628 | 145.1 |
| C | 14 | 254 | 13187 | 86.53 | 623 | 628 | 145.1 |
| D | 2 | 249 | 1333636 | 8974.24 | 617 | 603 | 148.5 |
| D | 12 | 235 | 89405 | 597.83 | 617 | 603 | 148.5 |
| D | 13 | 249 | 53853 | 358.49 | 617 | 603 | 148.5 |
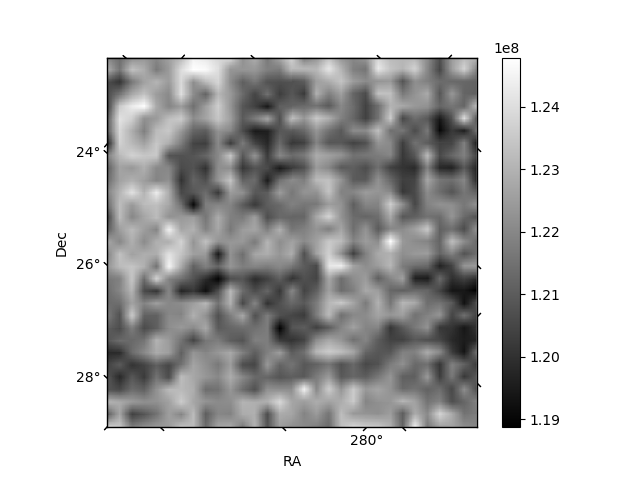
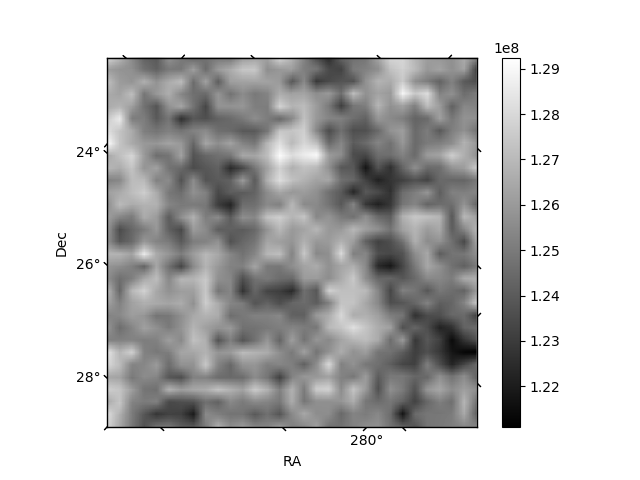
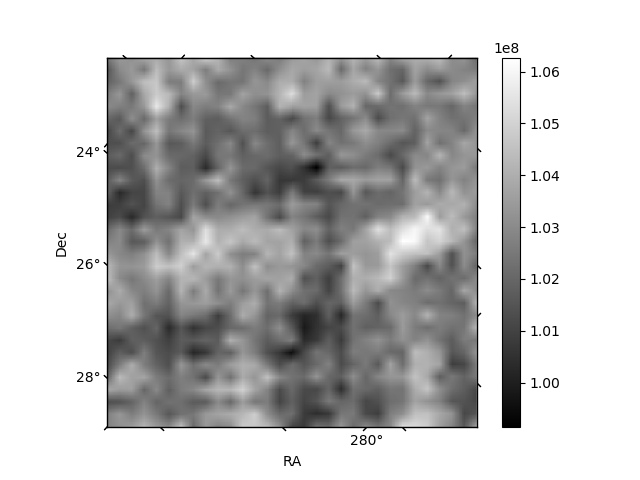
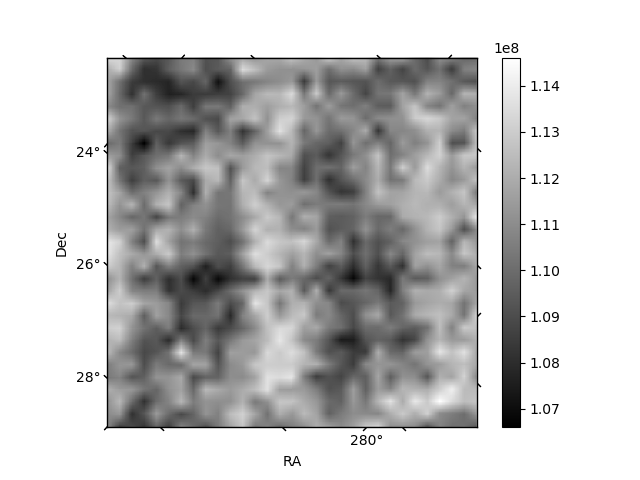
Histogram calculated using DETX and DETY for each event in the final _common_clean file
| Quadrant A | 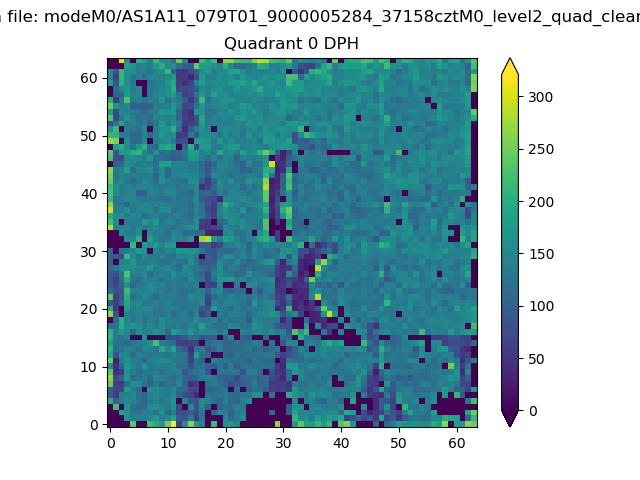 |
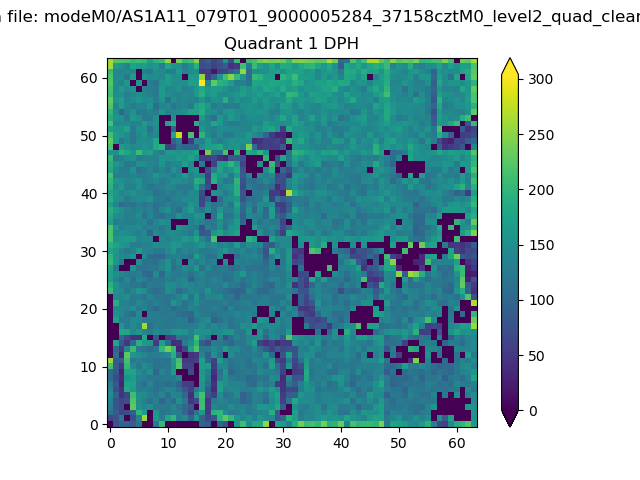 |
Quadrant B |
|---|---|---|---|
| Quadrant D | 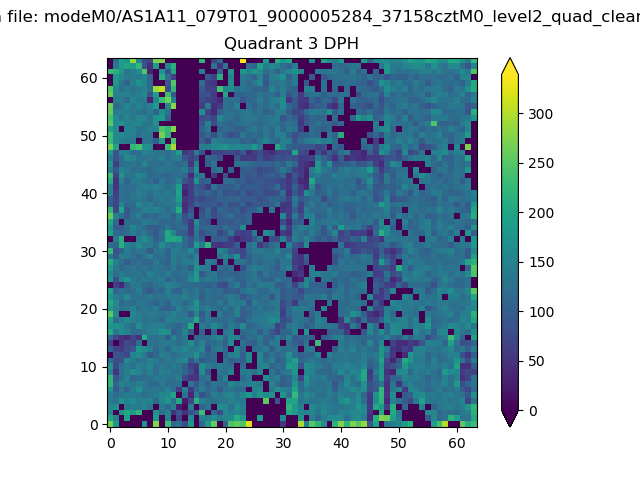 |
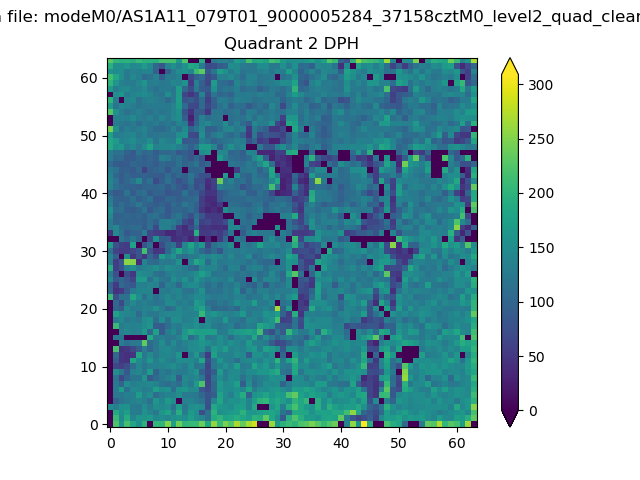 |
Quadrant C |
| Plot type | Count rate plots | Images |
|---|---|---|
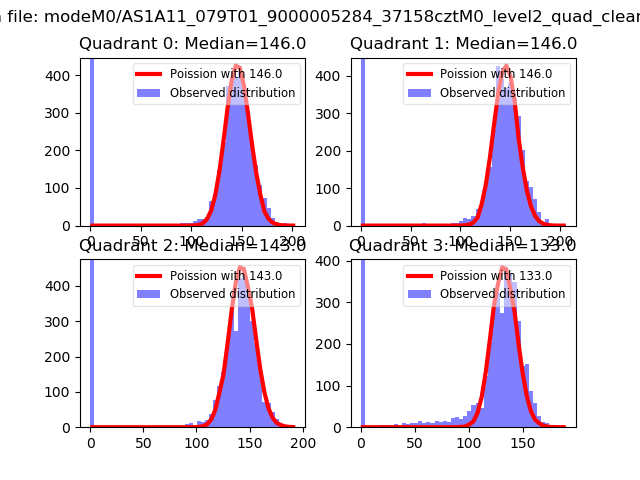
| Comparison with Poisson distribution Blue bars denote a histogram of data divided into 1 sec bins. Red curve is a Poisson curve with rate = median count rate of data. |
 |
 |
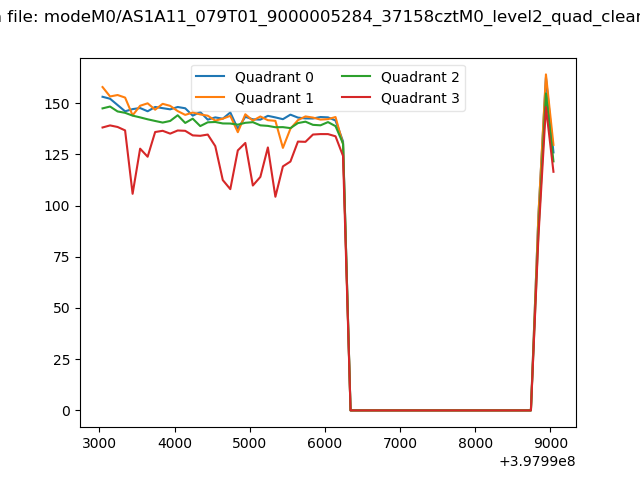
| Quadrant-wise count rates Data is divided into 100 sec bins |
 |
|
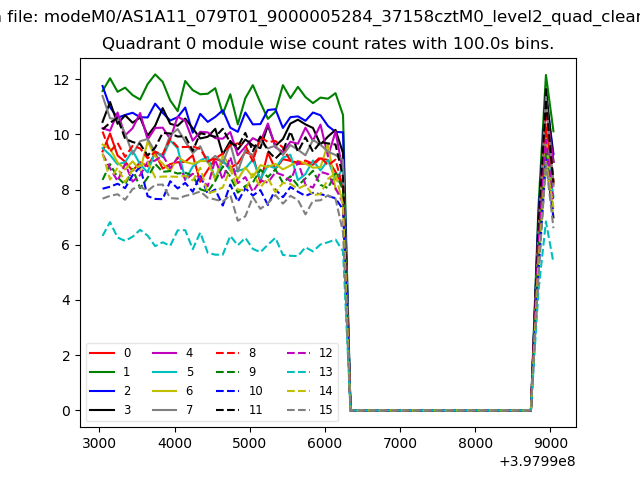
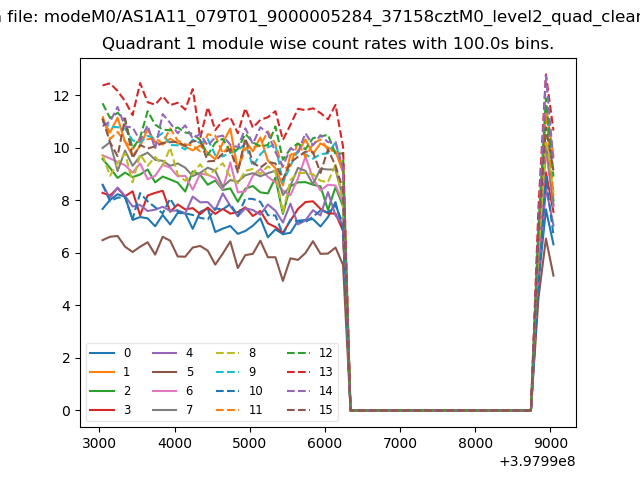
| Module-wise count rates for Quadrant A Data is divided into 100 sec bins |
 |
 |
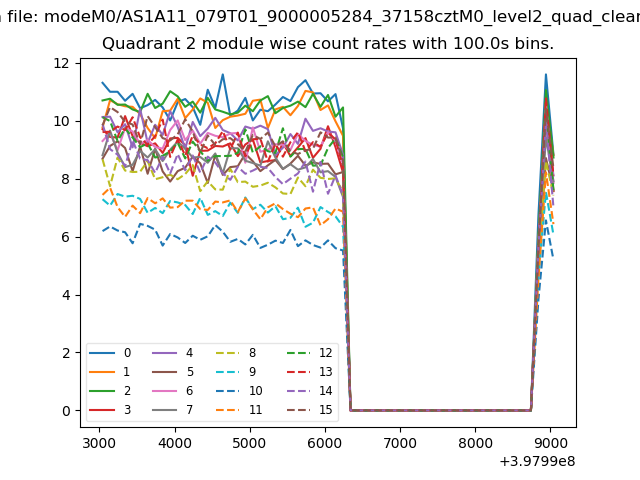
| Module-wise count rates for Quadrant B Data is divided into 100 sec bins |
 |
 |
| Module-wise count rates for Quadrant C Data is divided into 100 sec bins |
 |
 |
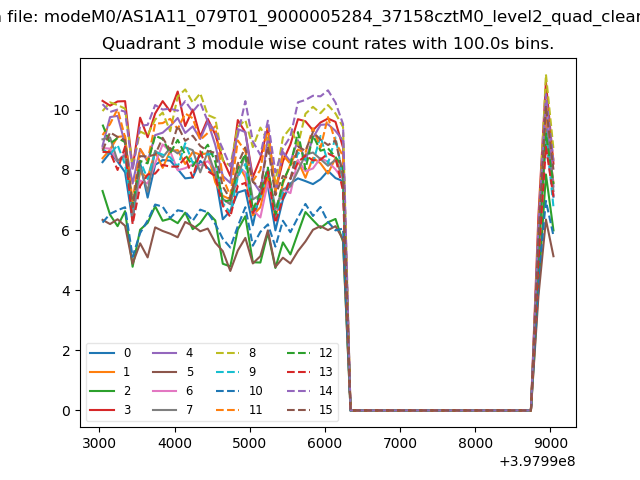
| Module-wise count rates for Quadrant D Data is divided into 100 sec bins |
 |
 |
| Parameter | Plot |
|---|---|
| CZT HV Monitor | 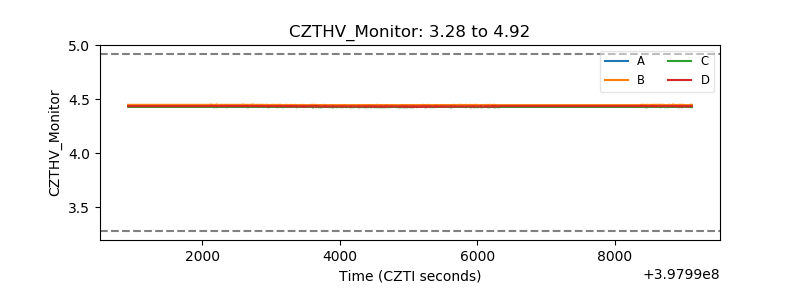 |
| D_VDD | 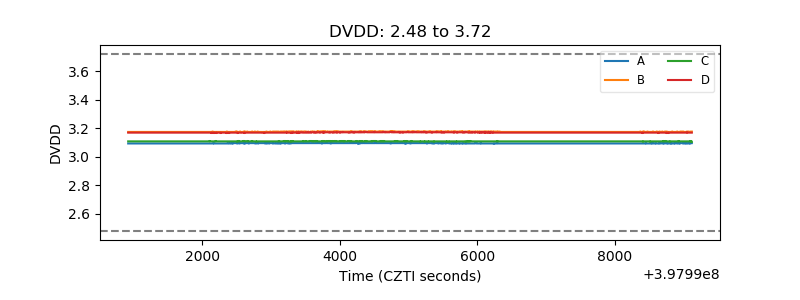 |
| Temperature 1 | 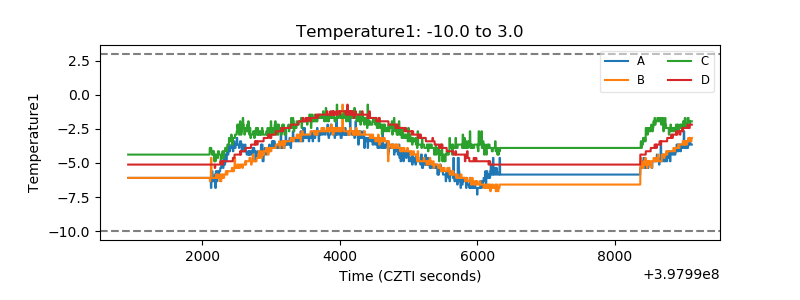 |
| Veto HV Monitor | 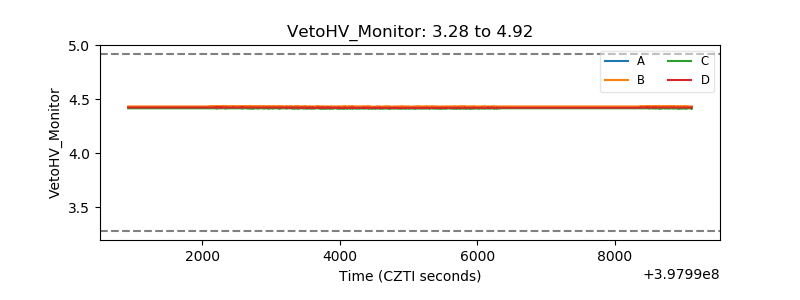 |
| Veto LLD | 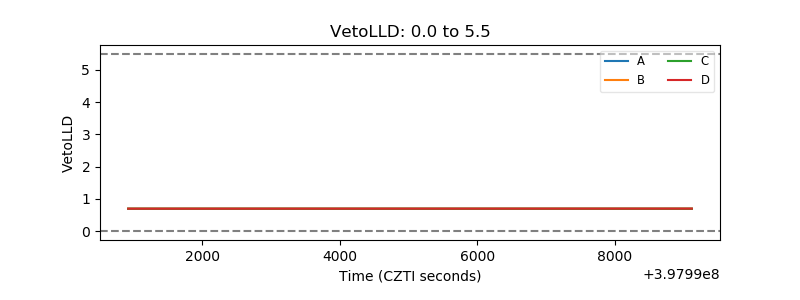 |
| Alpha Counter | 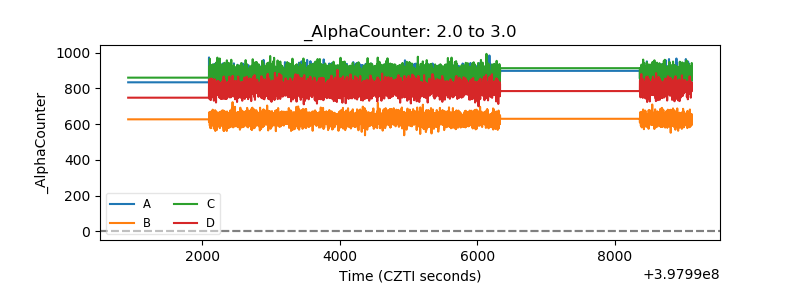 |
| _CPM_Rate | 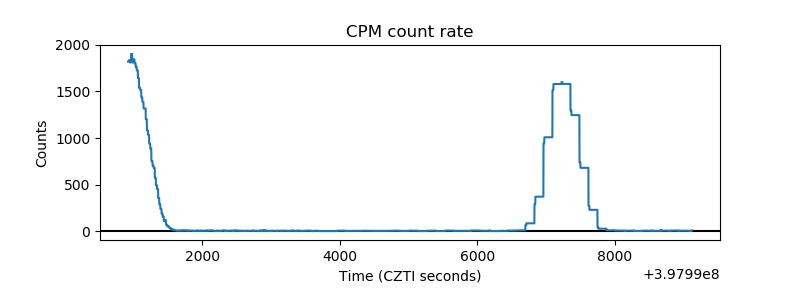 |
| CZT Counter | 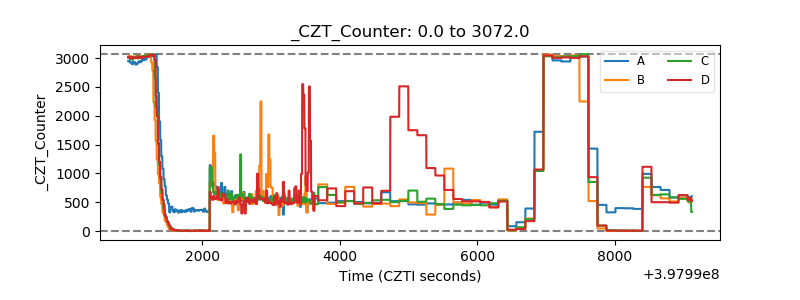 |
| +2.5 Volts monitor | 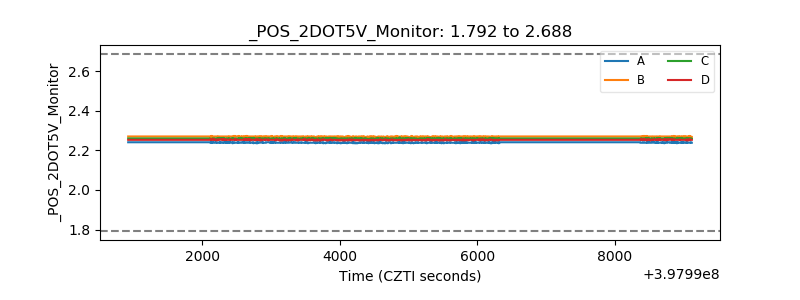 |
| +5 Volts monitor | 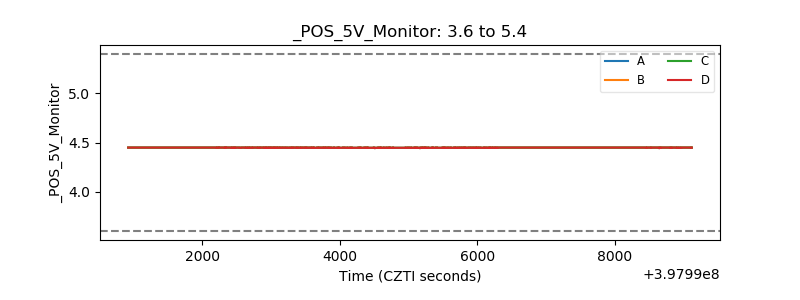 |
| _ROLL_ROT | 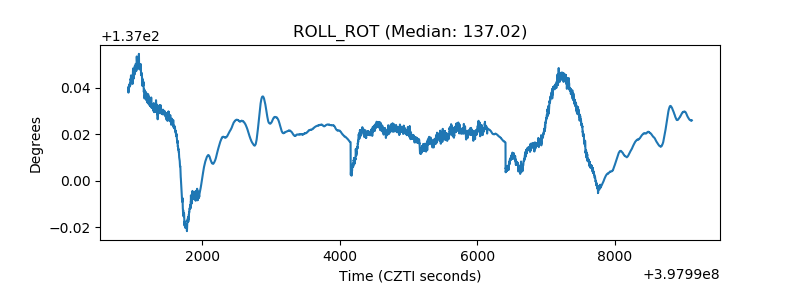 |
| _Roll_DEC | 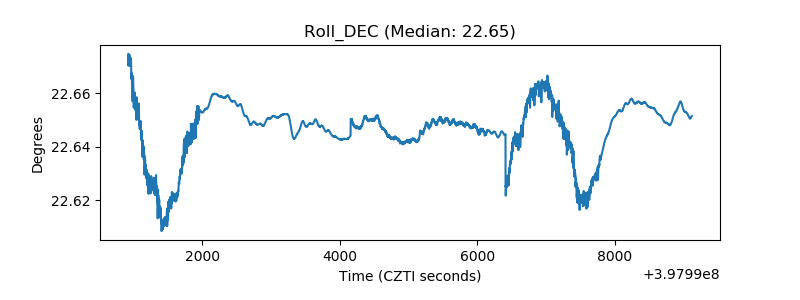 |
| _Roll_RA | 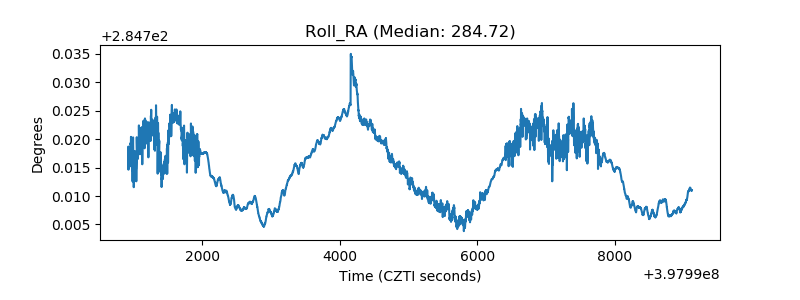 |
| Veto Counter | 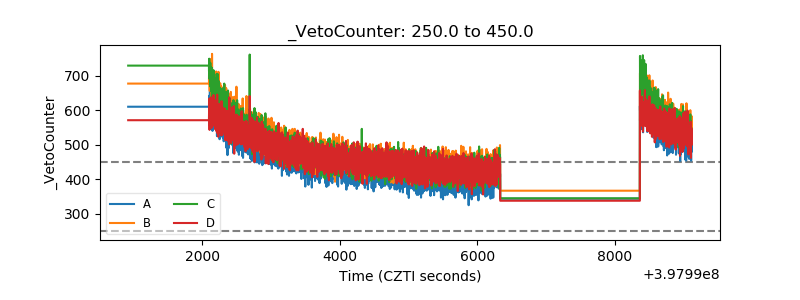 |