| Param | Original file | Final file |
|---|---|---|
| Filename | modeM0/AS1A11_079T01_9000005284_37159cztM0_level2.evt | modeM0/AS1A11_079T01_9000005284_37159cztM0_level2_quad_clean.evt |
| Size (bytes) | 424,774,080 | 100,920,960 |
| Size | 405.1 MB | 96.2 MB |
| Events in quadrant A | 2,988,803 | 689,638 |
| Events in quadrant B | 2,969,557 | 688,114 |
| Events in quadrant C | 3,068,202 | 674,572 |
| Events in quadrant D | 3,477,026 | 632,221 |
| Mode M9 | |||
|---|---|---|---|
| Quadrant | BADHDUFLAG | Total packets | Discarded packets |
| A | 0 | 42 | 0 |
| B | 0 | 42 | 0 |
| C | 0 | 42 | 0 |
| D | 0 | 42 | 0 |
| Mode SS | |||
|---|---|---|---|
| Quadrant | BADHDUFLAG | Total packets | Discarded packets |
| A | 0 | 110 | 0 |
| B | 0 | 110 | 0 |
| C | 0 | 110 | 0 |
| D | 0 | 110 | 0 |
| Mode M0 | |||
|---|---|---|---|
| Quadrant | BADHDUFLAG | Total packets | Discarded packets |
| A | 0 | 12038 | 3 |
| B | 0 | 11999 | 2 |
| C | 0 | 12115 | 2 |
| D | 0 | 13590 | 2 |
| Quadrant | Total seconds | Saturated seconds | Saturation percentage |
|---|---|---|---|
| A | 5313 | 12 | 0.225861% |
| B | 5313 | 62 | 1.166949% |
| C | 5313 | 51 | 0.959910% |
| D | 5313 | 133 | 2.503294% |
Noise dominated data is calculated using 1-second bins in cleaned event files. If a bin has >2000 counts, and if more than 50% of those come from <1% of pixels, then it is considered to be noise-dominated and hence unusable.
| Quadrant | # 1 sec bins | Bins with >0 counts | Bins with >2000 counts | High rate bins dominated by noise | Noise dominated (total time) | Noise dominated (detector-on time) | Marked lightcurve |
|---|---|---|---|---|---|---|---|
| A | 9469 | 5315 | 5 | 5 | 0.05% | 0.09% | 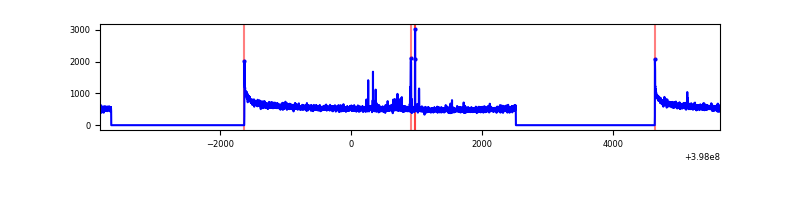 |
| B | 9469 | 5315 | 42 | 42 | 0.44% | 0.79% |  |
| C | 9469 | 5315 | 42 | 42 | 0.44% | 0.79% | 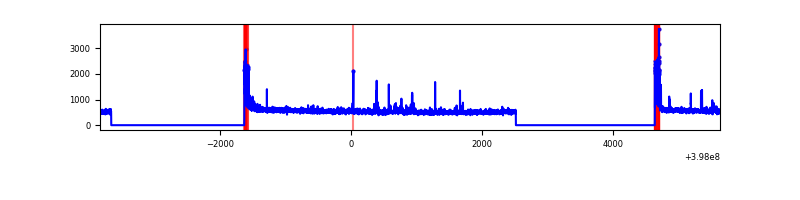 |
| D | 9469 | 5315 | 111 | 111 | 1.17% | 2.09% | 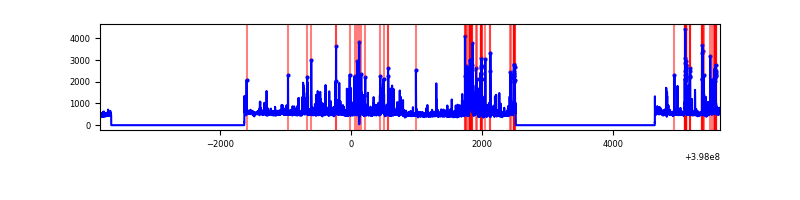 |
Top three noisy pixels from each quadrant. If the there are fewer than three noisy pixels in the level2.evt file, extra rows are filled as -1
| Pixel properties | Quadrant properties | ||||||
|---|---|---|---|---|---|---|---|
| Quadrant | DetID | PixID | Counts | Sigma | Mean | Median | Sigma |
| A | 10 | 83 | 257468 | 1874.92 | 692 | 681 | 137.0 |
| A | 15 | 237 | 41322 | 296.74 | 692 | 681 | 137.0 |
| A | 13 | 254 | 7544 | 50.11 | 692 | 681 | 137.0 |
| B | 0 | 190 | 133101 | 1039.26 | 672 | 658 | 127.4 |
| B | 5 | 172 | 102606 | 799.97 | 672 | 658 | 127.4 |
| B | 5 | 200 | 73340 | 570.32 | 672 | 658 | 127.4 |
| C | 15 | 214 | 229181 | 1498.28 | 659 | 667 | 152.5 |
| C | 0 | 10 | 179223 | 1170.72 | 659 | 667 | 152.5 |
| C | 14 | 254 | 73102 | 474.93 | 659 | 667 | 152.5 |
| D | 2 | 249 | 362545 | 2269.51 | 662 | 647 | 159.5 |
| D | 13 | 249 | 171137 | 1069.17 | 662 | 647 | 159.5 |
| D | 12 | 233 | 70193 | 436.13 | 662 | 647 | 159.5 |
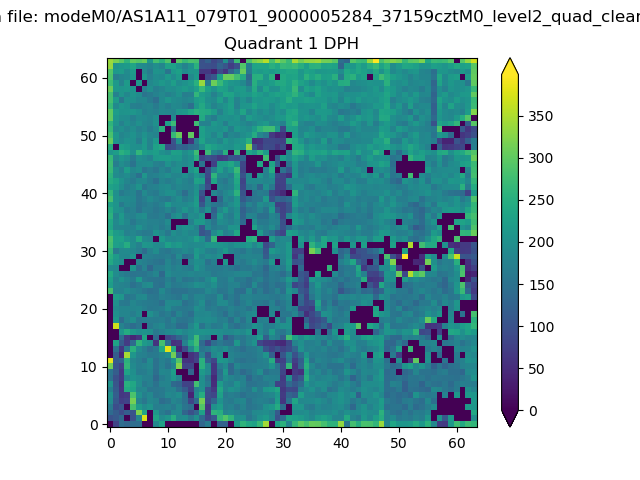
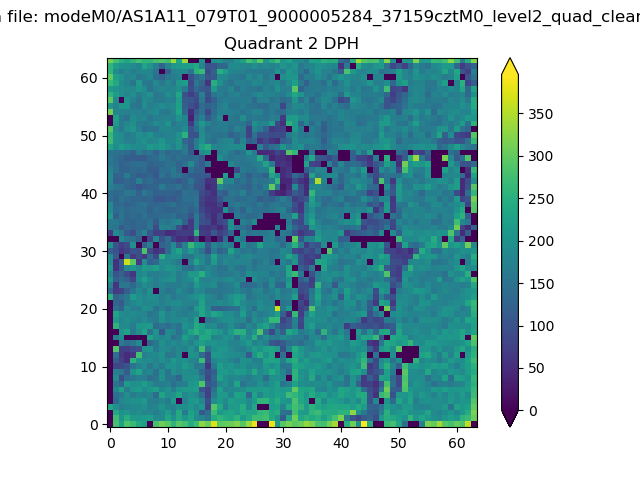
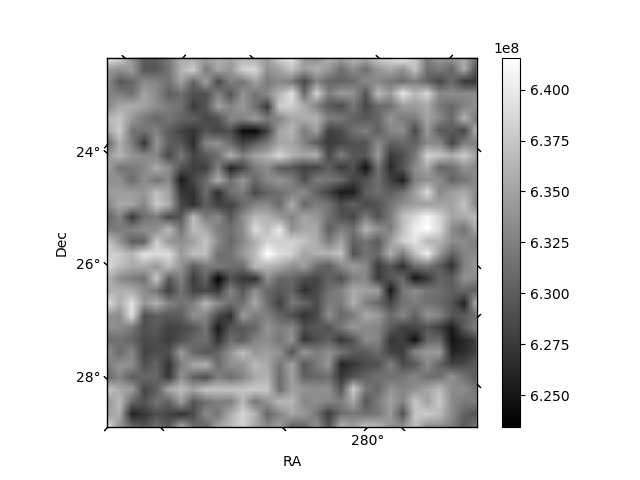
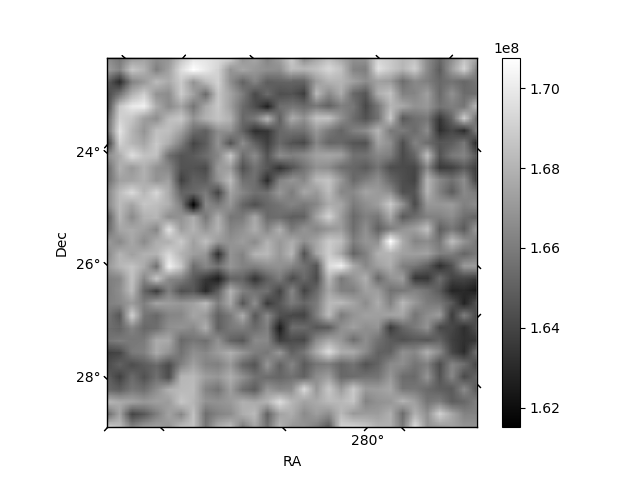
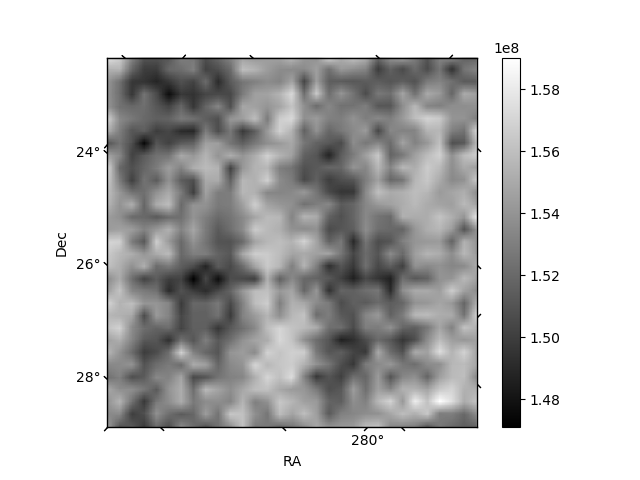
Histogram calculated using DETX and DETY for each event in the final _common_clean file
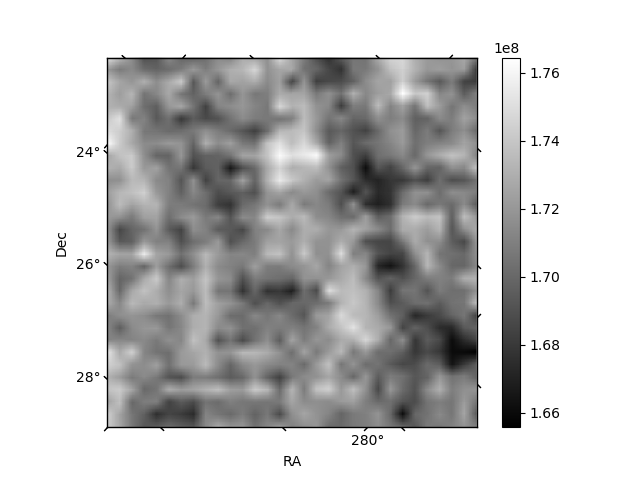
| Quadrant A | 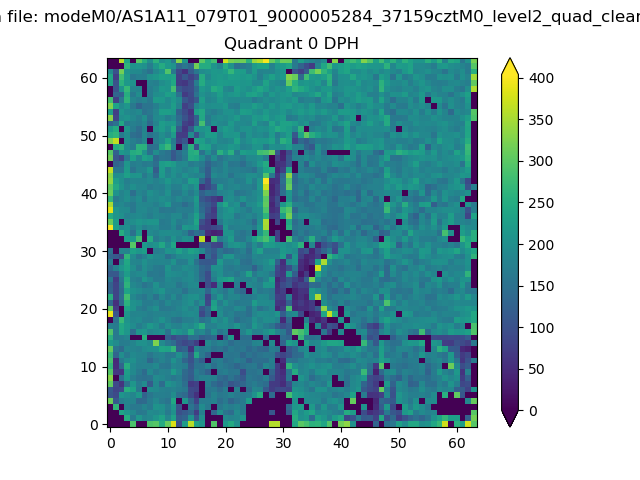 |
 |
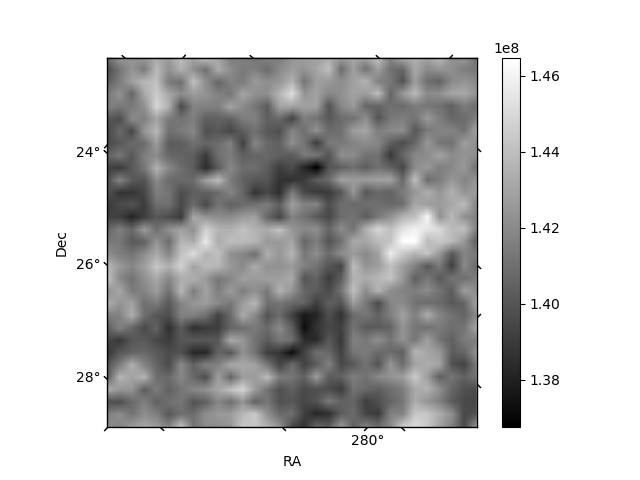
Quadrant B |
|---|---|---|---|
| Quadrant D | 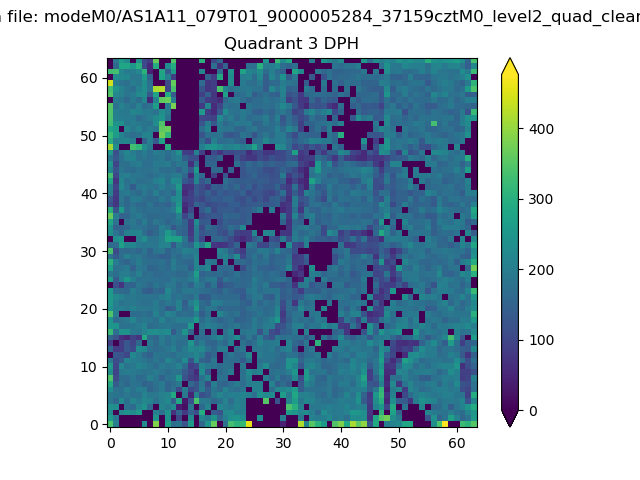 |
 |
Quadrant C |
| Plot type | Count rate plots | Images |
|---|---|---|
| Comparison with Poisson distribution Blue bars denote a histogram of data divided into 1 sec bins. Red curve is a Poisson curve with rate = median count rate of data. |
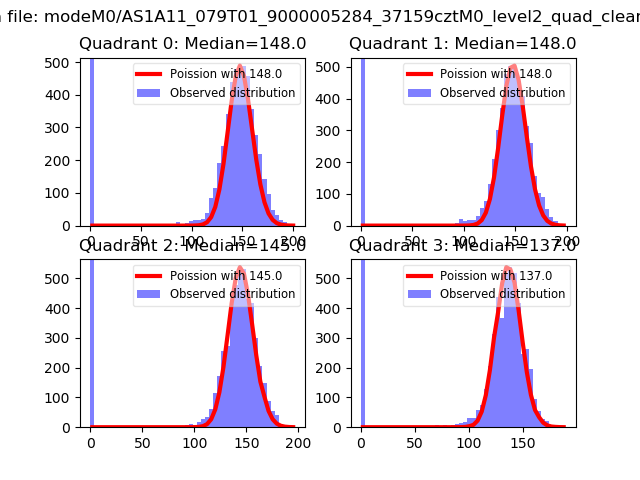 |
 |
| Quadrant-wise count rates Data is divided into 100 sec bins |
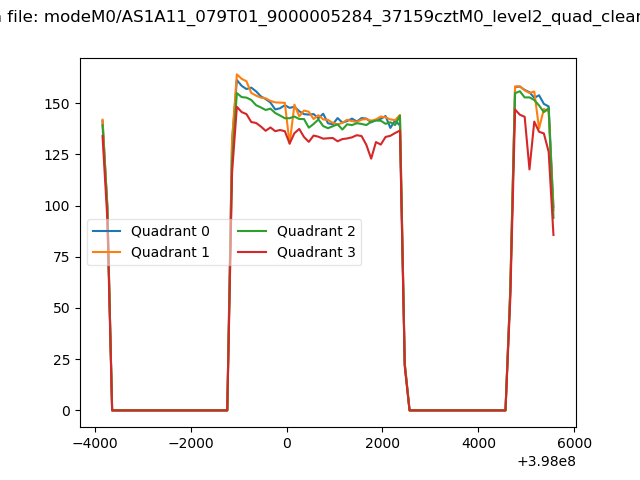 |
|
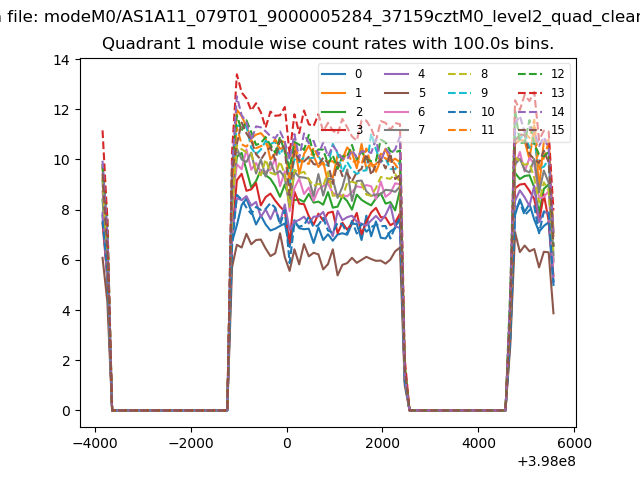
| Module-wise count rates for Quadrant A Data is divided into 100 sec bins |
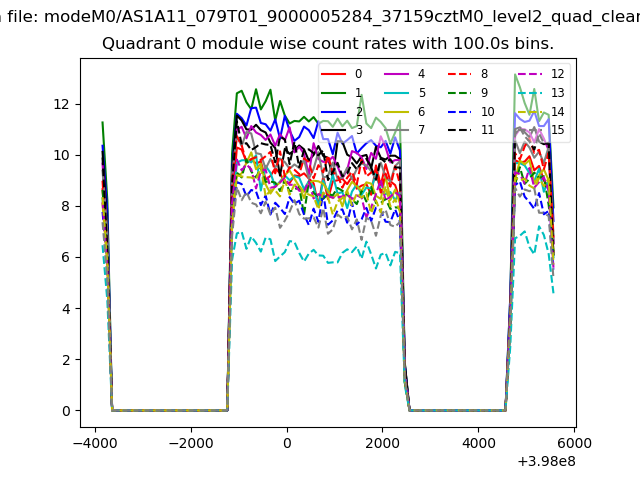 |
 |
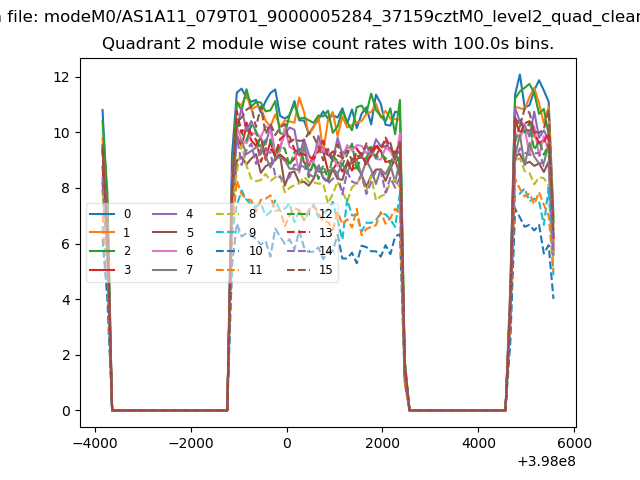
| Module-wise count rates for Quadrant B Data is divided into 100 sec bins |
 |
 |
| Module-wise count rates for Quadrant C Data is divided into 100 sec bins |
 |
 |
| Module-wise count rates for Quadrant D Data is divided into 100 sec bins |
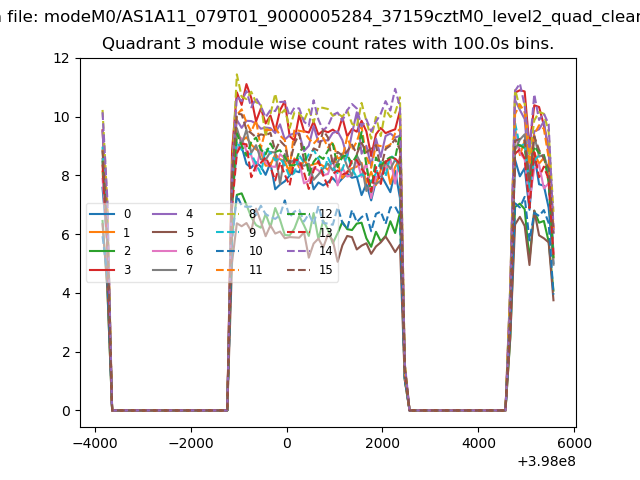 |
 |
| Parameter | Plot |
|---|---|
| CZT HV Monitor | 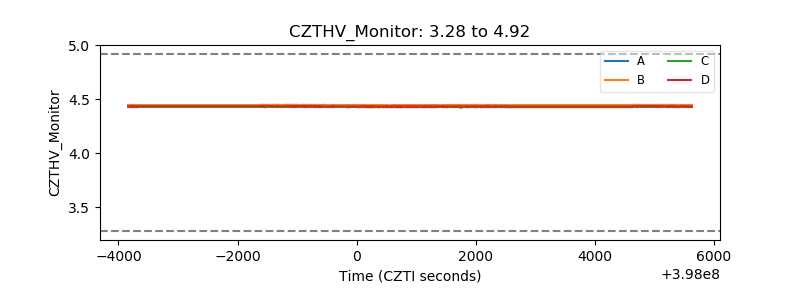 |
| D_VDD | 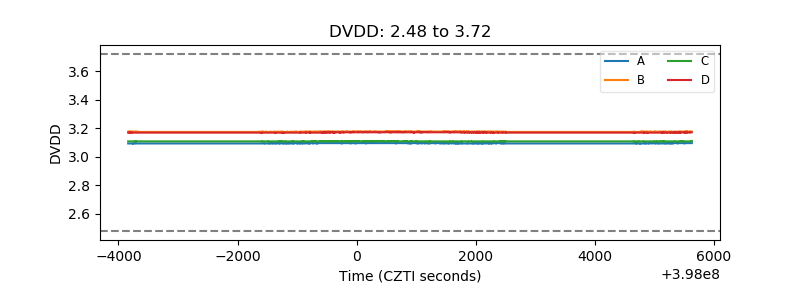 |
| Temperature 1 | 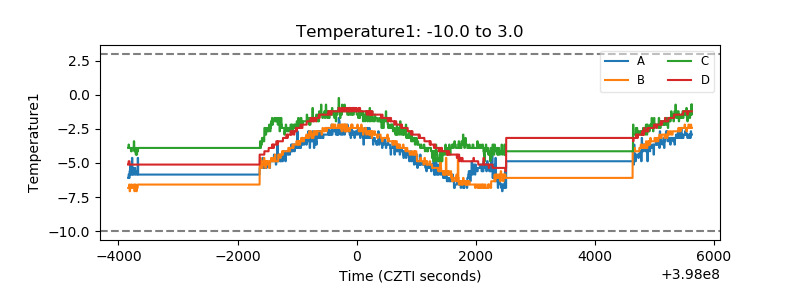 |
| Veto HV Monitor | 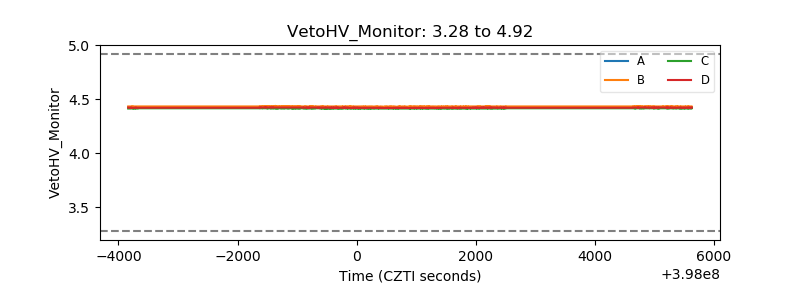 |
| Veto LLD | 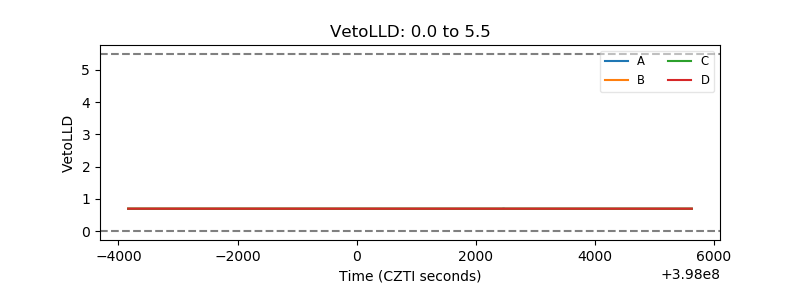 |
| Alpha Counter | 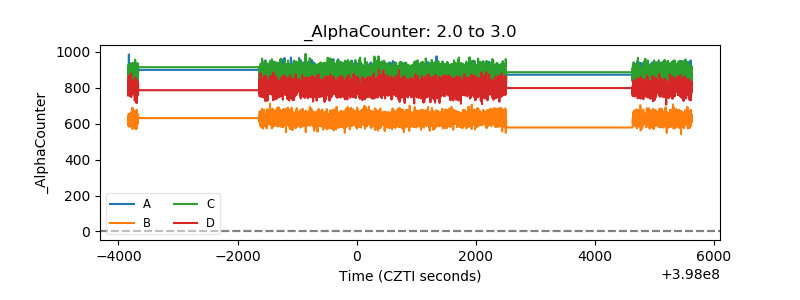 |
| _CPM_Rate | 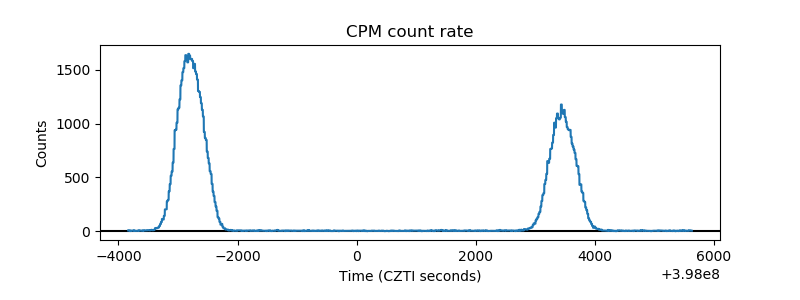 |
| CZT Counter | 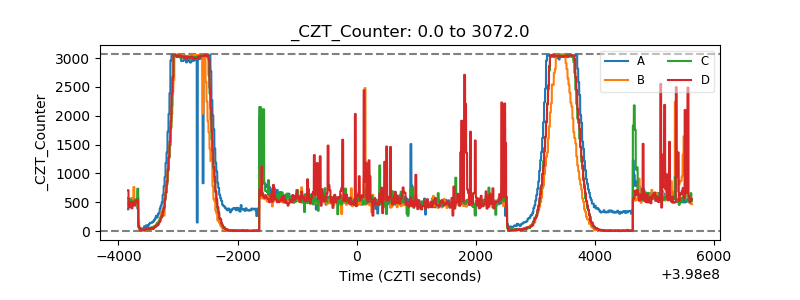 |
| +2.5 Volts monitor | 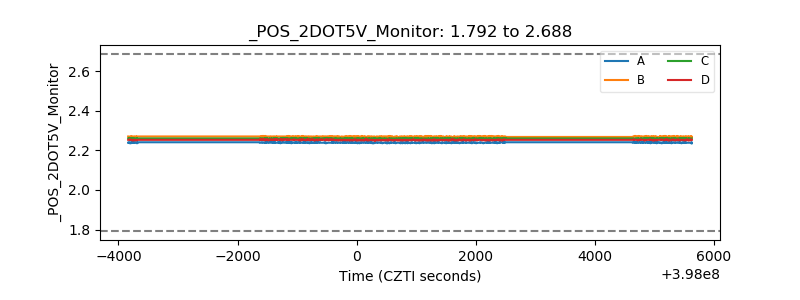 |
| +5 Volts monitor | 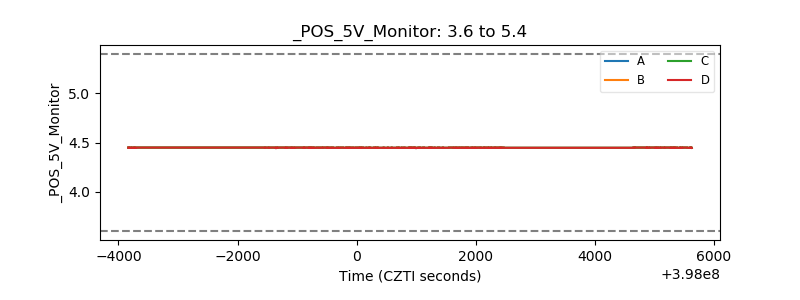 |
| _ROLL_ROT | 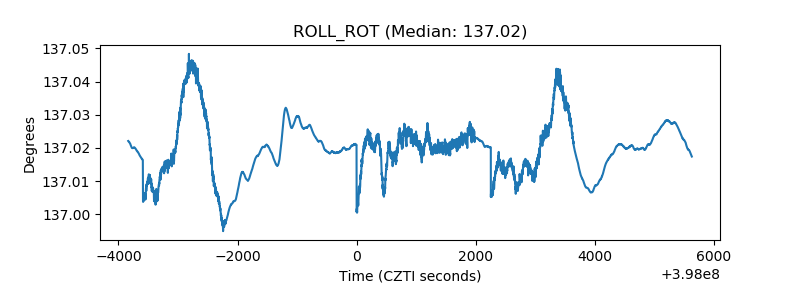 |
| _Roll_DEC | 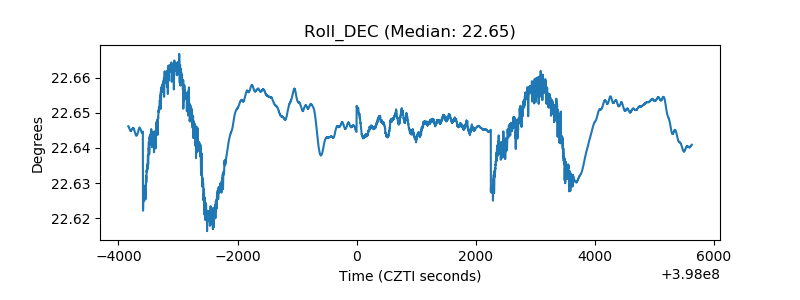 |
| _Roll_RA | 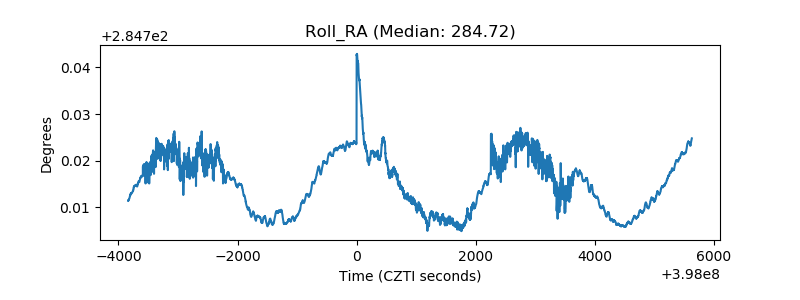 |
| Veto Counter | 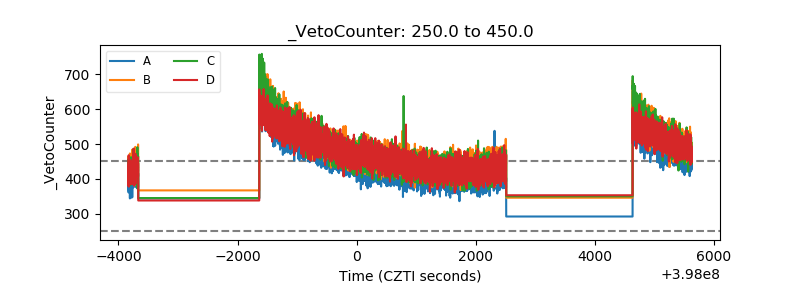 |