| Param | Original file | Final file |
|---|---|---|
| Filename | modeM0/AS1A11_079T01_9000005284_37160cztM0_level2.evt | modeM0/AS1A11_079T01_9000005284_37160cztM0_level2_quad_clean.evt |
| Size (bytes) | 433,710,720 | 95,440,320 |
| Size | 413.6 MB | 91.0 MB |
| Events in quadrant A | 2,755,436 | 656,045 |
| Events in quadrant B | 2,956,310 | 648,550 |
| Events in quadrant C | 3,198,472 | 636,790 |
| Events in quadrant D | 3,877,169 | 590,197 |
| Mode M9 | |||
|---|---|---|---|
| Quadrant | BADHDUFLAG | Total packets | Discarded packets |
| A | 0 | 27 | 0 |
| B | 0 | 27 | 0 |
| C | 0 | 27 | 0 |
| D | 0 | 28 | 0 |
| Mode SS | |||
|---|---|---|---|
| Quadrant | BADHDUFLAG | Total packets | Discarded packets |
| A | 0 | 104 | 0 |
| B | 0 | 104 | 0 |
| C | 0 | 104 | 0 |
| D | 0 | 104 | 0 |
| Mode M0 | |||
|---|---|---|---|
| Quadrant | BADHDUFLAG | Total packets | Discarded packets |
| A | 0 | 11277 | 3 |
| B | 0 | 12043 | 2 |
| C | 0 | 12556 | 2 |
| D | 0 | 14764 | 2 |
| Quadrant | Total seconds | Saturated seconds | Saturation percentage |
|---|---|---|---|
| A | 5120 | 14 | 0.273438% |
| B | 5120 | 63 | 1.230469% |
| C | 5120 | 114 | 2.226562% |
| D | 5120 | 337 | 6.582031% |
Noise dominated data is calculated using 1-second bins in cleaned event files. If a bin has >2000 counts, and if more than 50% of those come from <1% of pixels, then it is considered to be noise-dominated and hence unusable.
| Quadrant | # 1 sec bins | Bins with >0 counts | Bins with >2000 counts | High rate bins dominated by noise | Noise dominated (total time) | Noise dominated (detector-on time) | Marked lightcurve |
|---|---|---|---|---|---|---|---|
| A | 7243 | 5121 | 8 | 8 | 0.11% | 0.16% | 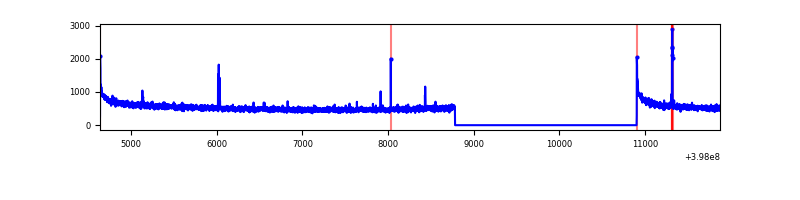 |
| B | 7243 | 5121 | 35 | 35 | 0.48% | 0.68% | 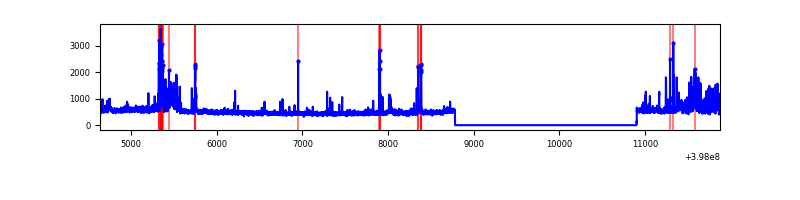 |
| C | 7243 | 5121 | 92 | 92 | 1.27% | 1.80% | 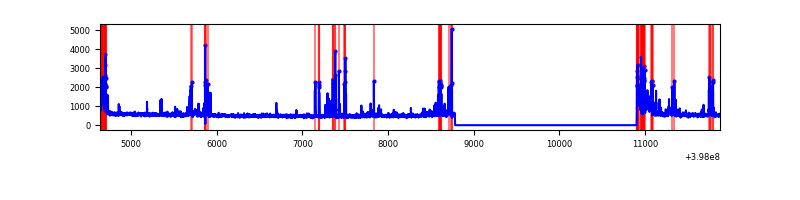 |
| D | 7243 | 5121 | 300 | 300 | 4.14% | 5.86% | 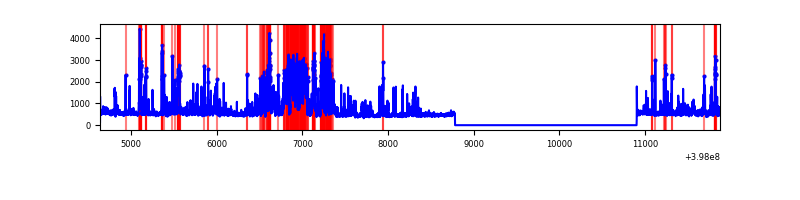 |
Top three noisy pixels from each quadrant. If the there are fewer than three noisy pixels in the level2.evt file, extra rows are filled as -1
| Pixel properties | Quadrant properties | ||||||
|---|---|---|---|---|---|---|---|
| Quadrant | DetID | PixID | Counts | Sigma | Mean | Median | Sigma |
| A | 10 | 83 | 249607 | 1938.78 | 638 | 630 | 128.4 |
| A | 9 | 143 | 34426 | 263.17 | 638 | 630 | 128.4 |
| A | 13 | 6 | 7647 | 54.64 | 638 | 630 | 128.4 |
| B | 0 | 190 | 280910 | 2369.15 | 621 | 606 | 118.3 |
| B | 5 | 172 | 166232 | 1399.88 | 621 | 606 | 118.3 |
| B | 5 | 200 | 27205 | 224.82 | 621 | 606 | 118.3 |
| C | 14 | 254 | 444367 | 3111.74 | 611 | 619 | 142.6 |
| C | 15 | 214 | 218107 | 1525.11 | 611 | 619 | 142.6 |
| C | 0 | 10 | 127898 | 892.53 | 611 | 619 | 142.6 |
| D | 2 | 249 | 578534 | 3960.22 | 605 | 590 | 145.9 |
| D | 2 | 153 | 409130 | 2799.42 | 605 | 590 | 145.9 |
| D | 13 | 249 | 219096 | 1497.26 | 605 | 590 | 145.9 |
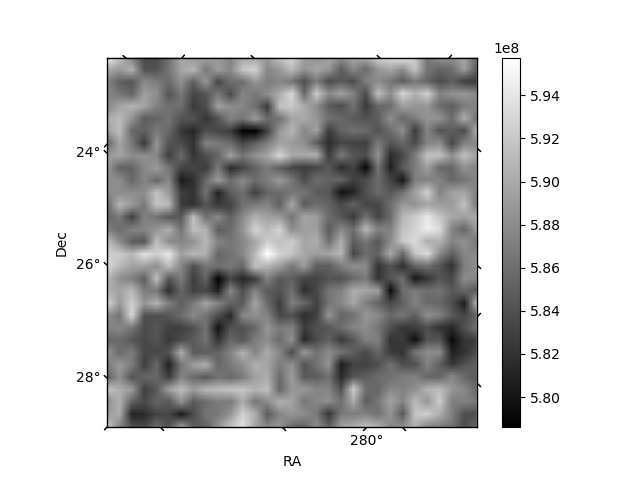
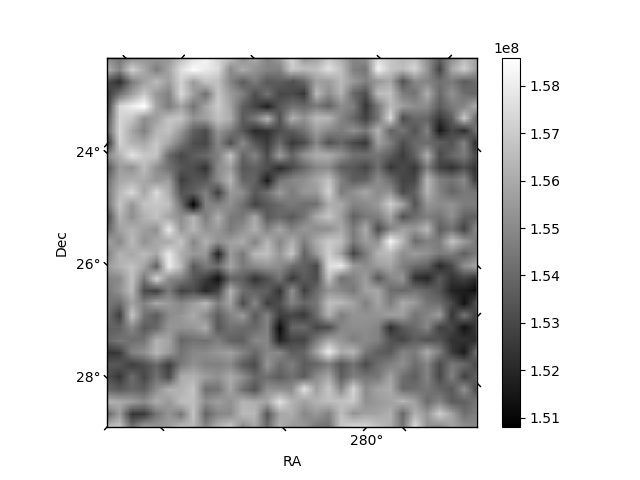
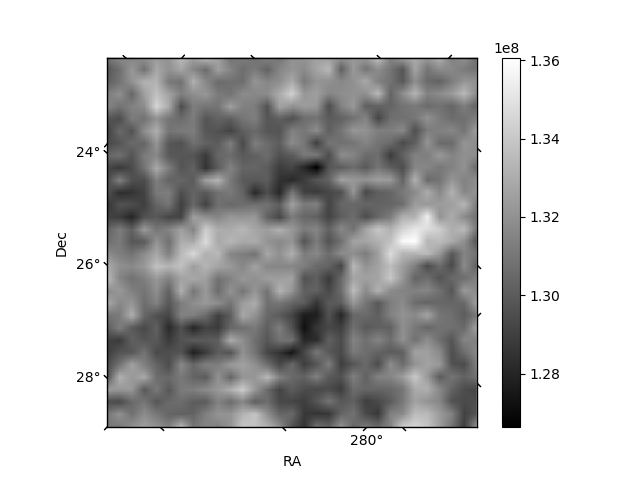
Histogram calculated using DETX and DETY for each event in the final _common_clean file
| Quadrant A | 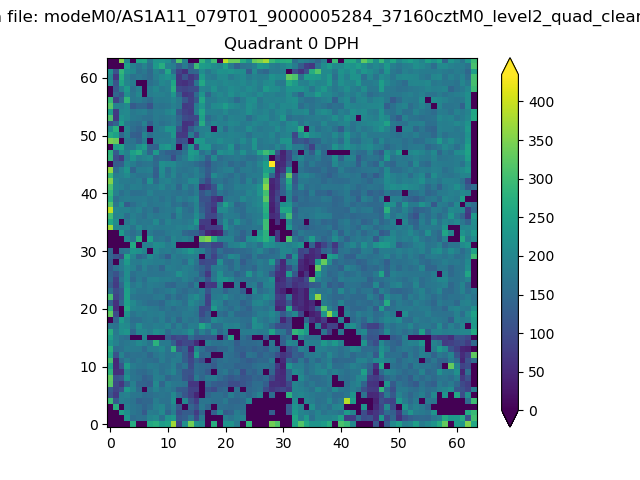 |
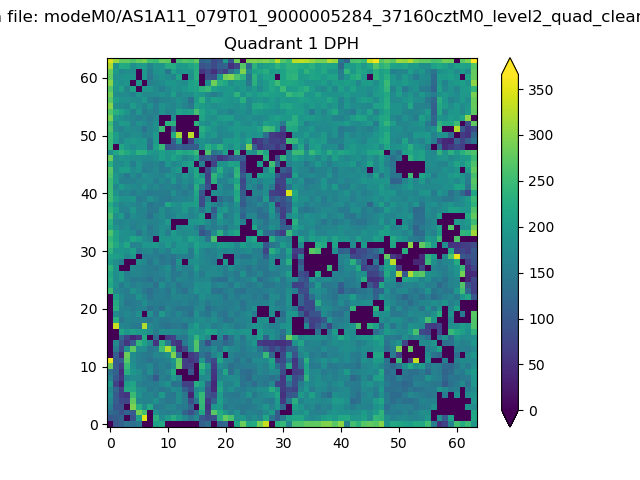 |
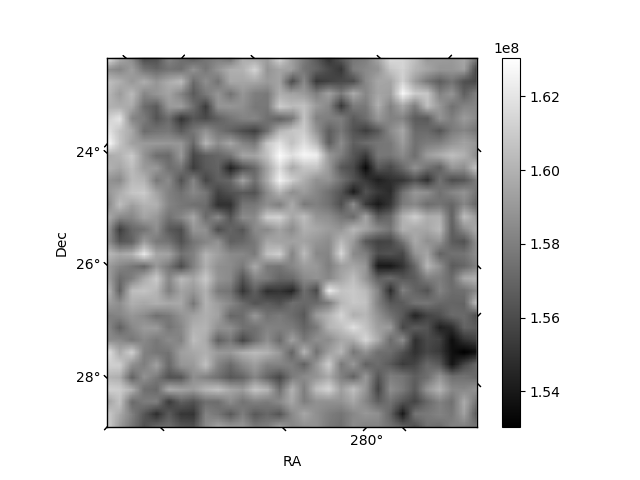
Quadrant B |
|---|---|---|---|
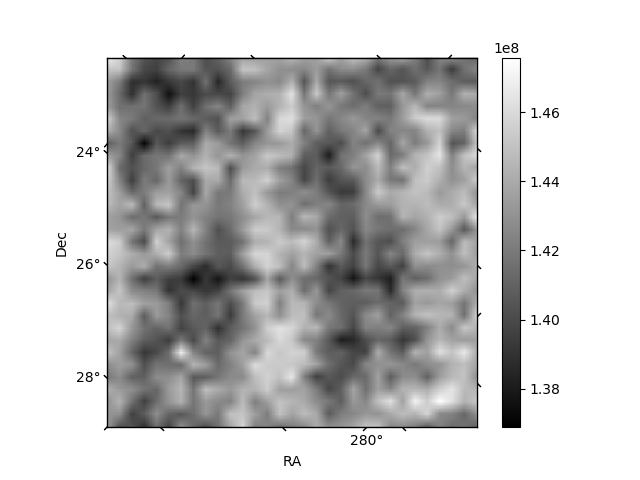
| Quadrant D | 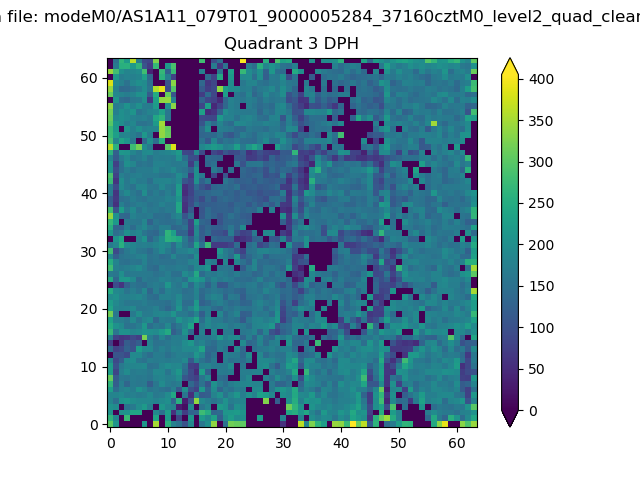 |
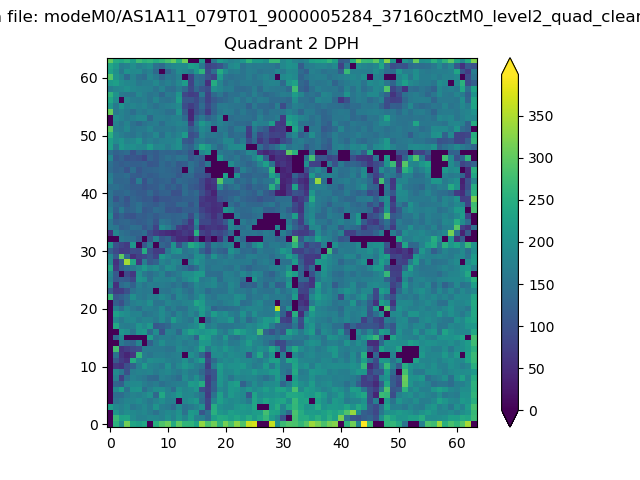 |
Quadrant C |
| Plot type | Count rate plots | Images |
|---|---|---|
| Comparison with Poisson distribution Blue bars denote a histogram of data divided into 1 sec bins. Red curve is a Poisson curve with rate = median count rate of data. |
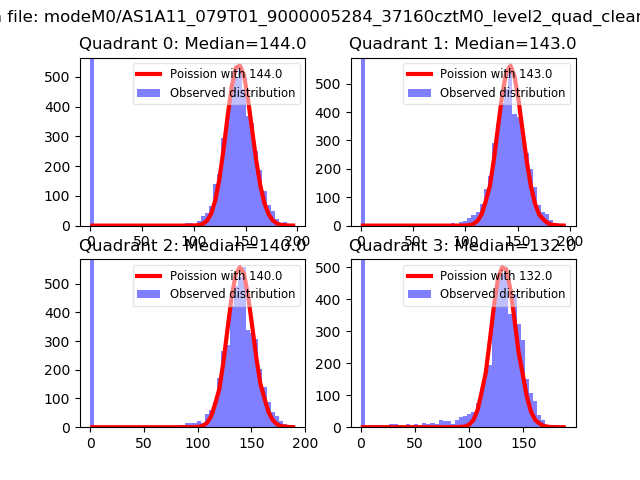 |
 |
| Quadrant-wise count rates Data is divided into 100 sec bins |
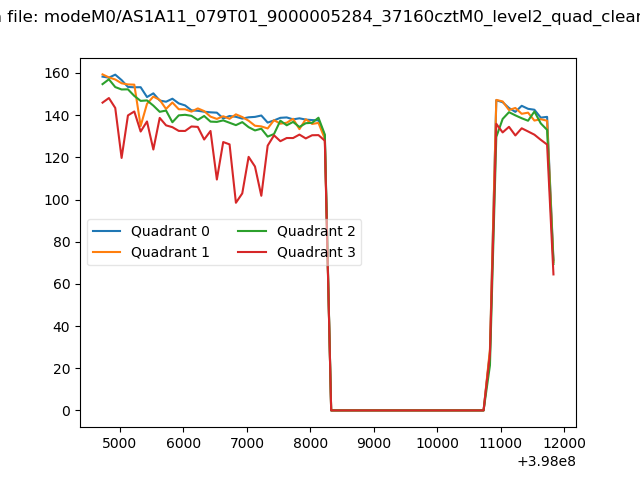 |
|
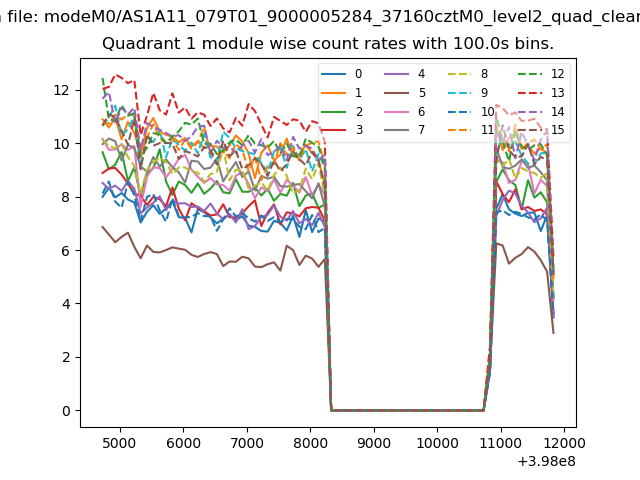
| Module-wise count rates for Quadrant A Data is divided into 100 sec bins |
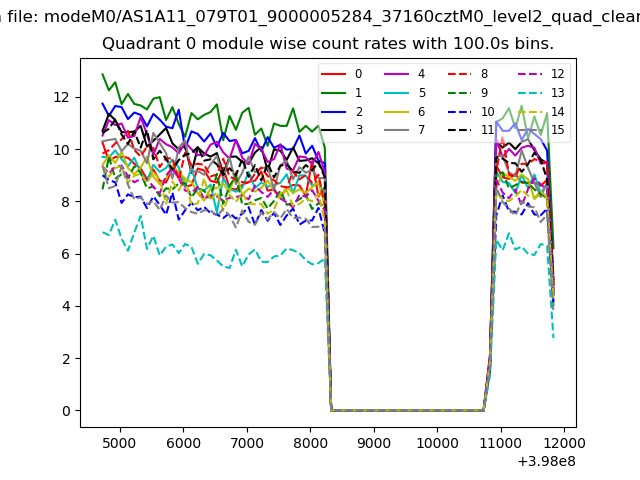 |
 |
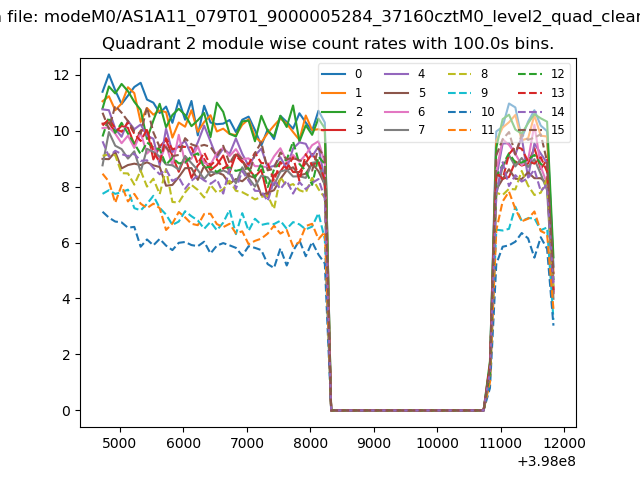
| Module-wise count rates for Quadrant B Data is divided into 100 sec bins |
 |
 |
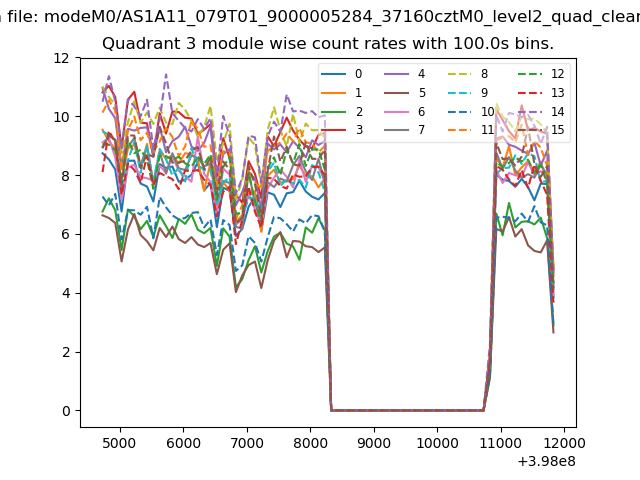
| Module-wise count rates for Quadrant C Data is divided into 100 sec bins |
 |
 |
| Module-wise count rates for Quadrant D Data is divided into 100 sec bins |
 |
 |
| Parameter | Plot |
|---|---|
| CZT HV Monitor | 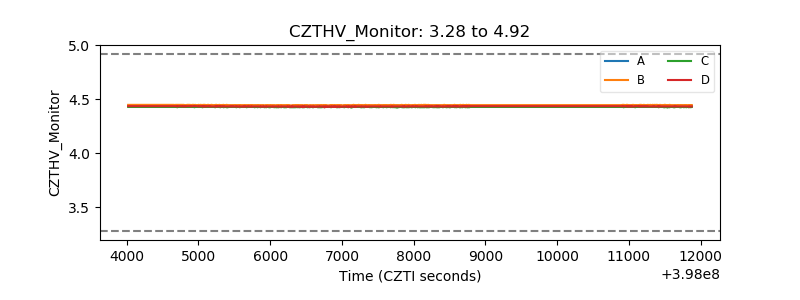 |
| D_VDD | 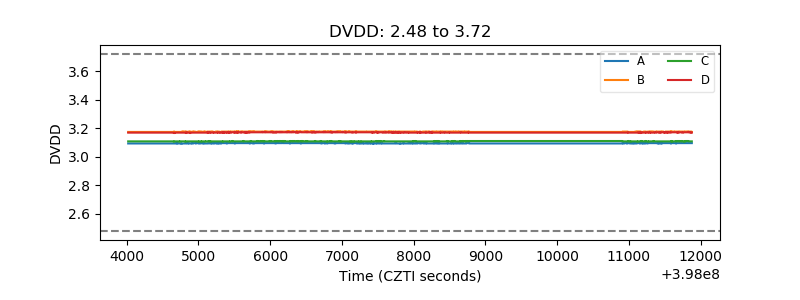 |
| Temperature 1 | 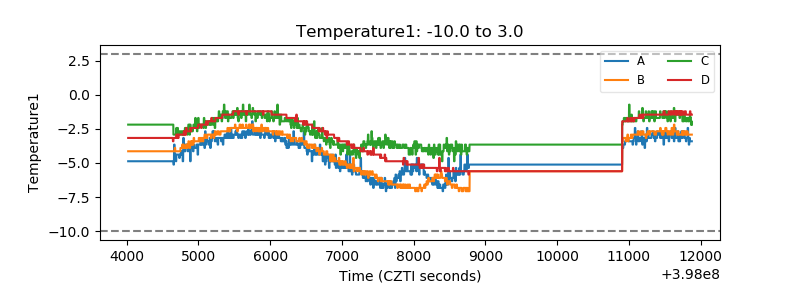 |
| Veto HV Monitor | 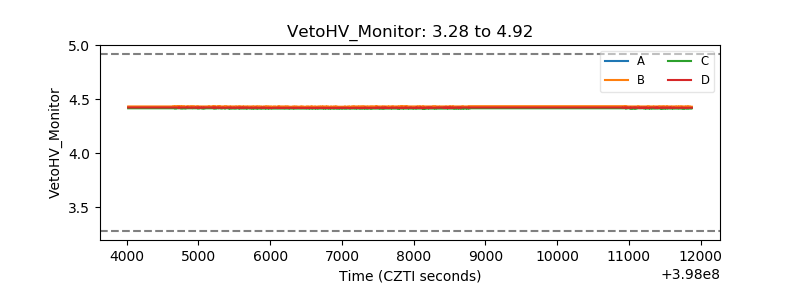 |
| Veto LLD | 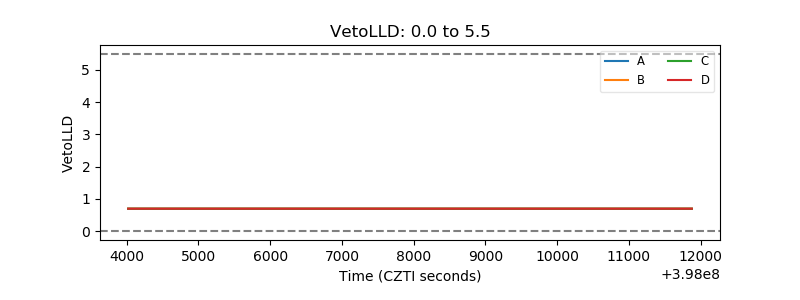 |
| Alpha Counter | 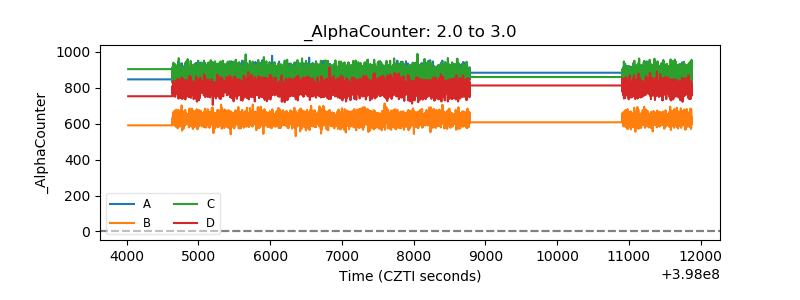 |
| _CPM_Rate | 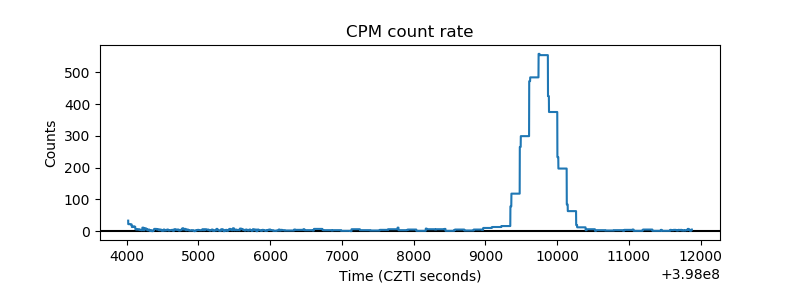 |
| CZT Counter | 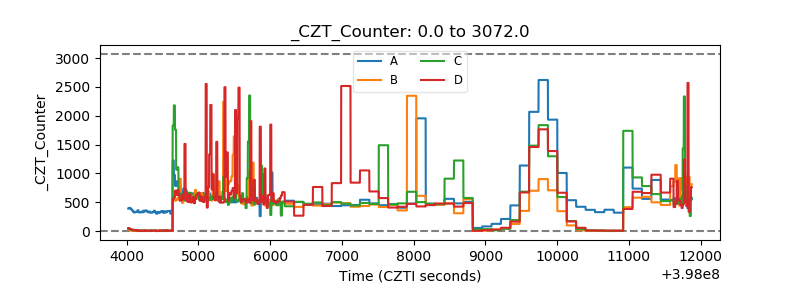 |
| +2.5 Volts monitor | 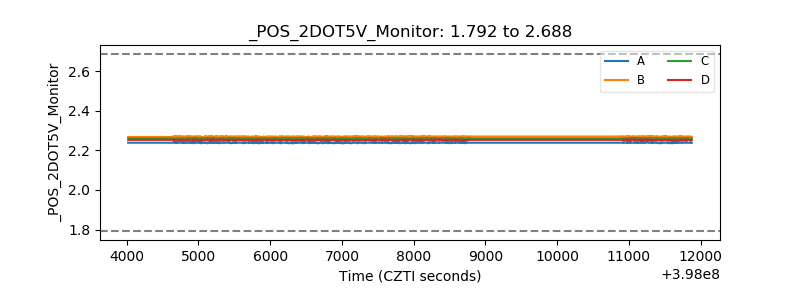 |
| +5 Volts monitor | 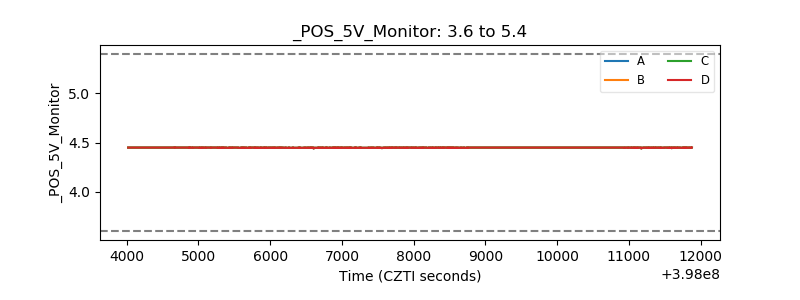 |
| _ROLL_ROT | 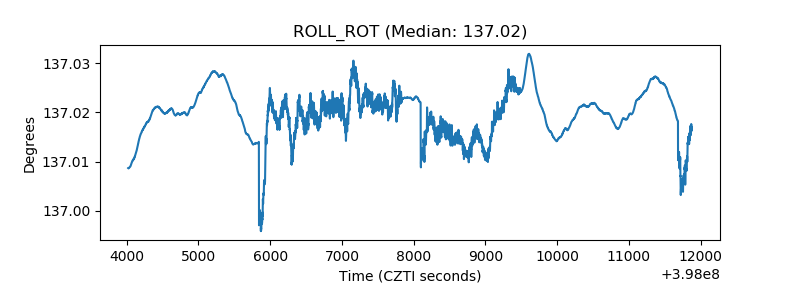 |
| _Roll_DEC | 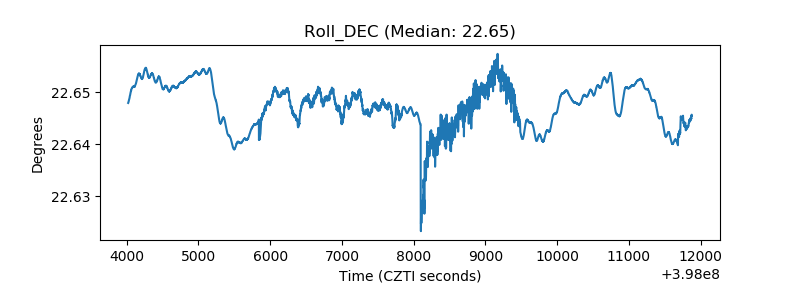 |
| _Roll_RA | 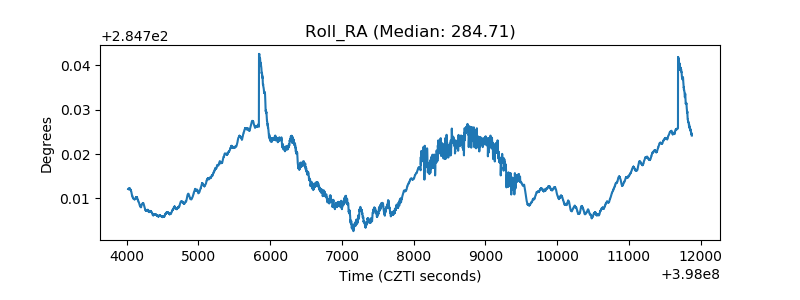 |
| Veto Counter | 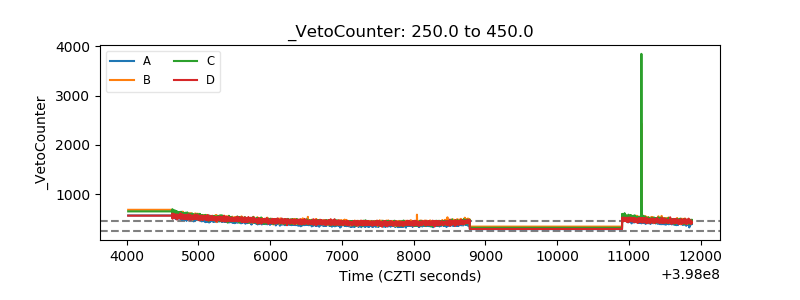 |