| Param | Original file | Final file |
|---|---|---|
| Filename | modeM0/AS1A11_079T01_9000005284_37161cztM0_level2.evt | modeM0/AS1A11_079T01_9000005284_37161cztM0_level2_quad_clean.evt |
| Size (bytes) | 440,899,200 | 82,912,320 |
| Size | 420.5 MB | 79.1 MB |
| Events in quadrant A | 2,651,805 | 552,115 |
| Events in quadrant B | 2,971,618 | 549,557 |
| Events in quadrant C | 3,283,497 | 540,982 |
| Events in quadrant D | 4,097,697 | 508,656 |
| Mode M9 | |||
|---|---|---|---|
| Quadrant | BADHDUFLAG | Total packets | Discarded packets |
| A | 0 | 39 | 0 |
| B | 0 | 39 | 0 |
| C | 0 | 39 | 0 |
| D | 0 | 40 | 0 |
| Mode SS | |||
|---|---|---|---|
| Quadrant | BADHDUFLAG | Total packets | Discarded packets |
| A | 0 | 106 | 0 |
| B | 0 | 106 | 0 |
| C | 0 | 106 | 0 |
| D | 0 | 106 | 0 |
| Mode M0 | |||
|---|---|---|---|
| Quadrant | BADHDUFLAG | Total packets | Discarded packets |
| A | 0 | 11084 | 3 |
| B | 0 | 12214 | 2 |
| C | 0 | 12975 | 2 |
| D | 0 | 15569 | 2 |
| Quadrant | Total seconds | Saturated seconds | Saturation percentage |
|---|---|---|---|
| A | 5124 | 14 | 0.273224% |
| B | 5124 | 84 | 1.639344% |
| C | 5124 | 139 | 2.712724% |
| D | 5124 | 238 | 4.644809% |
Noise dominated data is calculated using 1-second bins in cleaned event files. If a bin has >2000 counts, and if more than 50% of those come from <1% of pixels, then it is considered to be noise-dominated and hence unusable.
| Quadrant | # 1 sec bins | Bins with >0 counts | Bins with >2000 counts | High rate bins dominated by noise | Noise dominated (total time) | Noise dominated (detector-on time) | Marked lightcurve |
|---|---|---|---|---|---|---|---|
| A | 7127 | 5125 | 13 | 13 | 0.18% | 0.25% | 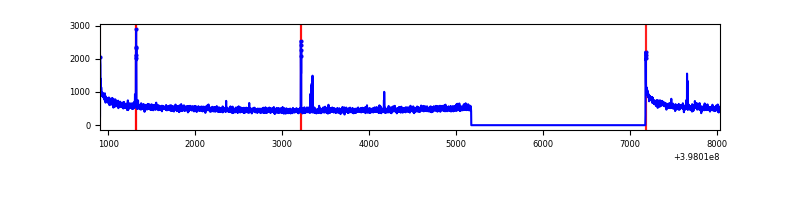 |
| B | 7127 | 5125 | 35 | 35 | 0.49% | 0.68% | 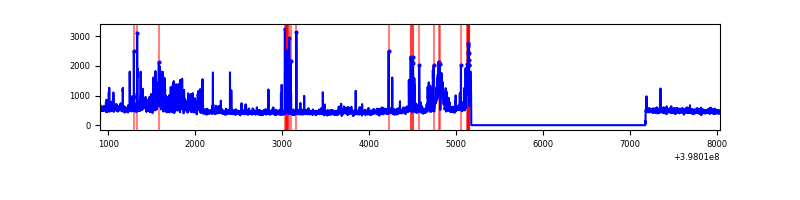 |
| C | 7127 | 5125 | 85 | 85 | 1.19% | 1.66% | 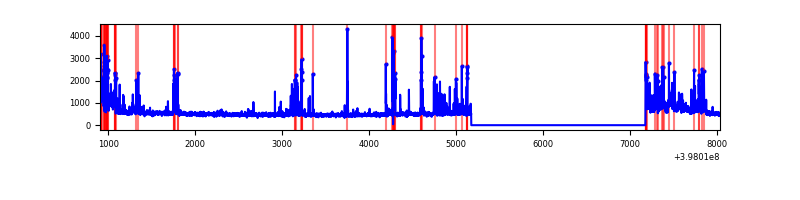 |
| D | 7127 | 5125 | 217 | 217 | 3.04% | 4.23% | 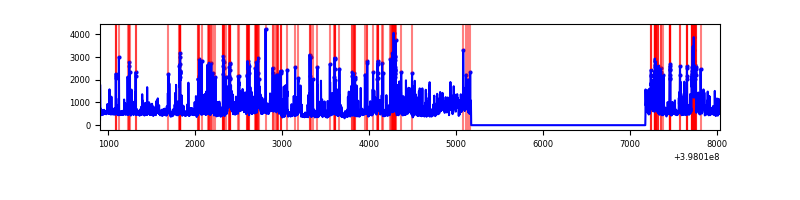 |
Top three noisy pixels from each quadrant. If the there are fewer than three noisy pixels in the level2.evt file, extra rows are filled as -1
| Pixel properties | Quadrant properties | ||||||
|---|---|---|---|---|---|---|---|
| Quadrant | DetID | PixID | Counts | Sigma | Mean | Median | Sigma |
| A | 10 | 83 | 253946 | 2094.89 | 604 | 594 | 120.9 |
| A | 9 | 143 | 35703 | 290.31 | 604 | 594 | 120.9 |
| A | 13 | 6 | 16862 | 134.51 | 604 | 594 | 120.9 |
| B | 0 | 190 | 207509 | 1817.89 | 594 | 578 | 113.8 |
| B | 5 | 184 | 194956 | 1707.61 | 594 | 578 | 113.8 |
| B | 5 | 172 | 182079 | 1594.49 | 594 | 578 | 113.8 |
| C | 14 | 254 | 563488 | 4123.47 | 581 | 587 | 136.5 |
| C | 0 | 10 | 231460 | 1691.24 | 581 | 587 | 136.5 |
| C | 15 | 214 | 214174 | 1564.61 | 581 | 587 | 136.5 |
| D | 2 | 249 | 691493 | 4935.09 | 581 | 566 | 140.0 |
| D | 2 | 153 | 347997 | 2481.6 | 581 | 566 | 140.0 |
| D | 12 | 17 | 201570 | 1435.71 | 581 | 566 | 140.0 |
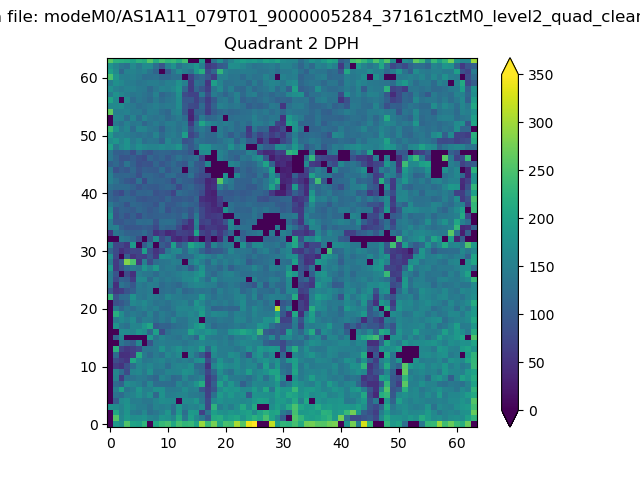
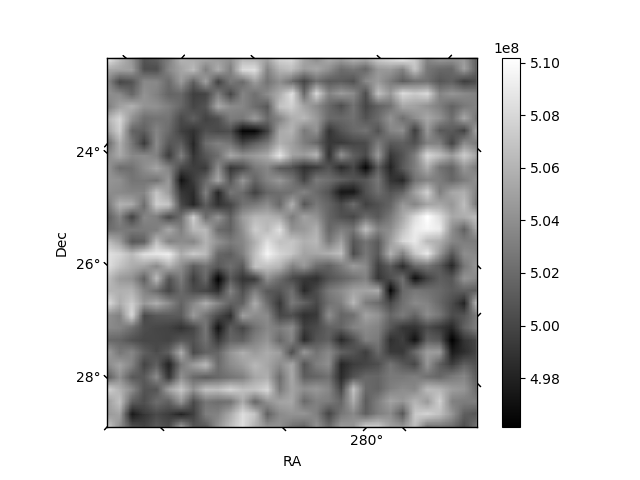
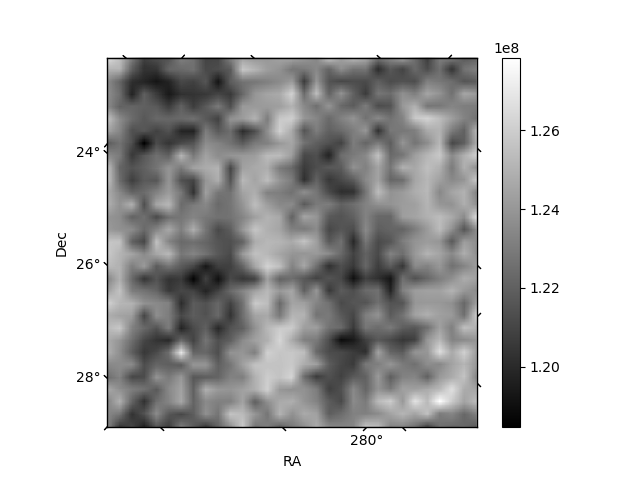
Histogram calculated using DETX and DETY for each event in the final _common_clean file
| Quadrant A | 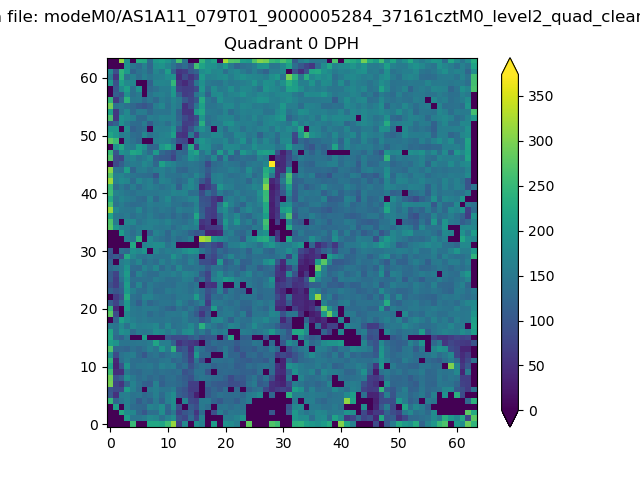 |
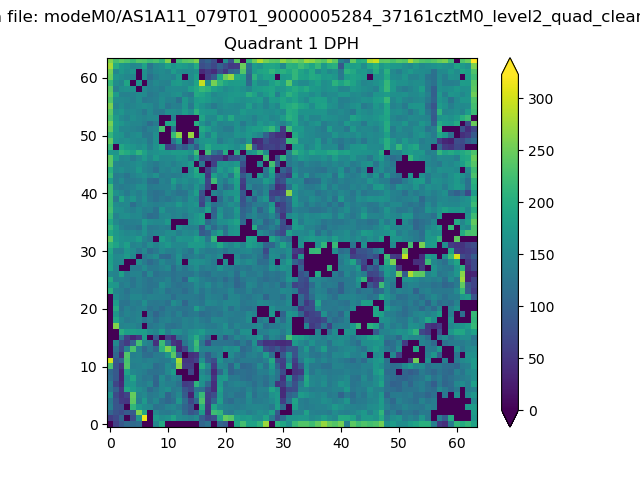 |
Quadrant B |
|---|---|---|---|
| Quadrant D | 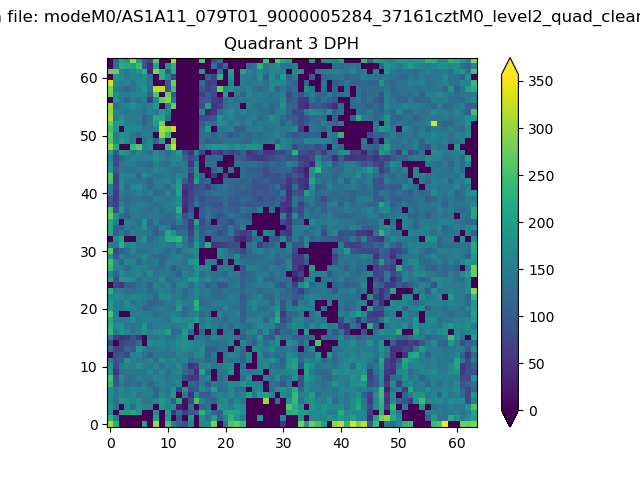 |
 |
Quadrant C |
| Plot type | Count rate plots | Images |
|---|---|---|
| Comparison with Poisson distribution Blue bars denote a histogram of data divided into 1 sec bins. Red curve is a Poisson curve with rate = median count rate of data. |
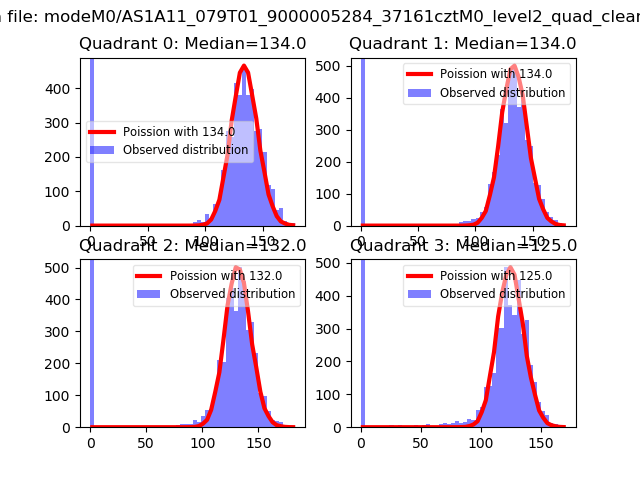 |
 |
| Quadrant-wise count rates Data is divided into 100 sec bins |
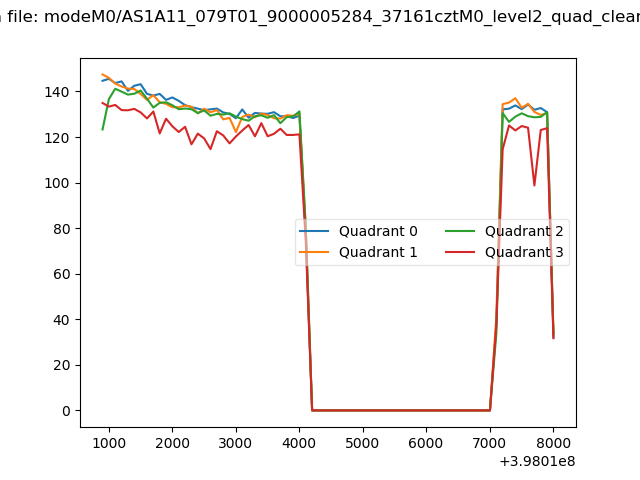 |
|
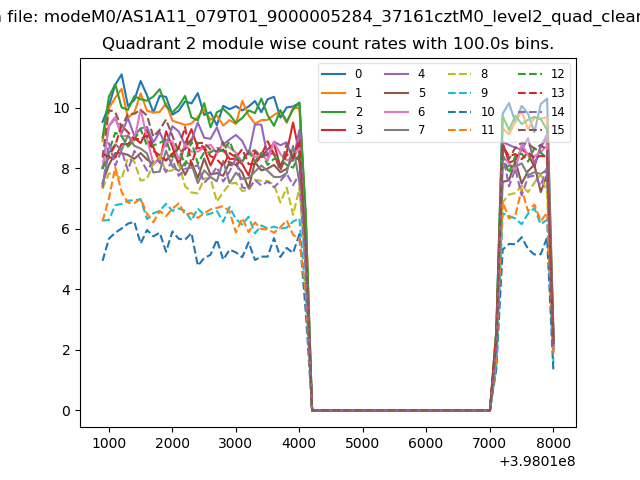
| Module-wise count rates for Quadrant A Data is divided into 100 sec bins |
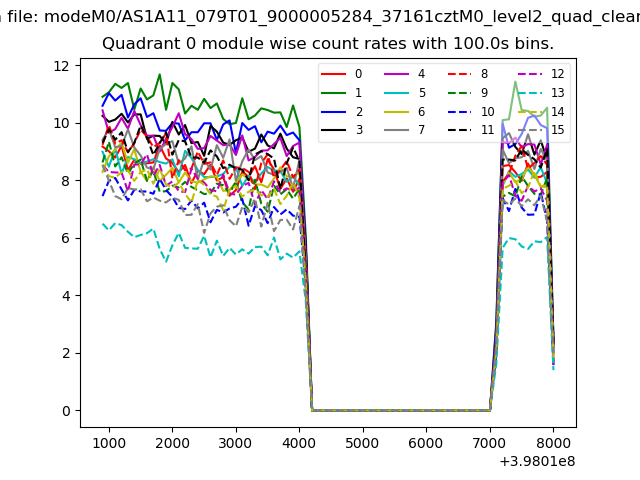 |
 |
| Module-wise count rates for Quadrant B Data is divided into 100 sec bins |
 |
 |
| Module-wise count rates for Quadrant C Data is divided into 100 sec bins |
 |
 |
| Module-wise count rates for Quadrant D Data is divided into 100 sec bins |
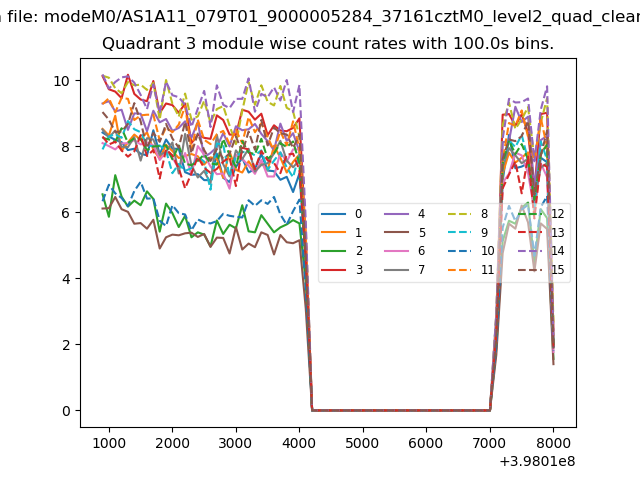 |
 |
| Parameter | Plot |
|---|---|
| CZT HV Monitor |  |
| D_VDD | 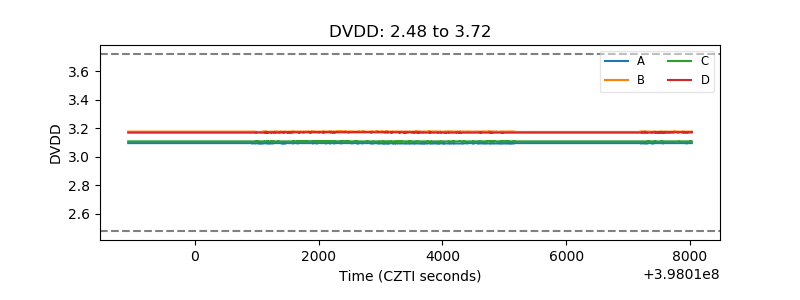 |
| Temperature 1 | 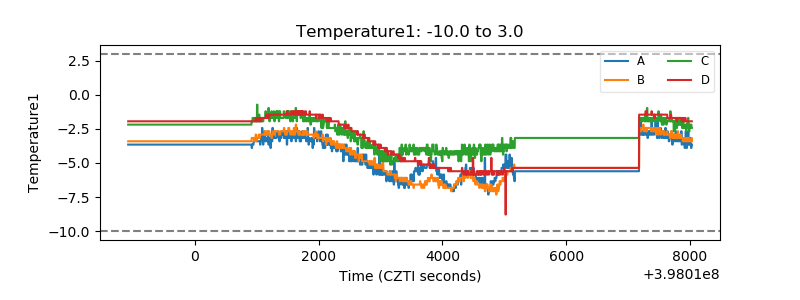 |
| Veto HV Monitor | 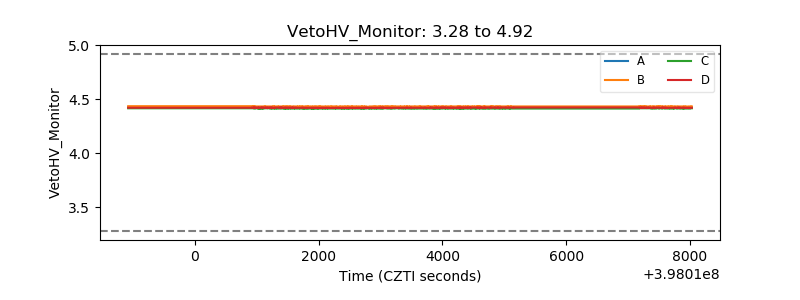 |
| Veto LLD | 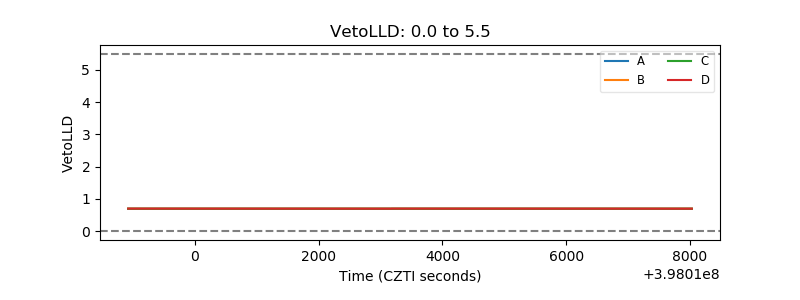 |
| Alpha Counter | 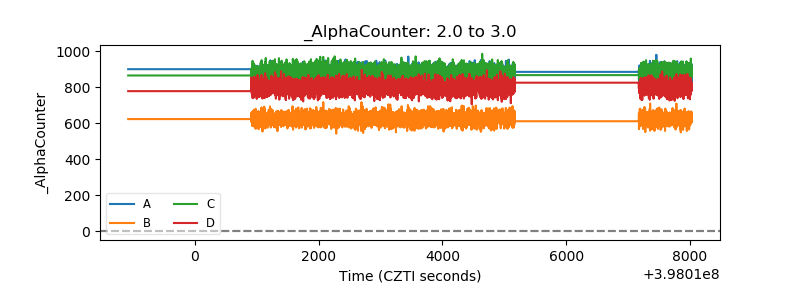 |
| _CPM_Rate | 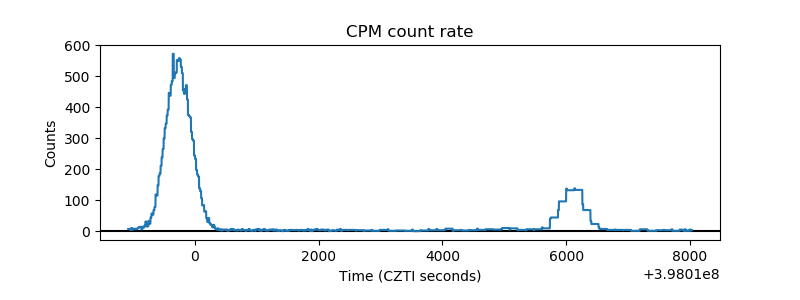 |
| CZT Counter | 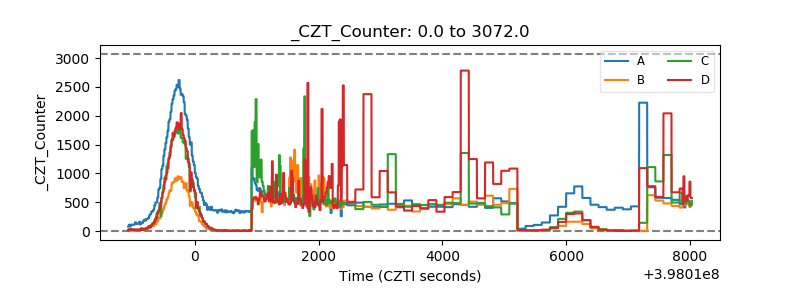 |
| +2.5 Volts monitor | 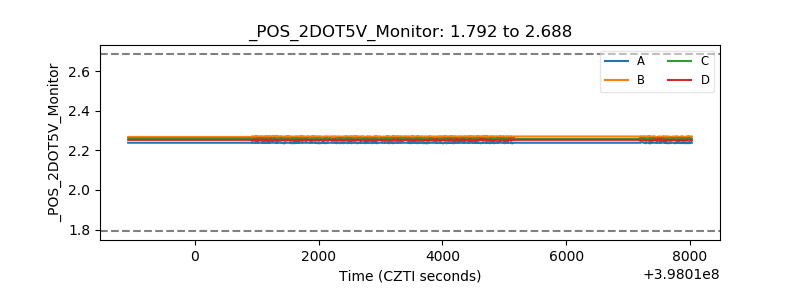 |
| +5 Volts monitor | 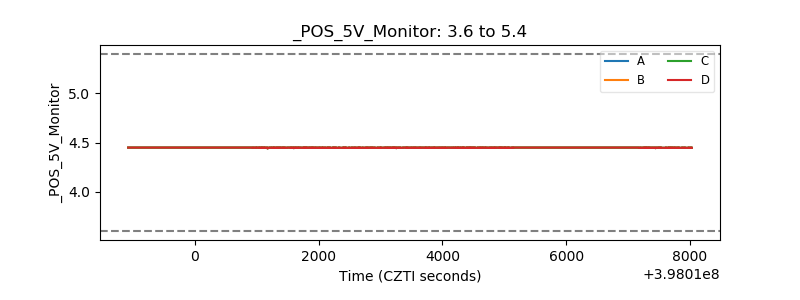 |
| _ROLL_ROT | 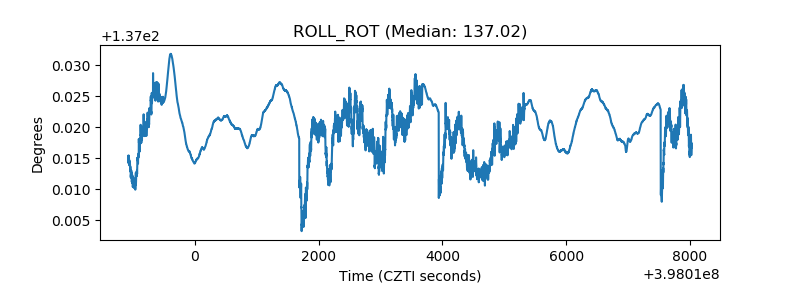 |
| _Roll_DEC | 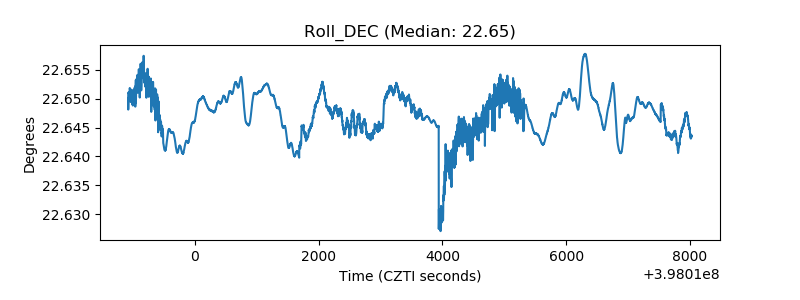 |
| _Roll_RA |  |
| Veto Counter | 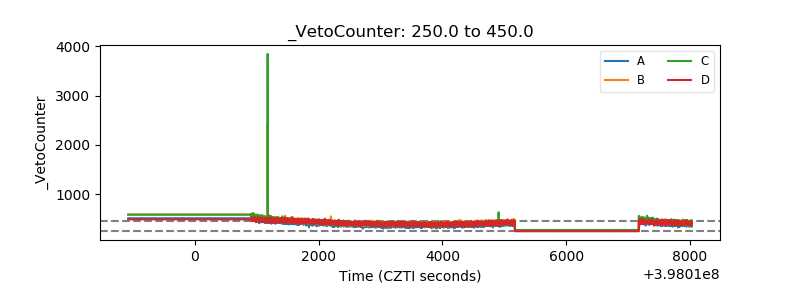 |