| Param | Original file | Final file |
|---|---|---|
| Filename | modeM0/AS1A11_079T01_9000005284_37162cztM0_level2.evt | modeM0/AS1A11_079T01_9000005284_37162cztM0_level2_quad_clean.evt |
| Size (bytes) | 421,560,000 | 71,372,160 |
| Size | 402.0 MB | 68.1 MB |
| Events in quadrant A | 2,654,023 | 457,571 |
| Events in quadrant B | 2,741,966 | 454,655 |
| Events in quadrant C | 3,188,150 | 452,840 |
| Events in quadrant D | 3,820,505 | 422,558 |
| Mode M9 | |||
|---|---|---|---|
| Quadrant | BADHDUFLAG | Total packets | Discarded packets |
| A | 0 | 21 | 0 |
| B | 0 | 21 | 0 |
| C | 0 | 21 | 0 |
| D | 0 | 22 | 0 |
| Mode SS | |||
|---|---|---|---|
| Quadrant | BADHDUFLAG | Total packets | Discarded packets |
| A | 0 | 108 | 0 |
| B | 0 | 108 | 0 |
| C | 0 | 108 | 0 |
| D | 0 | 108 | 0 |
| Mode M0 | |||
|---|---|---|---|
| Quadrant | BADHDUFLAG | Total packets | Discarded packets |
| A | 0 | 11311 | 3 |
| B | 0 | 11622 | 2 |
| C | 0 | 12812 | 2 |
| D | 0 | 15016 | 2 |
| Quadrant | Total seconds | Saturated seconds | Saturation percentage |
|---|---|---|---|
| A | 5336 | 11 | 0.206147% |
| B | 5336 | 82 | 1.536732% |
| C | 5336 | 85 | 1.592954% |
| D | 5336 | 267 | 5.003748% |
Noise dominated data is calculated using 1-second bins in cleaned event files. If a bin has >2000 counts, and if more than 50% of those come from <1% of pixels, then it is considered to be noise-dominated and hence unusable.
| Quadrant | # 1 sec bins | Bins with >0 counts | Bins with >2000 counts | High rate bins dominated by noise | Noise dominated (total time) | Noise dominated (detector-on time) | Marked lightcurve |
|---|---|---|---|---|---|---|---|
| A | 7039 | 5337 | 7 | 7 | 0.10% | 0.13% | 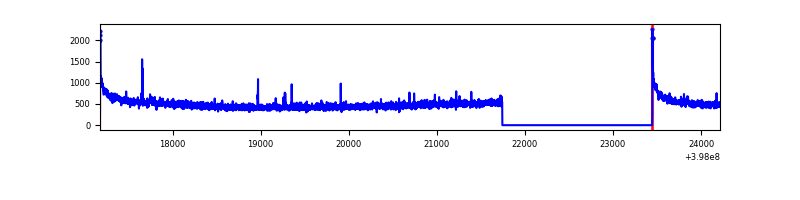 |
| B | 7039 | 5337 | 66 | 66 | 0.94% | 1.24% | 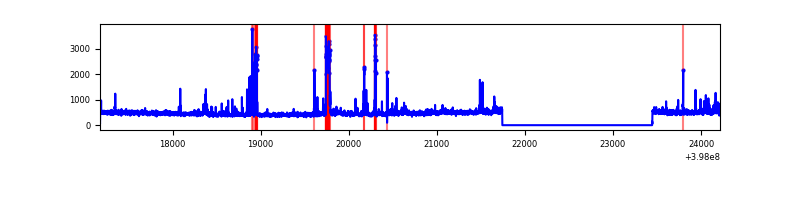 |
| C | 7039 | 5337 | 75 | 75 | 1.07% | 1.41% | 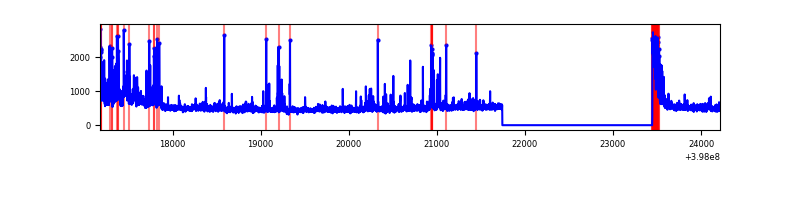 |
| D | 7039 | 5337 | 250 | 250 | 3.55% | 4.68% | 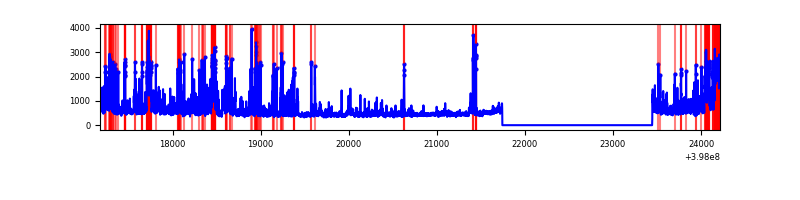 |
Top three noisy pixels from each quadrant. If the there are fewer than three noisy pixels in the level2.evt file, extra rows are filled as -1
| Pixel properties | Quadrant properties | ||||||
|---|---|---|---|---|---|---|---|
| Quadrant | DetID | PixID | Counts | Sigma | Mean | Median | Sigma |
| A | 10 | 83 | 264616 | 2153.44 | 609 | 598 | 122.6 |
| A | 13 | 6 | 13108 | 102.04 | 609 | 598 | 122.6 |
| A | 15 | 174 | 10486 | 80.65 | 609 | 598 | 122.6 |
| B | 5 | 172 | 136814 | 1171.04 | 599 | 581 | 116.3 |
| B | 5 | 184 | 129435 | 1107.61 | 599 | 581 | 116.3 |
| B | 0 | 213 | 69570 | 593.02 | 599 | 581 | 116.3 |
| C | 0 | 10 | 351459 | 2511.08 | 593 | 597 | 139.7 |
| C | 14 | 254 | 293375 | 2095.38 | 593 | 597 | 139.7 |
| C | 15 | 214 | 226976 | 1620.17 | 593 | 597 | 139.7 |
| D | 2 | 249 | 813930 | 5720.91 | 586 | 571 | 142.2 |
| D | 2 | 153 | 329599 | 2314.28 | 586 | 571 | 142.2 |
| D | 13 | 249 | 104544 | 731.31 | 586 | 571 | 142.2 |
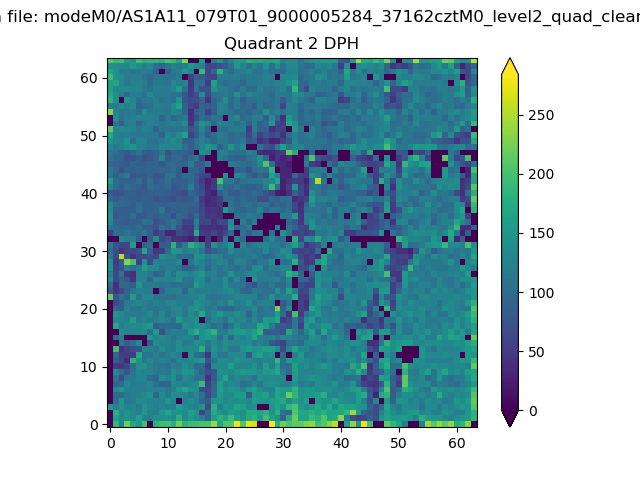
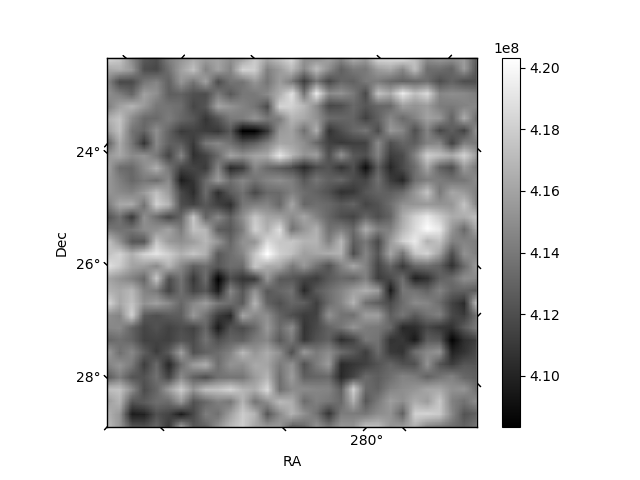
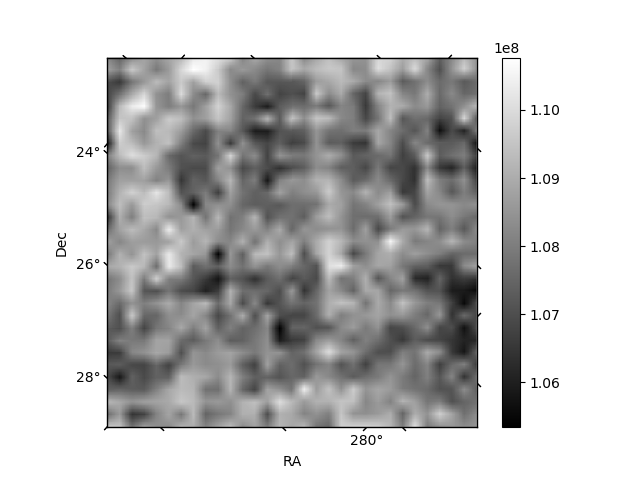
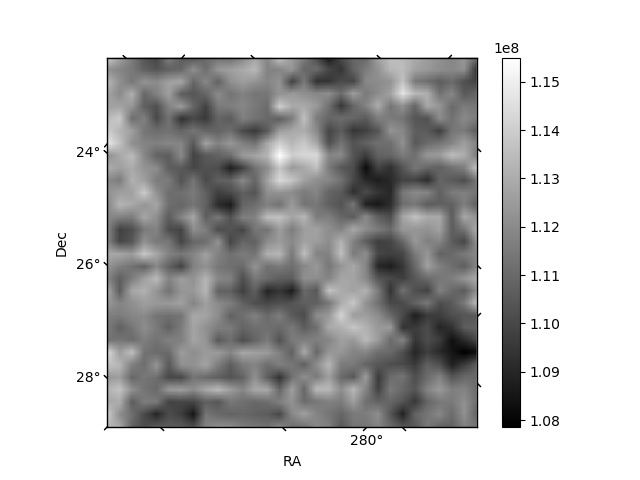
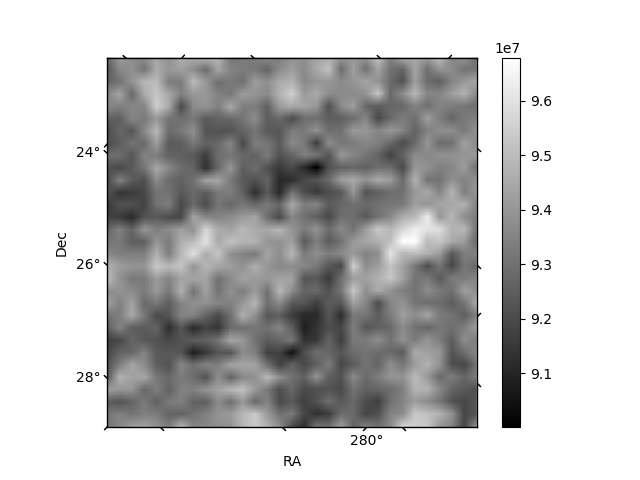
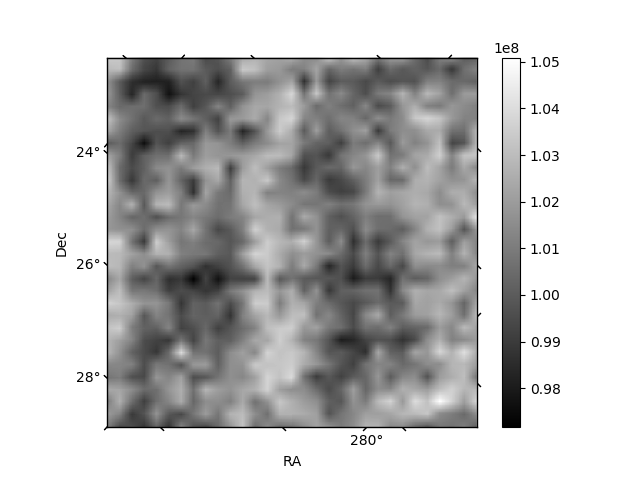
Histogram calculated using DETX and DETY for each event in the final _common_clean file
| Quadrant A | 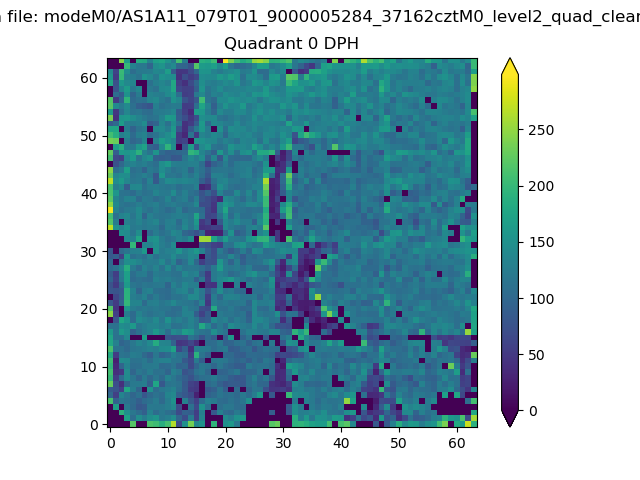 |
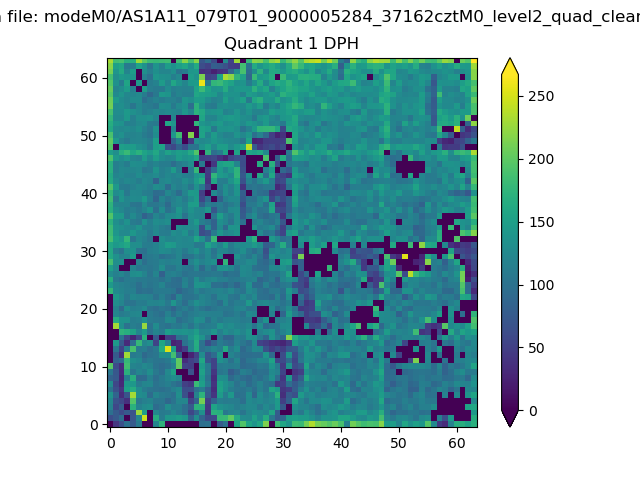 |
Quadrant B |
|---|---|---|---|
| Quadrant D | 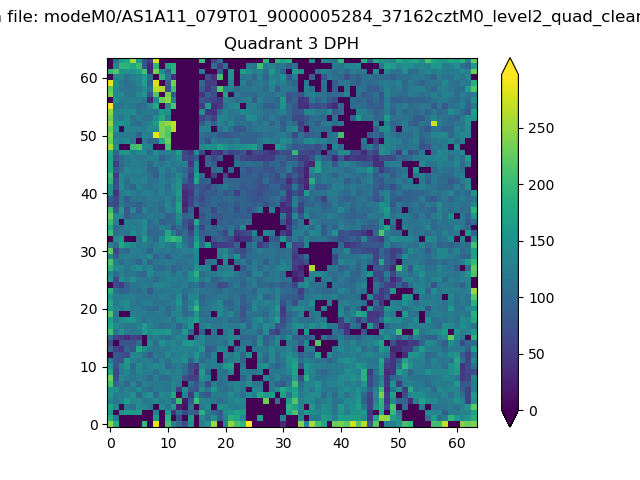 |
 |
Quadrant C |
| Plot type | Count rate plots | Images |
|---|---|---|
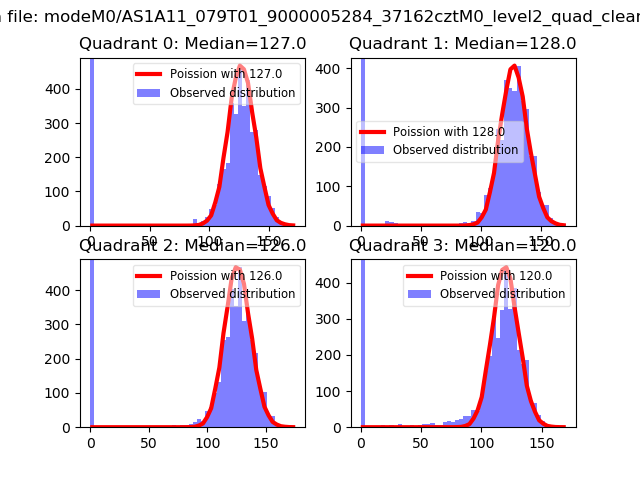
| Comparison with Poisson distribution Blue bars denote a histogram of data divided into 1 sec bins. Red curve is a Poisson curve with rate = median count rate of data. |
 |
 |
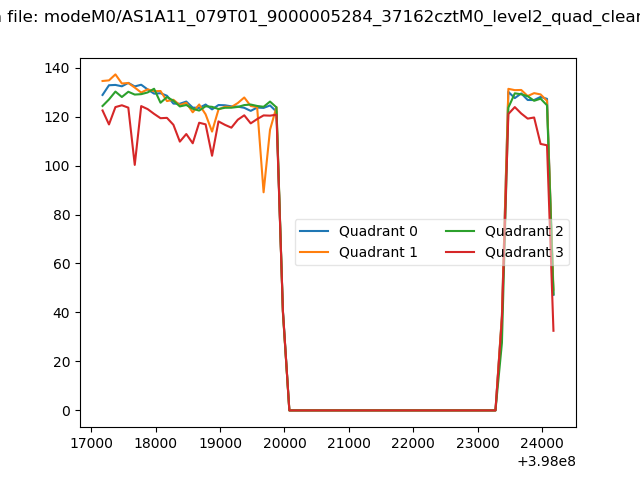
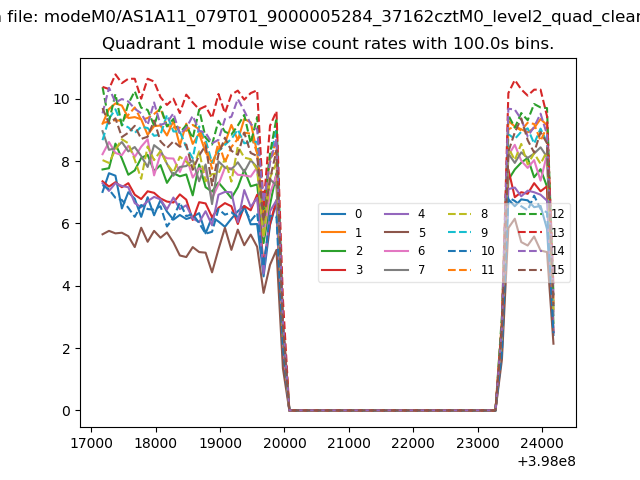
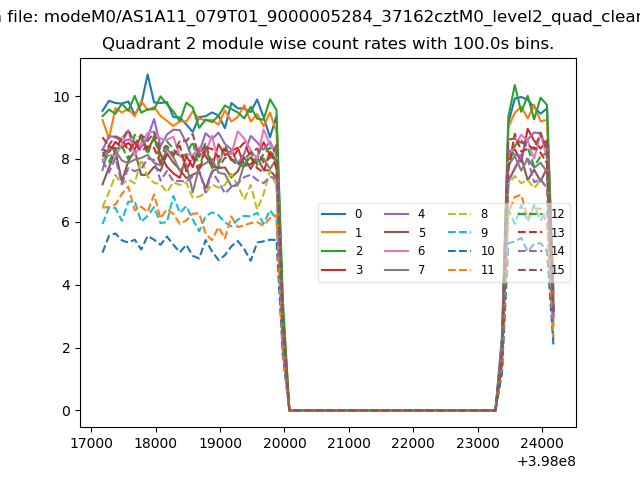
| Quadrant-wise count rates Data is divided into 100 sec bins |
 |
|
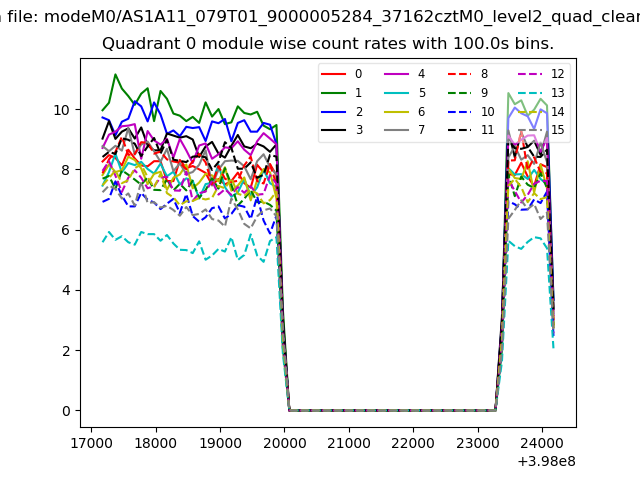
| Module-wise count rates for Quadrant A Data is divided into 100 sec bins |
 |
 |
| Module-wise count rates for Quadrant B Data is divided into 100 sec bins |
 |
 |
| Module-wise count rates for Quadrant C Data is divided into 100 sec bins |
 |
 |
| Module-wise count rates for Quadrant D Data is divided into 100 sec bins |
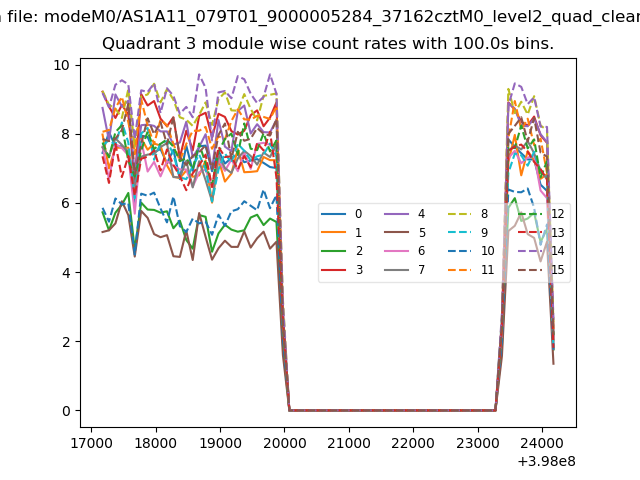 |
 |
| Parameter | Plot |
|---|---|
| CZT HV Monitor | 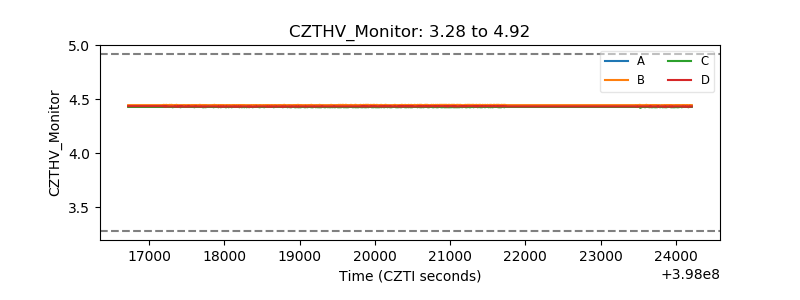 |
| D_VDD | 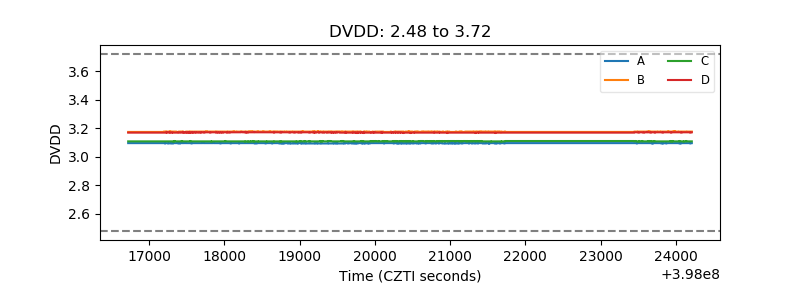 |
| Temperature 1 | 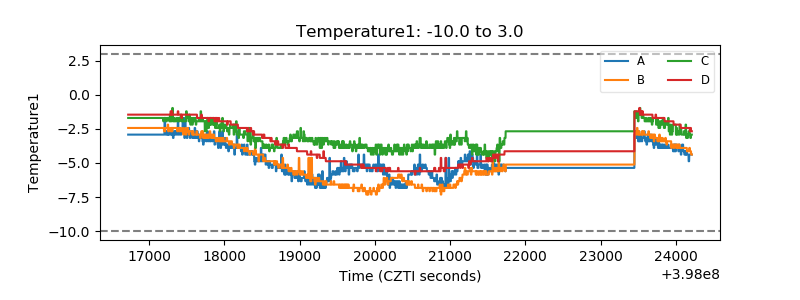 |
| Veto HV Monitor |  |
| Veto LLD | 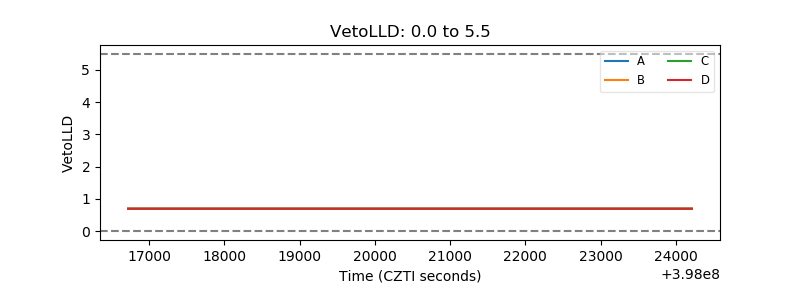 |
| Alpha Counter | 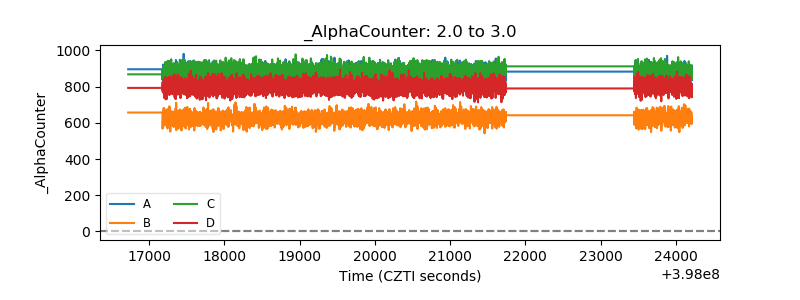 |
| _CPM_Rate | 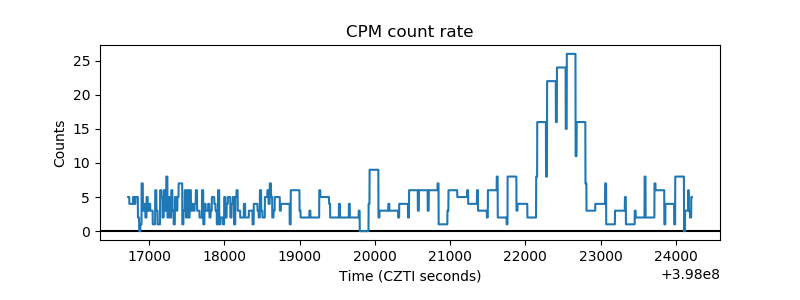 |
| CZT Counter | 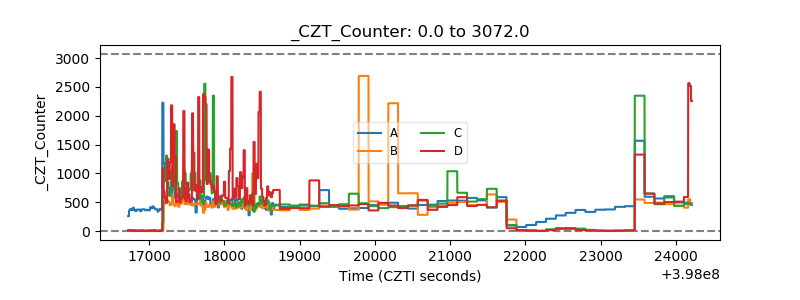 |
| +2.5 Volts monitor | 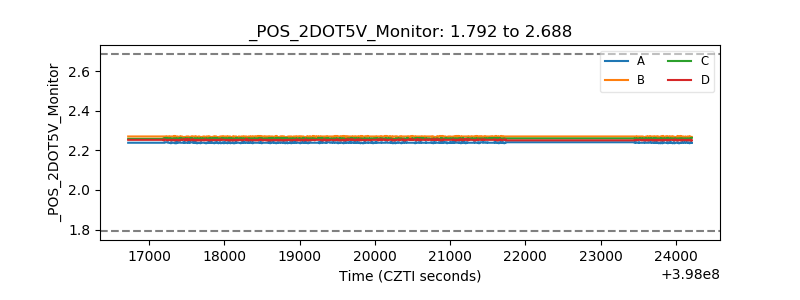 |
| +5 Volts monitor | 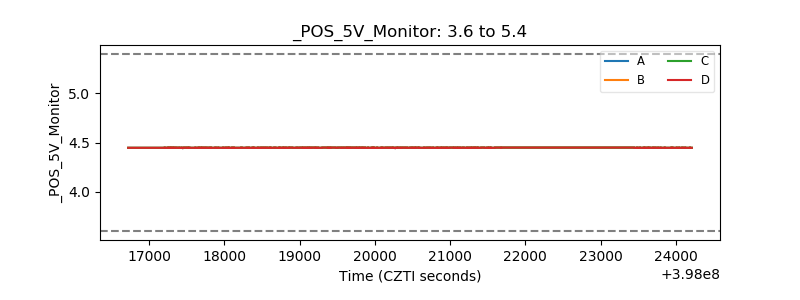 |
| _ROLL_ROT | 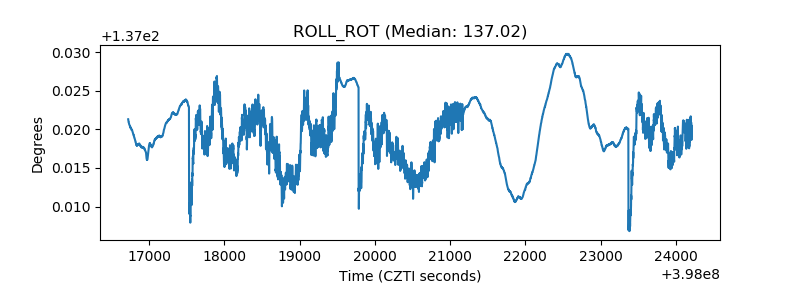 |
| _Roll_DEC | 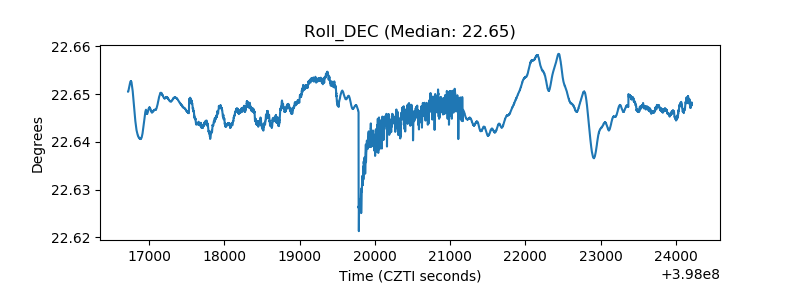 |
| _Roll_RA | 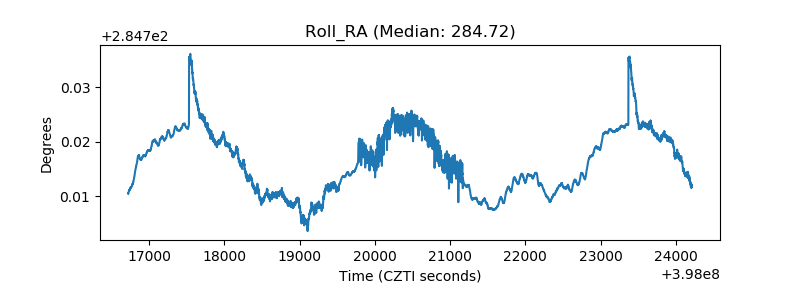 |
| Veto Counter | 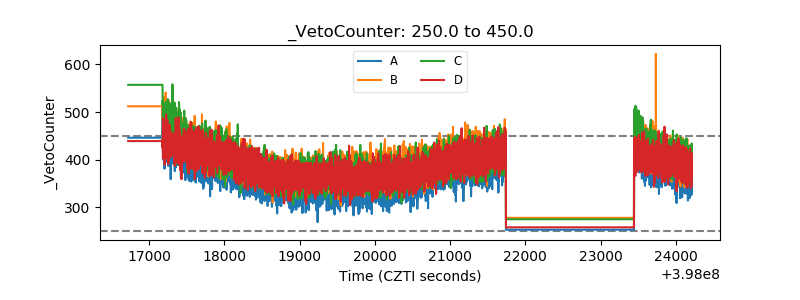 |