| Param | Original file | Final file |
|---|---|---|
| Filename | modeM0/AS1A11_079T01_9000005284_37163cztM0_level2.evt | modeM0/AS1A11_079T01_9000005284_37163cztM0_level2_quad_clean.evt |
| Size (bytes) | 449,723,520 | 68,892,480 |
| Size | 428.9 MB | 65.7 MB |
| Events in quadrant A | 2,809,254 | 429,794 |
| Events in quadrant B | 3,088,205 | 432,082 |
| Events in quadrant C | 3,004,630 | 428,949 |
| Events in quadrant D | 4,329,655 | 395,575 |
| Mode M9 | |||
|---|---|---|---|
| Quadrant | BADHDUFLAG | Total packets | Discarded packets |
| A | 0 | 26 | 0 |
| B | 0 | 26 | 0 |
| C | 0 | 26 | 0 |
| D | 0 | 27 | 0 |
| Mode SS | |||
|---|---|---|---|
| Quadrant | BADHDUFLAG | Total packets | Discarded packets |
| A | 0 | 116 | 0 |
| B | 0 | 116 | 0 |
| C | 0 | 116 | 0 |
| D | 0 | 116 | 0 |
| Mode M0 | |||
|---|---|---|---|
| Quadrant | BADHDUFLAG | Total packets | Discarded packets |
| A | 0 | 12056 | 3 |
| B | 0 | 12962 | 2 |
| C | 0 | 12457 | 2 |
| D | 0 | 16842 | 2 |
| Quadrant | Total seconds | Saturated seconds | Saturation percentage |
|---|---|---|---|
| A | 5714 | 11 | 0.192510% |
| B | 5714 | 79 | 1.382569% |
| C | 5714 | 53 | 0.927546% |
| D | 5714 | 369 | 6.457823% |
Noise dominated data is calculated using 1-second bins in cleaned event files. If a bin has >2000 counts, and if more than 50% of those come from <1% of pixels, then it is considered to be noise-dominated and hence unusable.
| Quadrant | # 1 sec bins | Bins with >0 counts | Bins with >2000 counts | High rate bins dominated by noise | Noise dominated (total time) | Noise dominated (detector-on time) | Marked lightcurve |
|---|---|---|---|---|---|---|---|
| A | 7117 | 5715 | 8 | 8 | 0.11% | 0.14% | 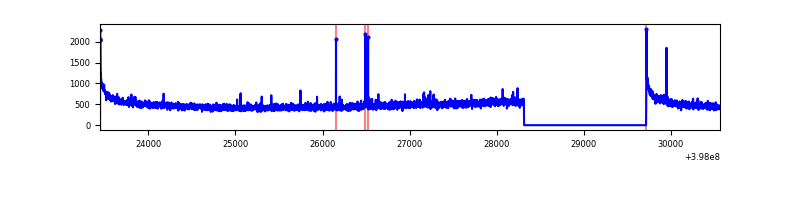 |
| B | 7117 | 5715 | 50 | 50 | 0.70% | 0.87% | 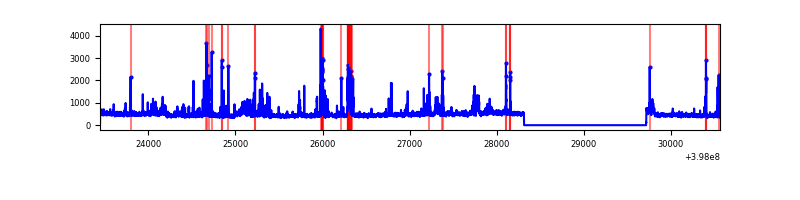 |
| C | 7117 | 5715 | 57 | 57 | 0.80% | 1.00% | 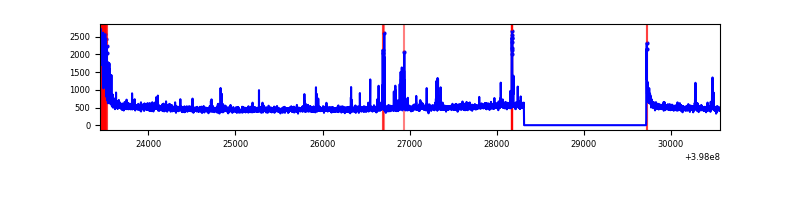 |
| D | 7117 | 5715 | 433 | 433 | 6.08% | 7.58% | 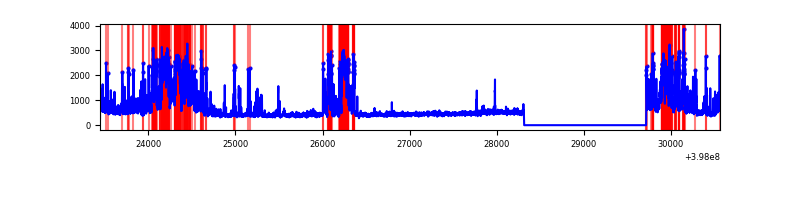 |
Top three noisy pixels from each quadrant. If the there are fewer than three noisy pixels in the level2.evt file, extra rows are filled as -1
| Pixel properties | Quadrant properties | ||||||
|---|---|---|---|---|---|---|---|
| Quadrant | DetID | PixID | Counts | Sigma | Mean | Median | Sigma |
| A | 10 | 83 | 271032 | 2054.79 | 646 | 634 | 131.6 |
| A | 7 | 3 | 15832 | 115.49 | 646 | 634 | 131.6 |
| A | 9 | 143 | 8007 | 56.03 | 646 | 634 | 131.6 |
| B | 5 | 172 | 238059 | 1902.48 | 638 | 619 | 124.8 |
| B | 0 | 213 | 68468 | 543.64 | 638 | 619 | 124.8 |
| B | 4 | 232 | 66034 | 524.13 | 638 | 619 | 124.8 |
| C | 15 | 214 | 241922 | 1632.18 | 629 | 634 | 147.8 |
| C | 0 | 10 | 205970 | 1388.99 | 629 | 634 | 147.8 |
| C | 14 | 254 | 53360 | 356.66 | 629 | 634 | 147.8 |
| D | 2 | 153 | 915586 | 6086.84 | 619 | 602 | 150.3 |
| D | 13 | 249 | 495177 | 3290.11 | 619 | 602 | 150.3 |
| D | 2 | 249 | 377375 | 2506.45 | 619 | 602 | 150.3 |
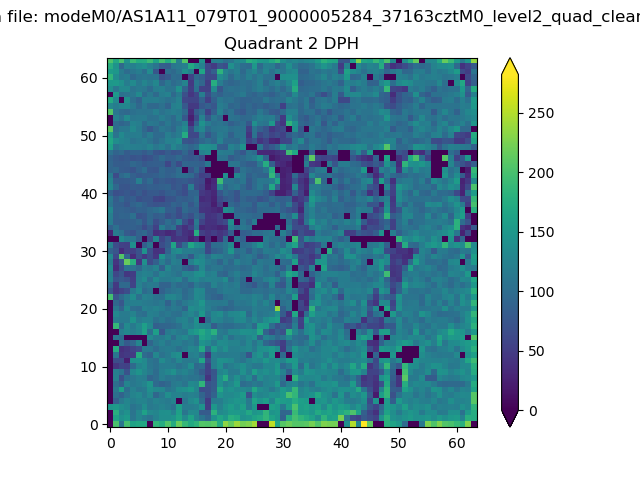
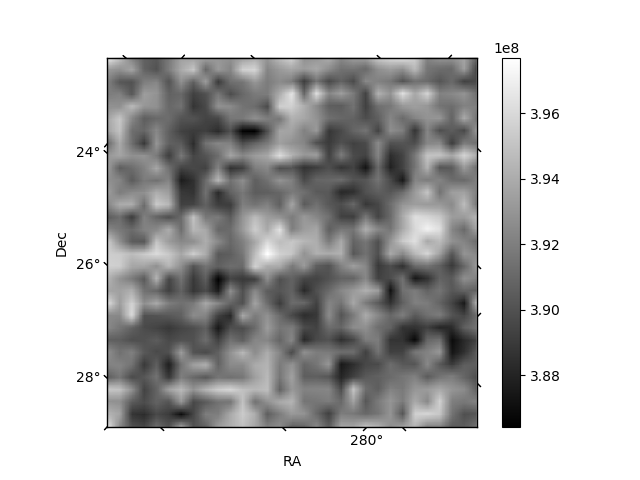
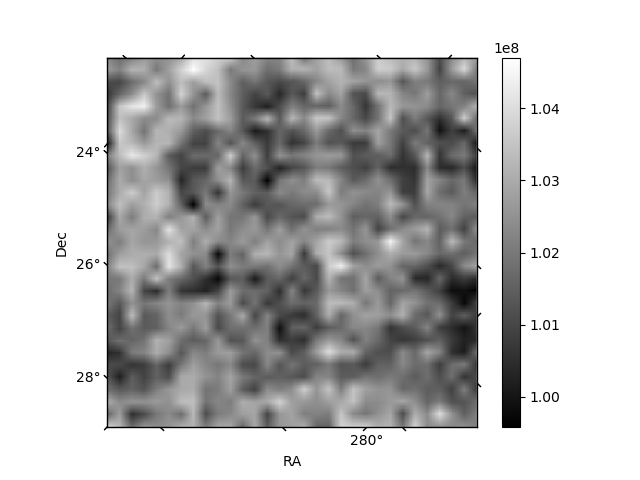
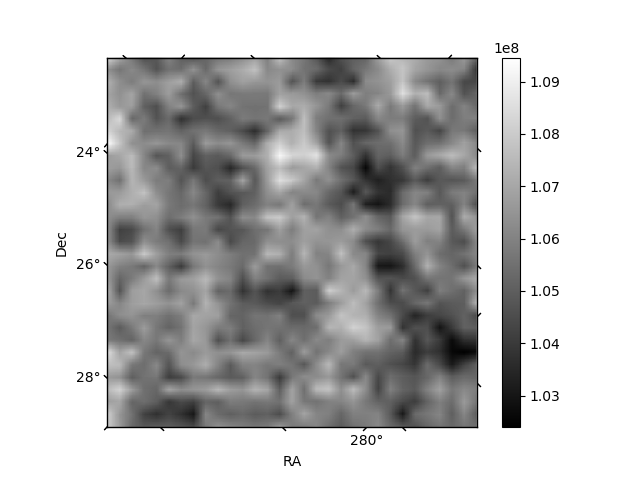
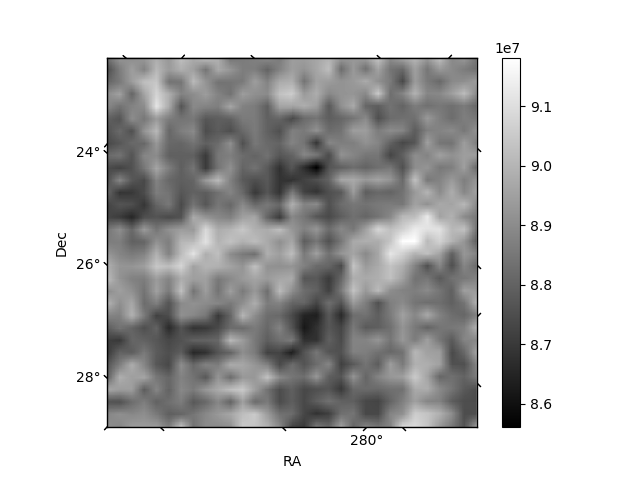
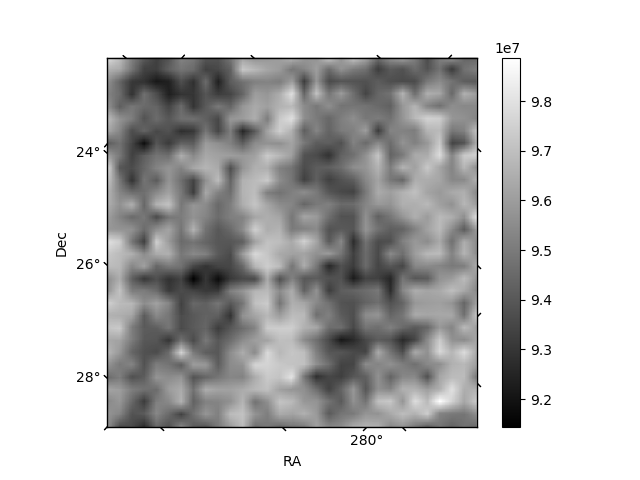
Histogram calculated using DETX and DETY for each event in the final _common_clean file
| Quadrant A | 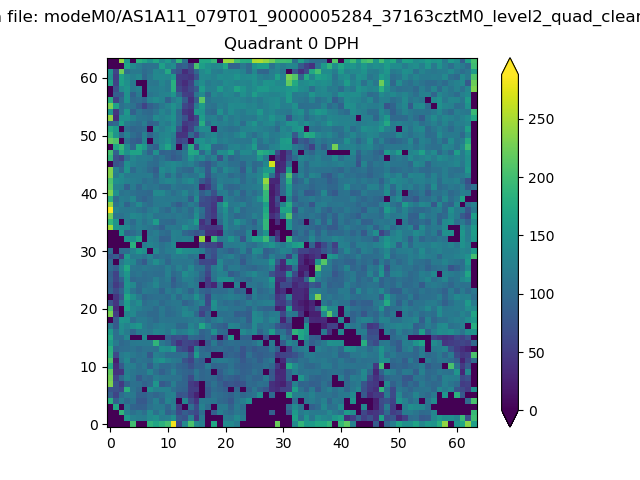 |
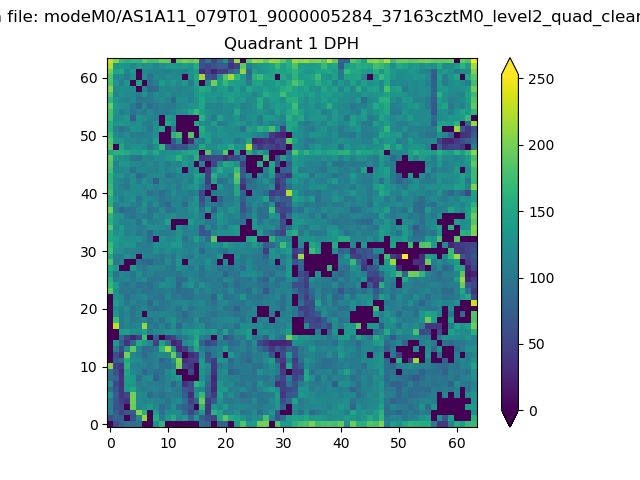 |
Quadrant B |
|---|---|---|---|
| Quadrant D | 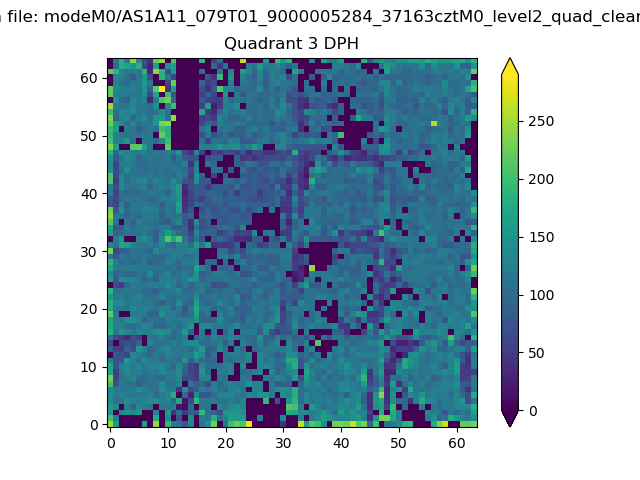 |
 |
Quadrant C |
| Plot type | Count rate plots | Images |
|---|---|---|
| Comparison with Poisson distribution Blue bars denote a histogram of data divided into 1 sec bins. Red curve is a Poisson curve with rate = median count rate of data. |
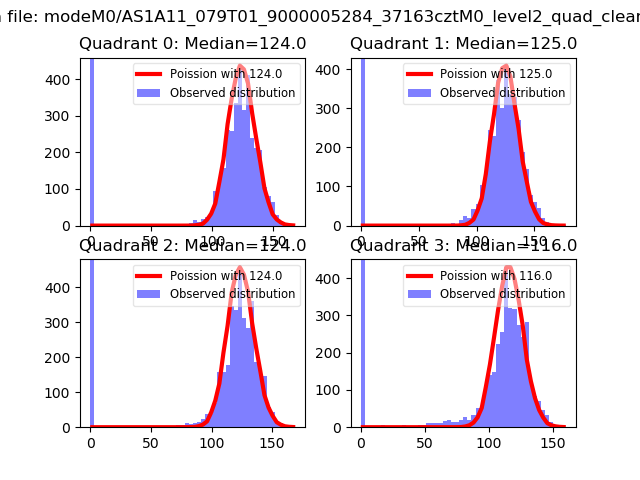 |
 |
| Quadrant-wise count rates Data is divided into 100 sec bins |
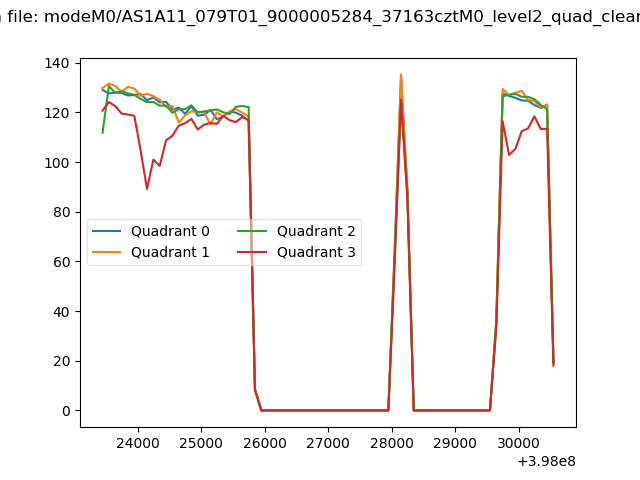 |
|
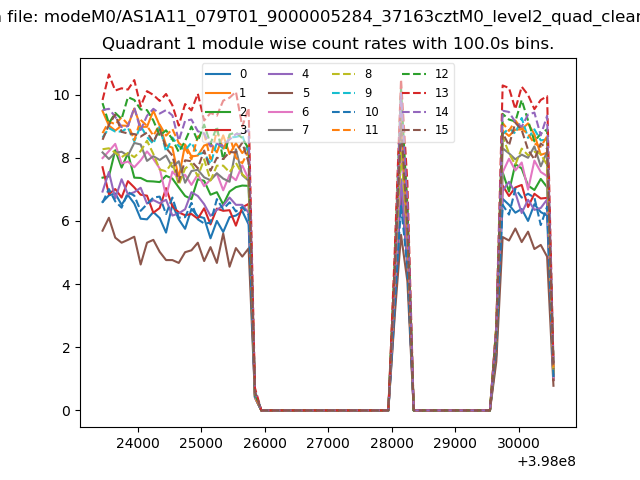
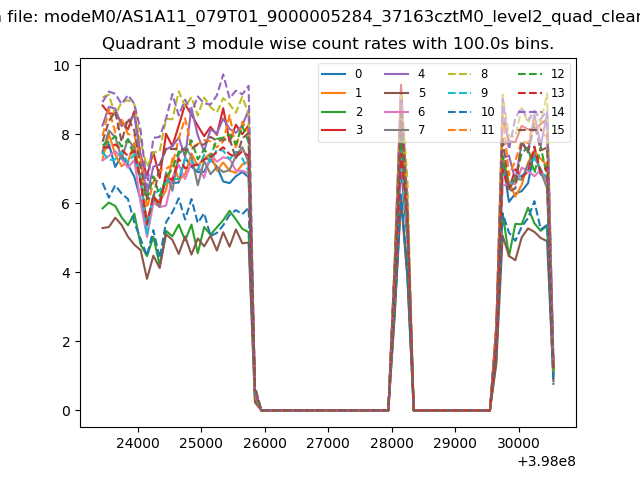
| Module-wise count rates for Quadrant A Data is divided into 100 sec bins |
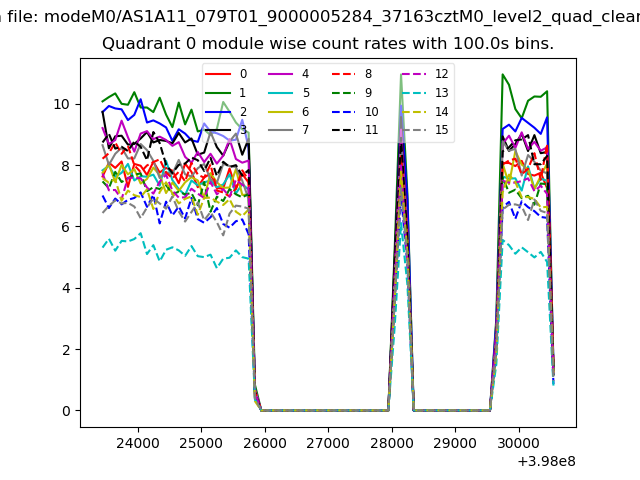 |
 |
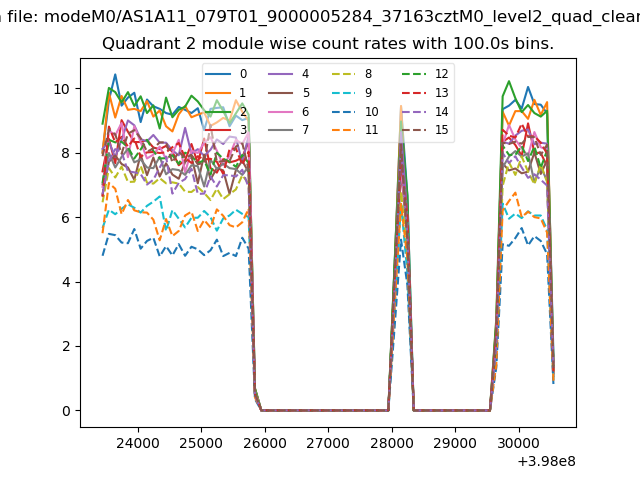
| Module-wise count rates for Quadrant B Data is divided into 100 sec bins |
 |
 |
| Module-wise count rates for Quadrant C Data is divided into 100 sec bins |
 |
 |
| Module-wise count rates for Quadrant D Data is divided into 100 sec bins |
 |
 |
| Parameter | Plot |
|---|---|
| CZT HV Monitor | 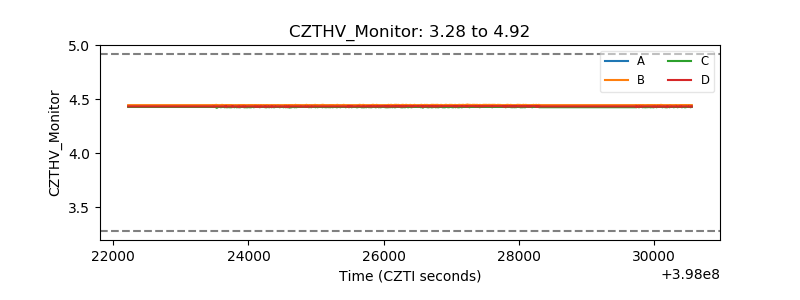 |
| D_VDD | 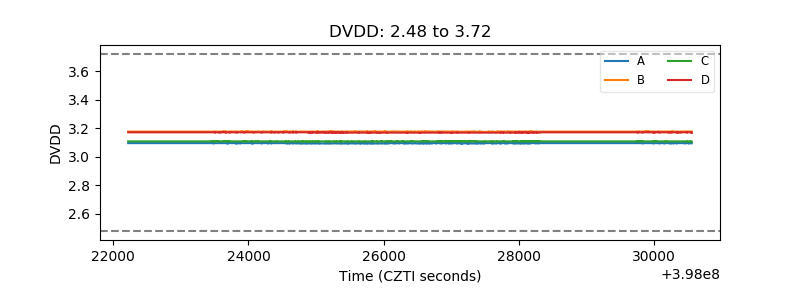 |
| Temperature 1 | 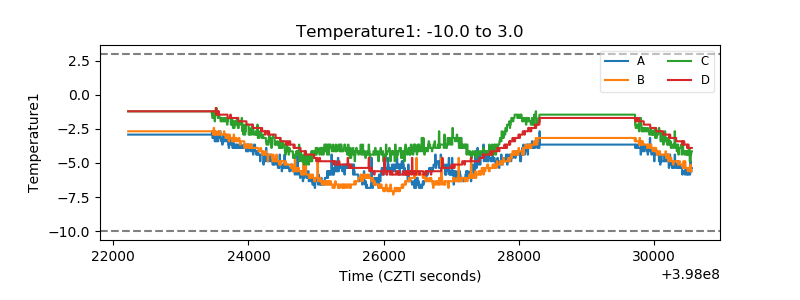 |
| Veto HV Monitor |  |
| Veto LLD | 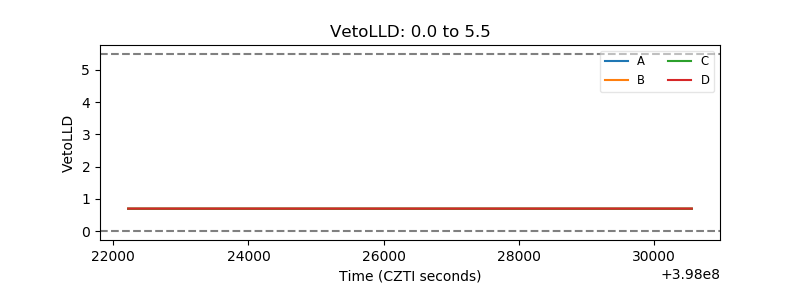 |
| Alpha Counter |  |
| _CPM_Rate | 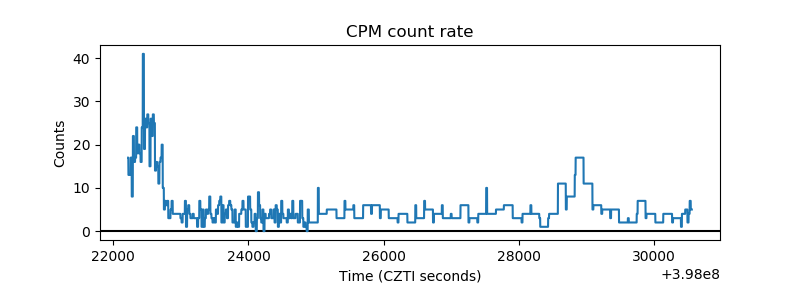 |
| CZT Counter | 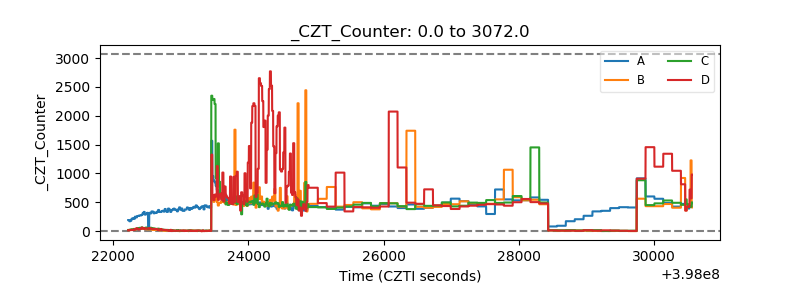 |
| +2.5 Volts monitor | 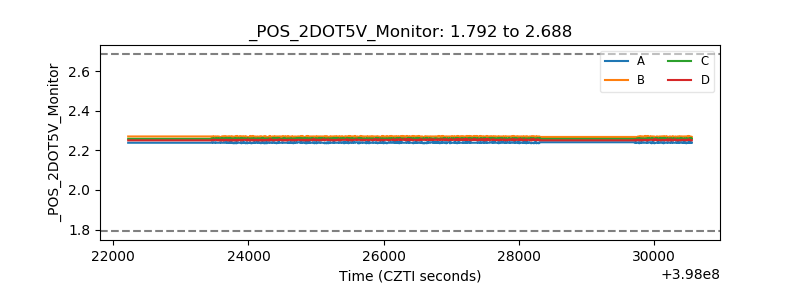 |
| +5 Volts monitor |  |
| _ROLL_ROT | 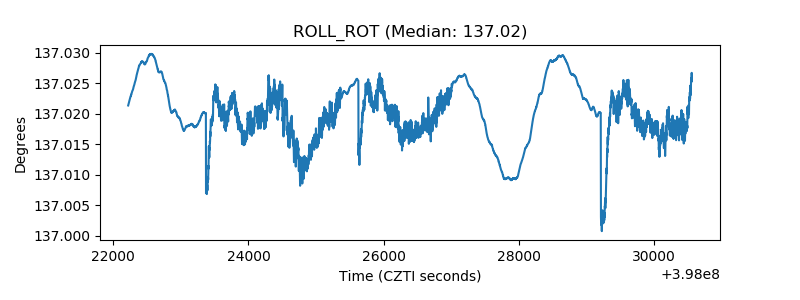 |
| _Roll_DEC | 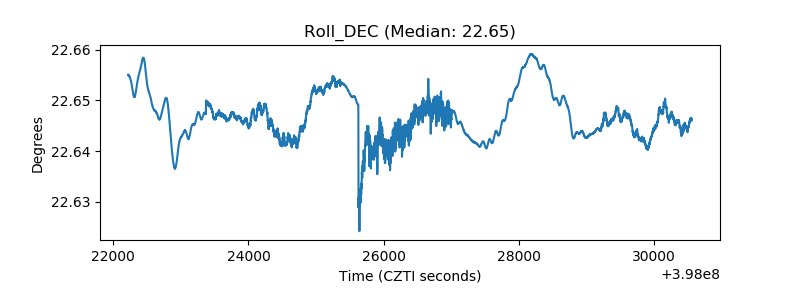 |
| _Roll_RA | 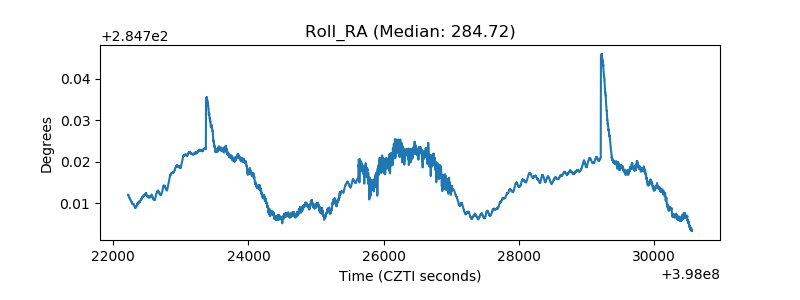 |
| Veto Counter | 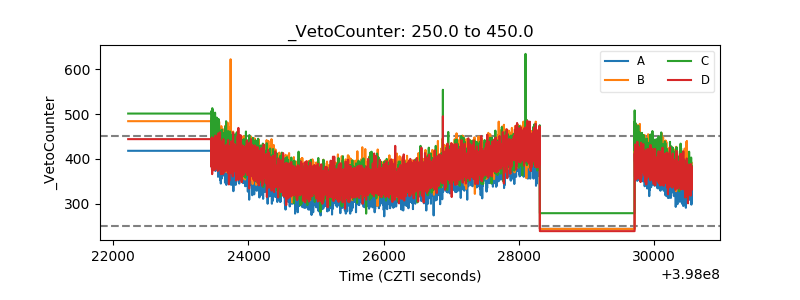 |