| Param | Original file | Final file |
|---|---|---|
| Filename | modeM0/AS1A11_079T01_9000005284_37164cztM0_level2.evt | modeM0/AS1A11_079T01_9000005284_37164cztM0_level2_quad_clean.evt |
| Size (bytes) | 441,066,240 | 72,590,400 |
| Size | 420.6 MB | 69.2 MB |
| Events in quadrant A | 2,936,412 | 455,883 |
| Events in quadrant B | 3,229,697 | 452,410 |
| Events in quadrant C | 3,053,313 | 454,459 |
| Events in quadrant D | 3,736,393 | 421,873 |
| Mode M9 | |||
|---|---|---|---|
| Quadrant | BADHDUFLAG | Total packets | Discarded packets |
| A | 0 | 22 | 0 |
| B | 0 | 22 | 0 |
| C | 0 | 22 | 0 |
| D | 0 | 23 | 0 |
| Mode SS | |||
|---|---|---|---|
| Quadrant | BADHDUFLAG | Total packets | Discarded packets |
| A | 0 | 122 | 0 |
| B | 0 | 122 | 0 |
| C | 0 | 122 | 0 |
| D | 0 | 122 | 0 |
| Mode M0 | |||
|---|---|---|---|
| Quadrant | BADHDUFLAG | Total packets | Discarded packets |
| A | 0 | 12552 | 3 |
| B | 0 | 13615 | 2 |
| C | 0 | 12697 | 2 |
| D | 0 | 15315 | 2 |
| Quadrant | Total seconds | Saturated seconds | Saturation percentage |
|---|---|---|---|
| A | 5910 | 14 | 0.236887% |
| B | 5910 | 103 | 1.742809% |
| C | 5910 | 34 | 0.575296% |
| D | 5910 | 259 | 4.382403% |
Noise dominated data is calculated using 1-second bins in cleaned event files. If a bin has >2000 counts, and if more than 50% of those come from <1% of pixels, then it is considered to be noise-dominated and hence unusable.
| Quadrant | # 1 sec bins | Bins with >0 counts | Bins with >2000 counts | High rate bins dominated by noise | Noise dominated (total time) | Noise dominated (detector-on time) | Marked lightcurve |
|---|---|---|---|---|---|---|---|
| A | 7223 | 5911 | 12 | 12 | 0.17% | 0.20% | 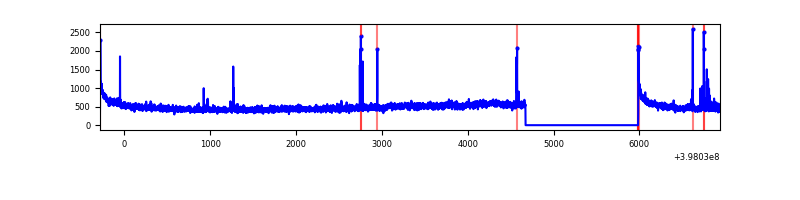 |
| B | 7223 | 5910 | 59 | 59 | 0.82% | 1.00% | 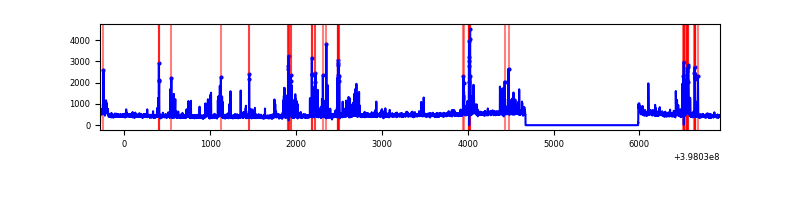 |
| C | 7223 | 5911 | 25 | 25 | 0.35% | 0.42% | 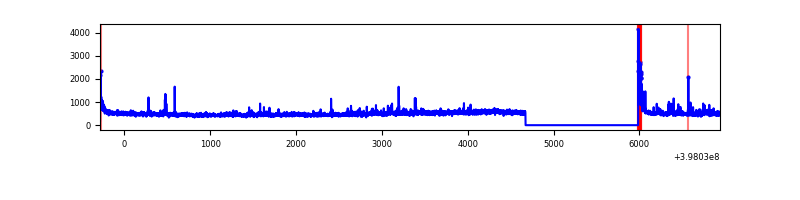 |
| D | 7223 | 5911 | 250 | 250 | 3.46% | 4.23% | 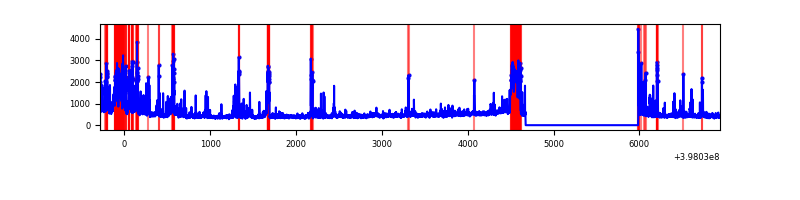 |
Top three noisy pixels from each quadrant. If the there are fewer than three noisy pixels in the level2.evt file, extra rows are filled as -1
| Pixel properties | Quadrant properties | ||||||
|---|---|---|---|---|---|---|---|
| Quadrant | DetID | PixID | Counts | Sigma | Mean | Median | Sigma |
| A | 10 | 83 | 271446 | 1995.48 | 665 | 652 | 135.7 |
| A | 9 | 143 | 41447 | 300.62 | 665 | 652 | 135.7 |
| A | 13 | 6 | 23550 | 168.74 | 665 | 652 | 135.7 |
| B | 5 | 172 | 288542 | 2271.37 | 655 | 636 | 126.8 |
| B | 4 | 232 | 166440 | 1308.07 | 655 | 636 | 126.8 |
| B | 0 | 190 | 61669 | 481.51 | 655 | 636 | 126.8 |
| C | 15 | 214 | 251992 | 1638.04 | 649 | 651 | 153.4 |
| C | 0 | 10 | 196691 | 1277.63 | 649 | 651 | 153.4 |
| C | 14 | 254 | 50628 | 325.71 | 649 | 651 | 153.4 |
| D | 13 | 249 | 509167 | 3263.48 | 639 | 623 | 155.8 |
| D | 2 | 249 | 357373 | 2289.37 | 639 | 623 | 155.8 |
| D | 2 | 153 | 259512 | 1661.37 | 639 | 623 | 155.8 |
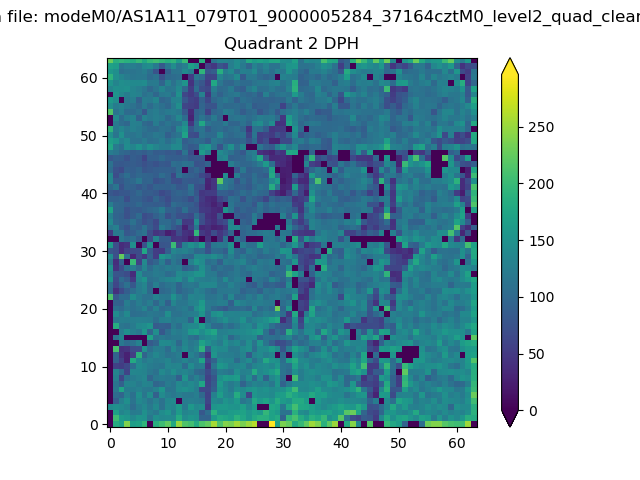
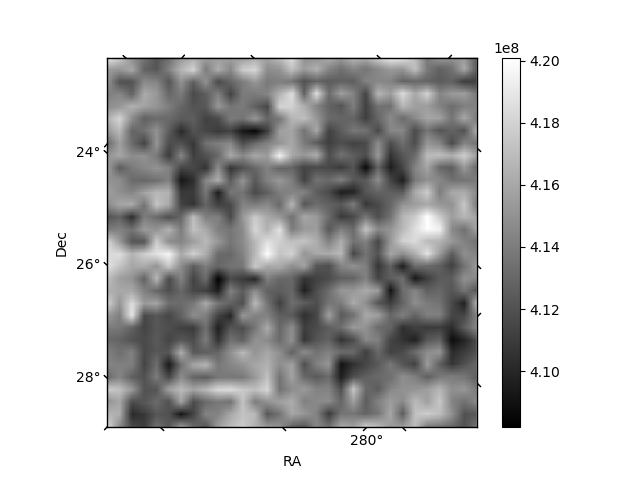
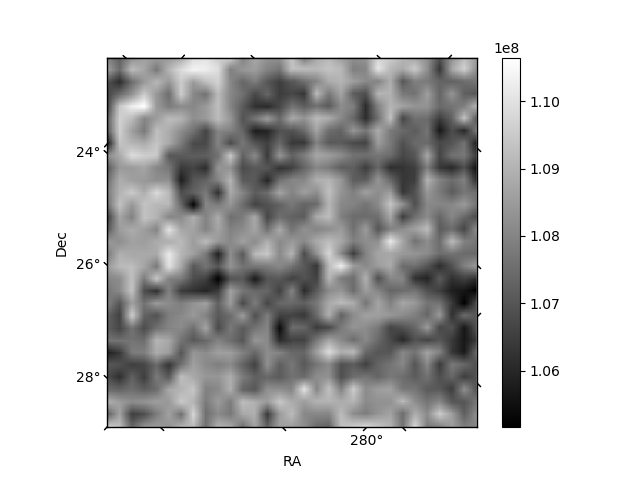
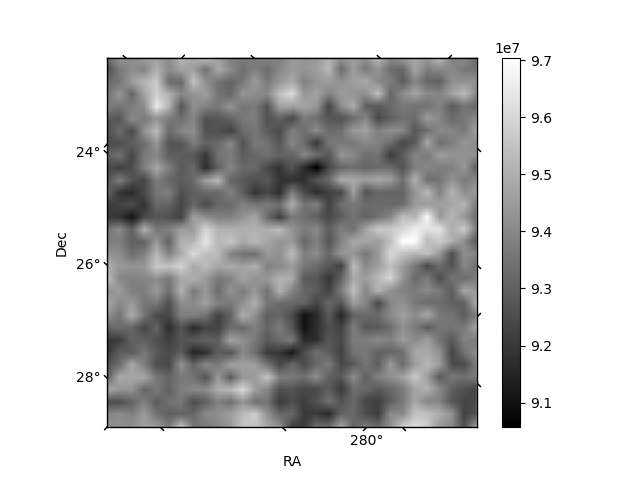
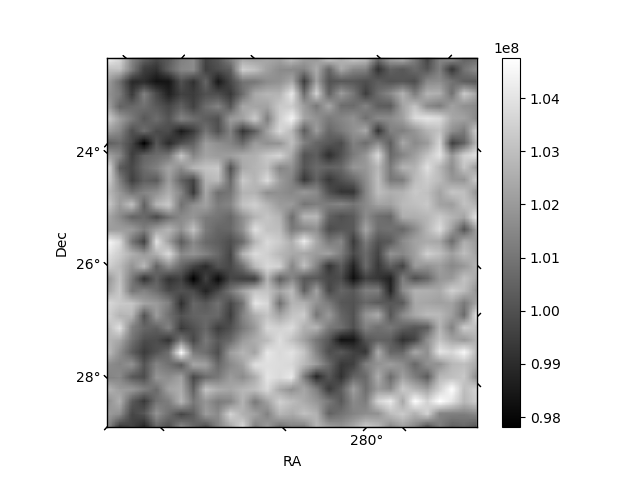
Histogram calculated using DETX and DETY for each event in the final _common_clean file
| Quadrant A | 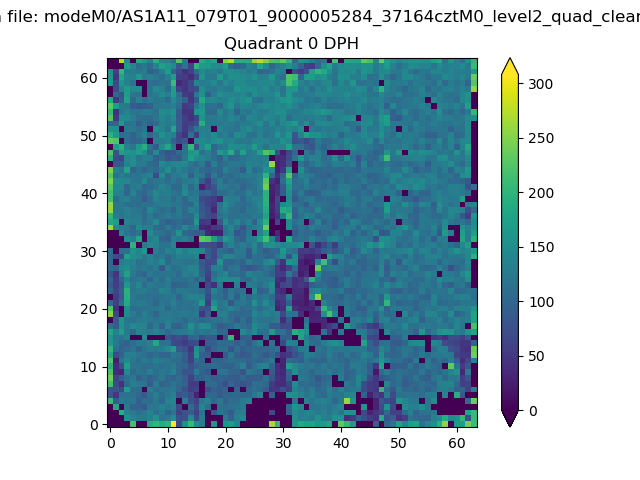 |
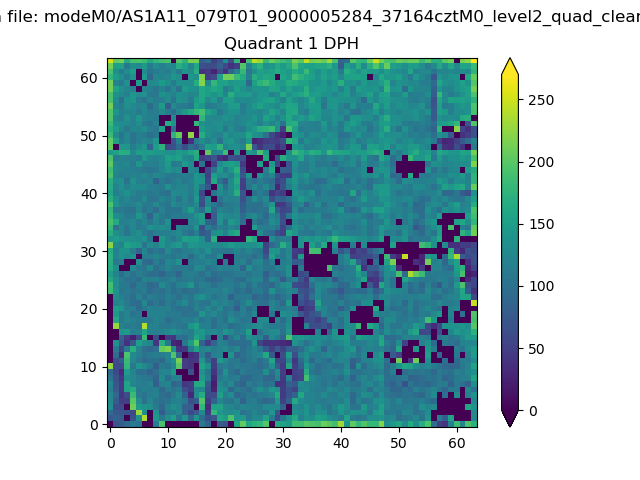 |
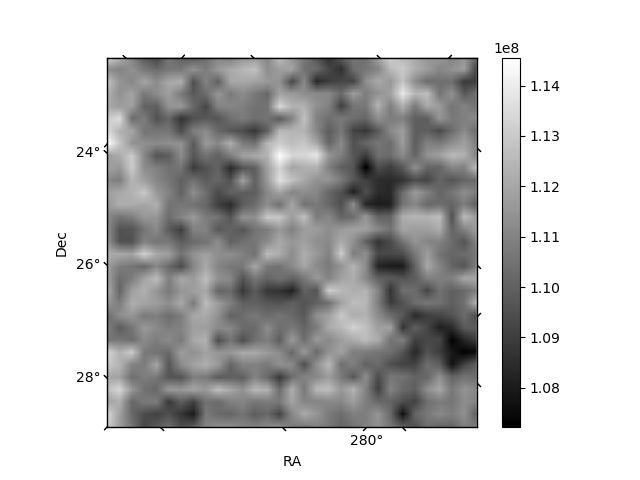
Quadrant B |
|---|---|---|---|
| Quadrant D | 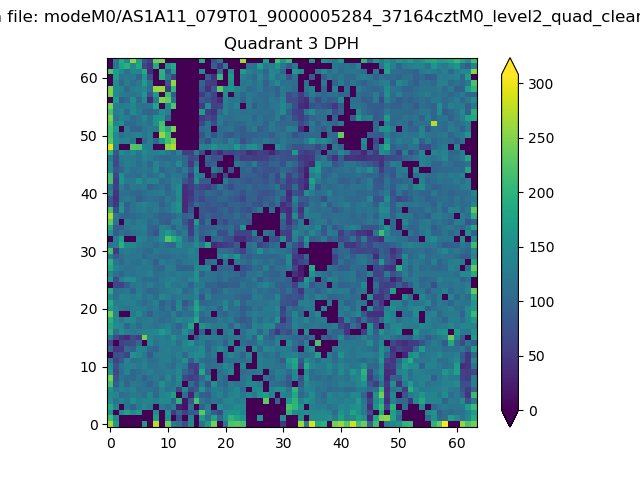 |
 |
Quadrant C |
| Plot type | Count rate plots | Images |
|---|---|---|
| Comparison with Poisson distribution Blue bars denote a histogram of data divided into 1 sec bins. Red curve is a Poisson curve with rate = median count rate of data. |
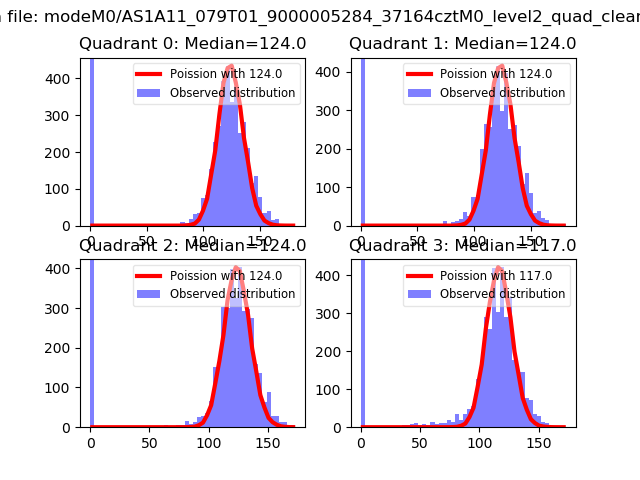 |
 |
| Quadrant-wise count rates Data is divided into 100 sec bins |
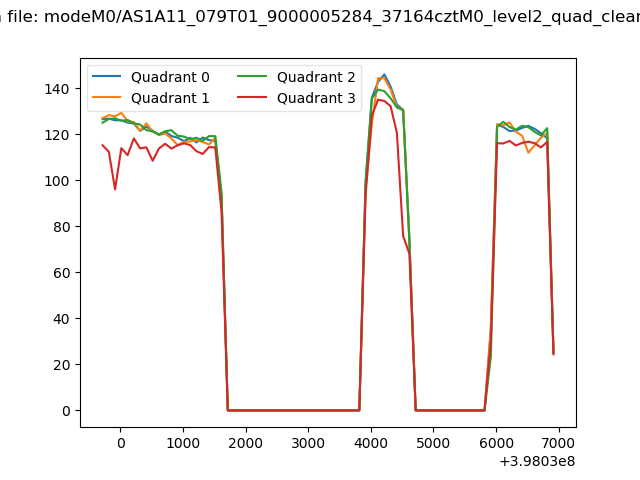 |
|
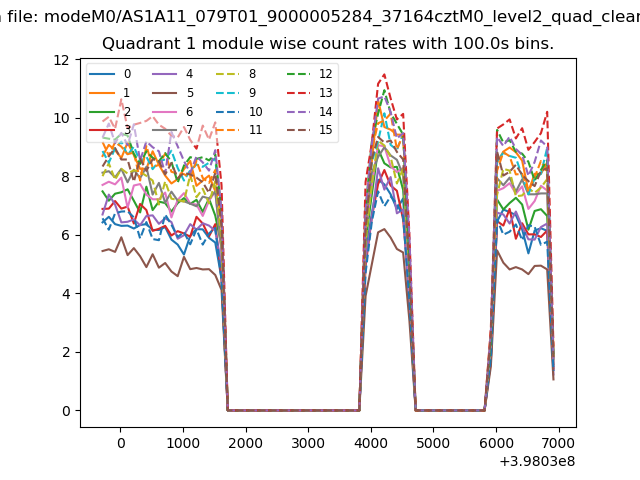
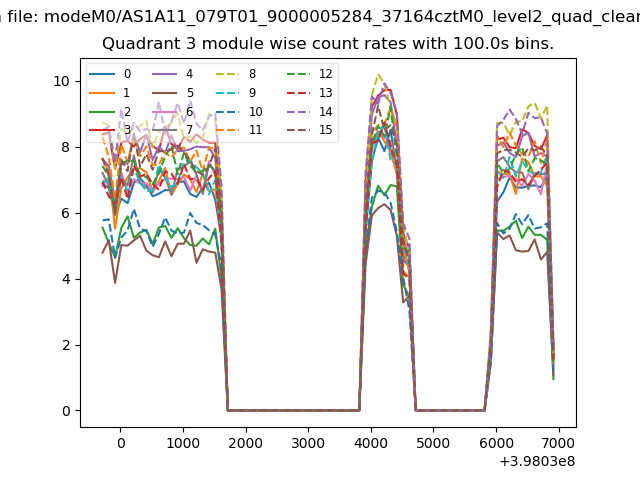
| Module-wise count rates for Quadrant A Data is divided into 100 sec bins |
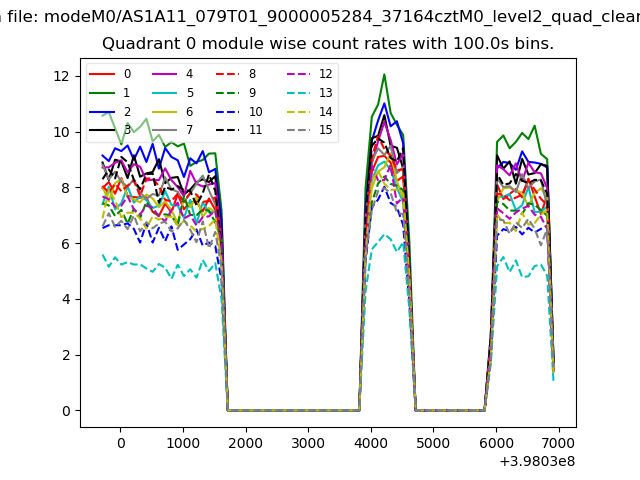 |
 |
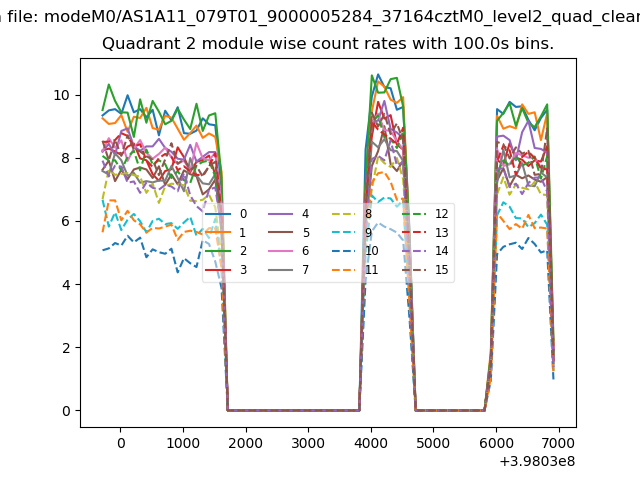
| Module-wise count rates for Quadrant B Data is divided into 100 sec bins |
 |
 |
| Module-wise count rates for Quadrant C Data is divided into 100 sec bins |
 |
 |
| Module-wise count rates for Quadrant D Data is divided into 100 sec bins |
 |
 |
| Parameter | Plot |
|---|---|
| CZT HV Monitor | 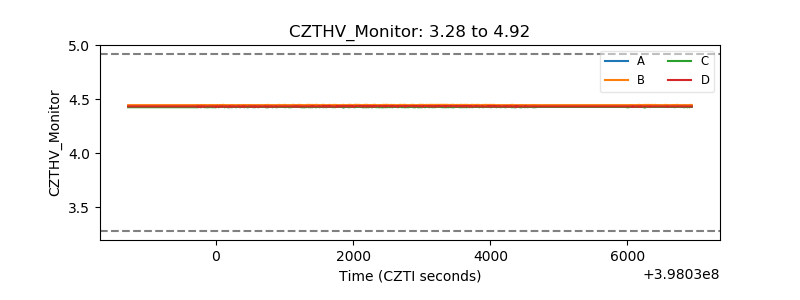 |
| D_VDD | 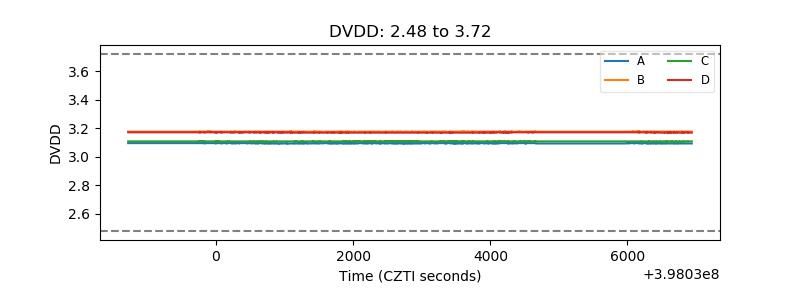 |
| Temperature 1 | 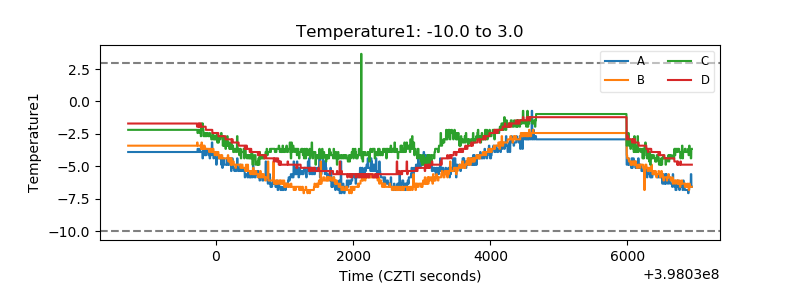 |
| Veto HV Monitor | 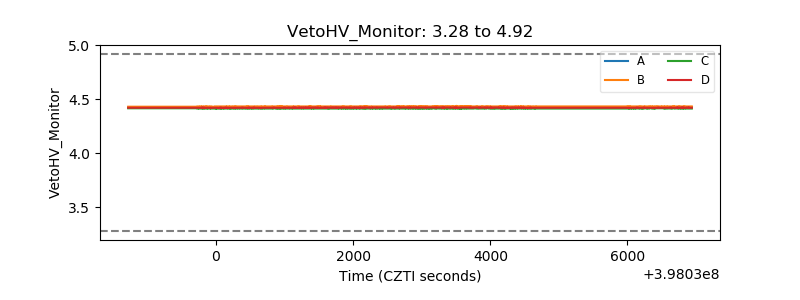 |
| Veto LLD | 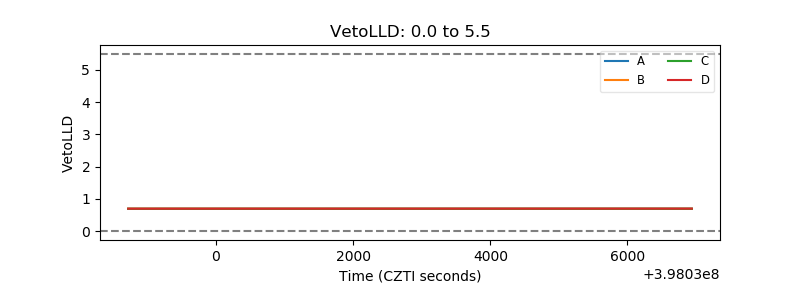 |
| Alpha Counter | 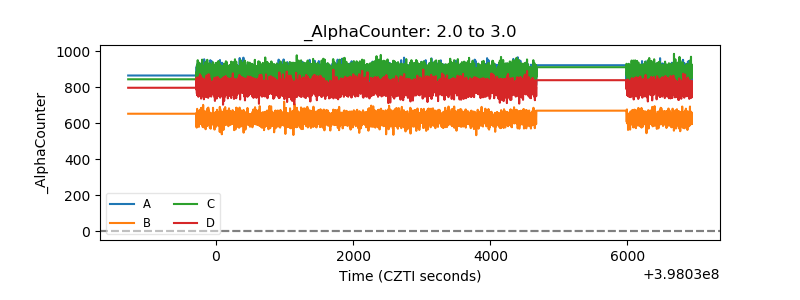 |
| _CPM_Rate | 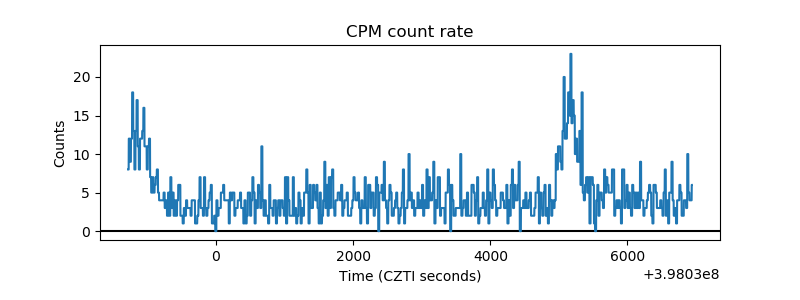 |
| CZT Counter | 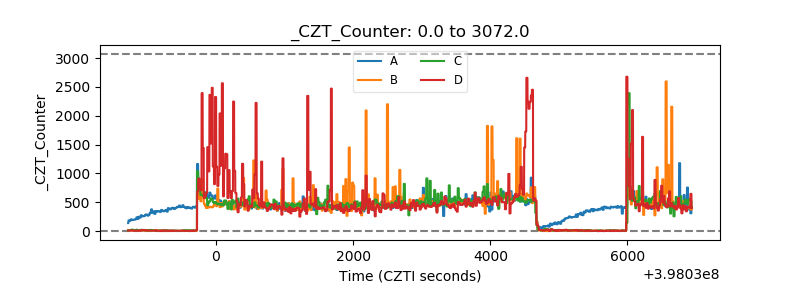 |
| +2.5 Volts monitor | 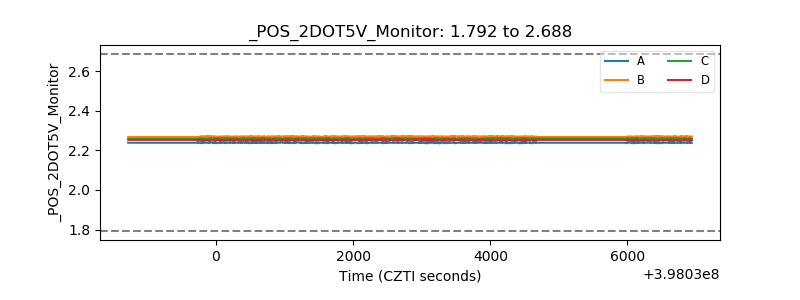 |
| +5 Volts monitor | 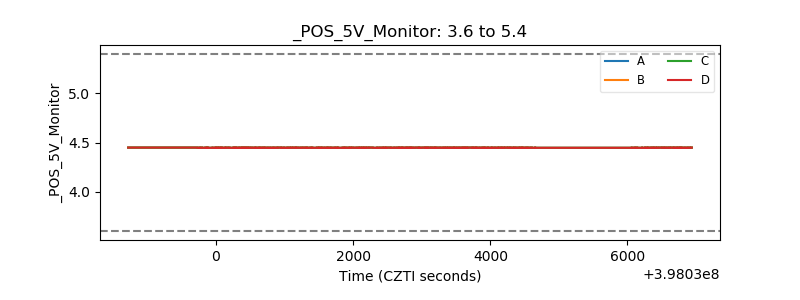 |
| _ROLL_ROT | 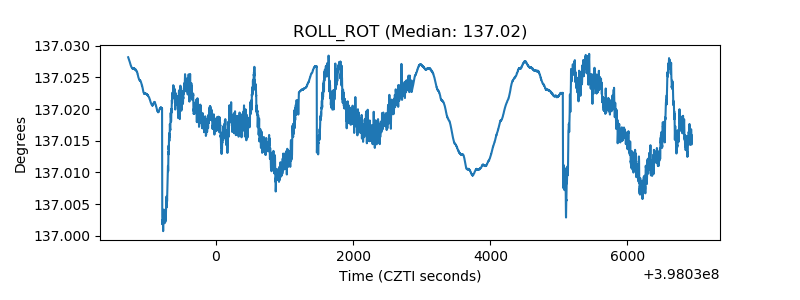 |
| _Roll_DEC | 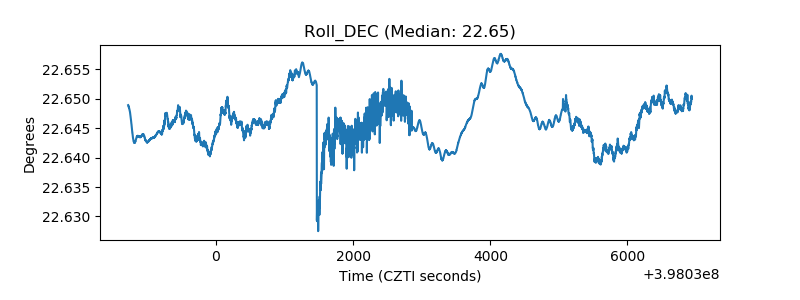 |
| _Roll_RA | 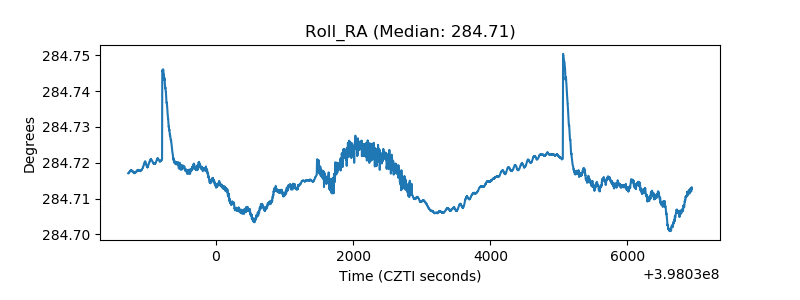 |
| Veto Counter | 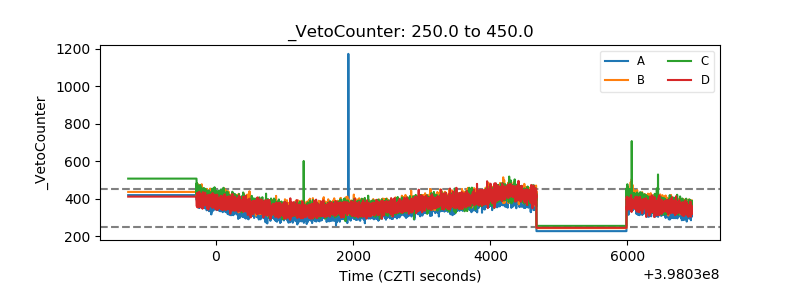 |