| Param | Original file | Final file |
|---|---|---|
| Filename | modeM0/AS1A11_079T01_9000005284_37167cztM0_level2.evt | modeM0/AS1A11_079T01_9000005284_37167cztM0_level2_quad_clean.evt |
| Size (bytes) | 1,233,095,040 | 177,068,160 |
| Size | 1.1 GB | 168.9 MB |
| Events in quadrant A | 8,119,906 | 1,091,774 |
| Events in quadrant B | 9,997,630 | 1,080,431 |
| Events in quadrant C | 8,718,799 | 1,087,791 |
| Events in quadrant D | 9,431,172 | 1,002,240 |
| Mode M9 | |||
|---|---|---|---|
| Quadrant | BADHDUFLAG | Total packets | Discarded packets |
| A | 0 | 55 | 0 |
| B | 0 | 55 | 0 |
| C | 0 | 55 | 0 |
| D | 0 | 55 | 0 |
| Mode SS | |||
|---|---|---|---|
| Quadrant | BADHDUFLAG | Total packets | Discarded packets |
| A | 0 | 326 | 0 |
| B | 0 | 326 | 0 |
| C | 0 | 326 | 0 |
| D | 0 | 326 | 0 |
| Mode M0 | |||
|---|---|---|---|
| Quadrant | BADHDUFLAG | Total packets | Discarded packets |
| A | 0 | 34365 | 5 |
| B | 0 | 40504 | 4 |
| C | 0 | 35665 | 4 |
| D | 0 | 39461 | 4 |
| Quadrant | Total seconds | Saturated seconds | Saturation percentage |
|---|---|---|---|
| A | 15950 | 68 | 0.426332% |
| B | 15950 | 407 | 2.551724% |
| C | 15950 | 184 | 1.153605% |
| D | 15950 | 721 | 4.520376% |
Noise dominated data is calculated using 1-second bins in cleaned event files. If a bin has >2000 counts, and if more than 50% of those come from <1% of pixels, then it is considered to be noise-dominated and hence unusable.
| Quadrant | # 1 sec bins | Bins with >0 counts | Bins with >2000 counts | High rate bins dominated by noise | Noise dominated (total time) | Noise dominated (detector-on time) | Marked lightcurve |
|---|---|---|---|---|---|---|---|
| A | 21471 | 15954 | 33 | 33 | 0.15% | 0.21% | 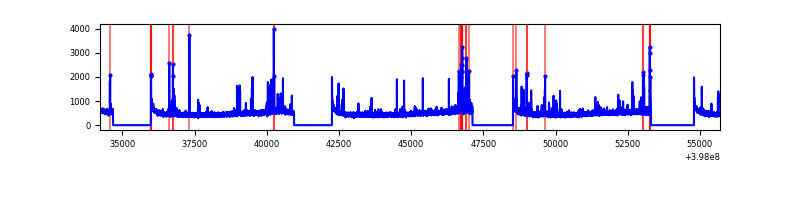 |
| B | 21471 | 15954 | 245 | 245 | 1.14% | 1.54% | 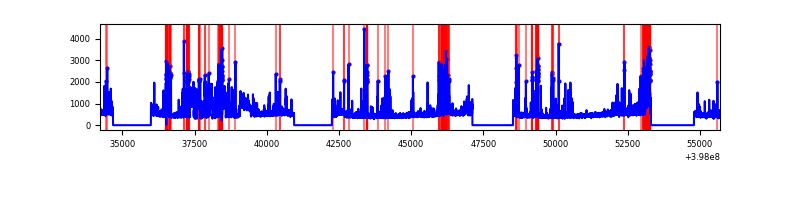 |
| C | 21471 | 15954 | 150 | 150 | 0.70% | 0.94% | 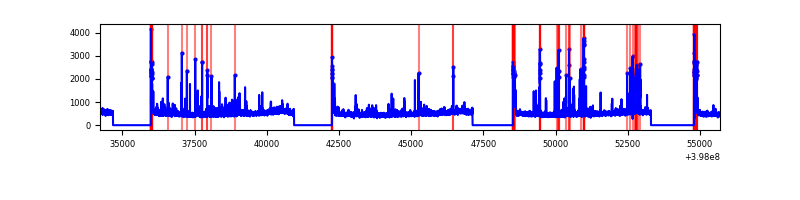 |
| D | 21471 | 15954 | 532 | 532 | 2.48% | 3.33% | 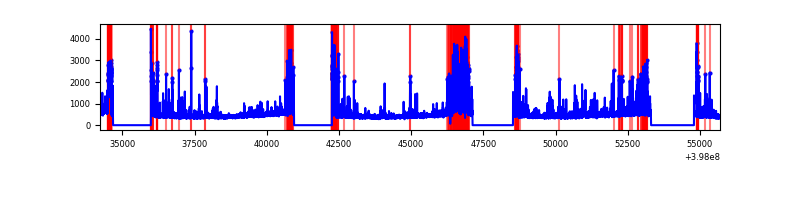 |
Top three noisy pixels from each quadrant. If the there are fewer than three noisy pixels in the level2.evt file, extra rows are filled as -1
| Pixel properties | Quadrant properties | ||||||
|---|---|---|---|---|---|---|---|
| Quadrant | DetID | PixID | Counts | Sigma | Mean | Median | Sigma |
| A | 10 | 83 | 637294 | 1721.77 | 1827 | 1790 | 369.1 |
| A | 7 | 16 | 129998 | 347.35 | 1827 | 1790 | 369.1 |
| A | 9 | 143 | 128727 | 343.91 | 1827 | 1790 | 369.1 |
| B | 4 | 251 | 1015428 | 2959.17 | 1792 | 1745 | 342.6 |
| B | 5 | 172 | 851390 | 2480.31 | 1792 | 1745 | 342.6 |
| B | 0 | 190 | 363911 | 1057.25 | 1792 | 1745 | 342.6 |
| C | 15 | 214 | 669772 | 1611.26 | 1774 | 1783 | 414.6 |
| C | 0 | 10 | 587099 | 1411.84 | 1774 | 1783 | 414.6 |
| C | 14 | 254 | 434094 | 1042.78 | 1774 | 1783 | 414.6 |
| D | 2 | 249 | 1656913 | 3931.43 | 1739 | 1697 | 421.0 |
| D | 13 | 249 | 411344 | 972.98 | 1739 | 1697 | 421.0 |
| D | 13 | 171 | 153117 | 359.65 | 1739 | 1697 | 421.0 |
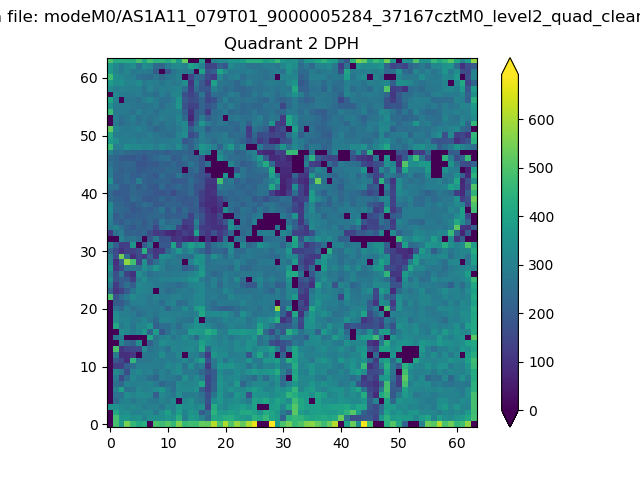
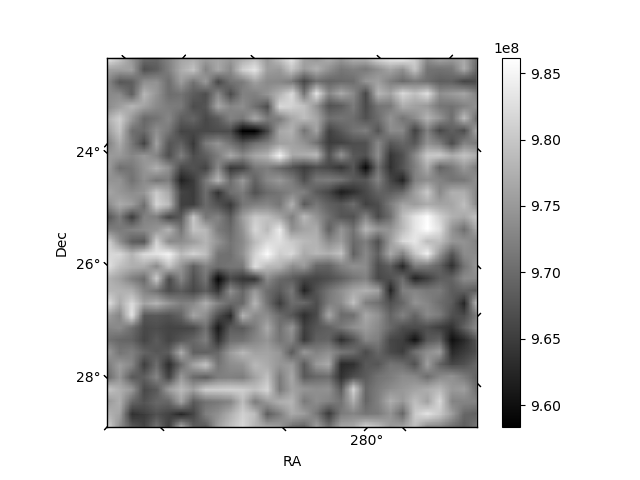
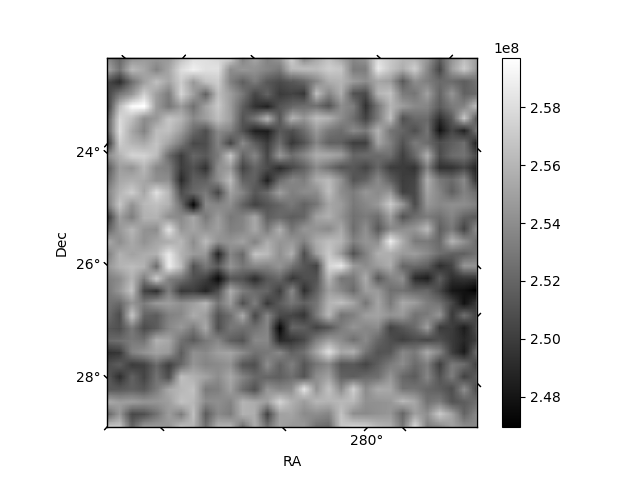
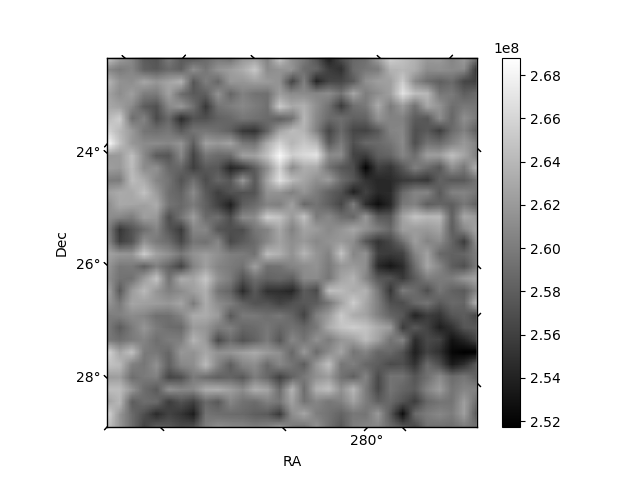
Histogram calculated using DETX and DETY for each event in the final _common_clean file
| Quadrant A | 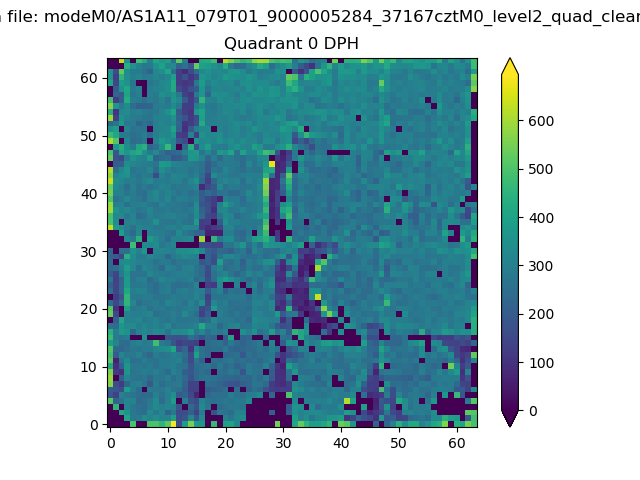 |
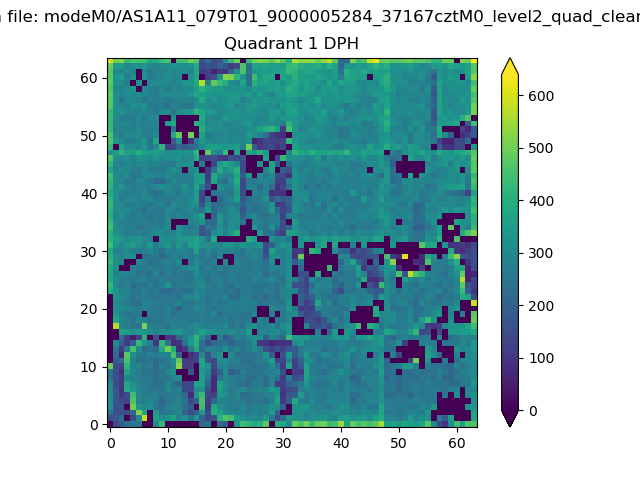 |
Quadrant B |
|---|---|---|---|
| Quadrant D | 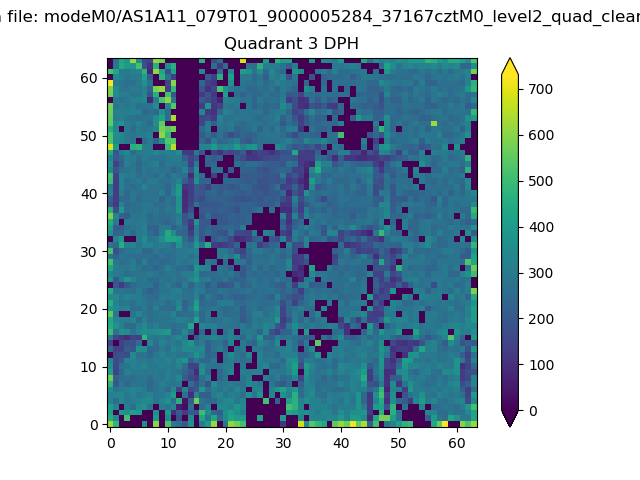 |
 |
Quadrant C |
| Plot type | Count rate plots | Images |
|---|---|---|
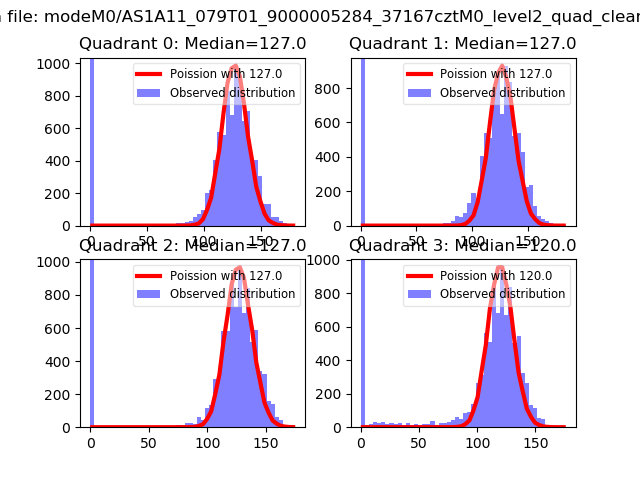
| Comparison with Poisson distribution Blue bars denote a histogram of data divided into 1 sec bins. Red curve is a Poisson curve with rate = median count rate of data. |
 |
 |
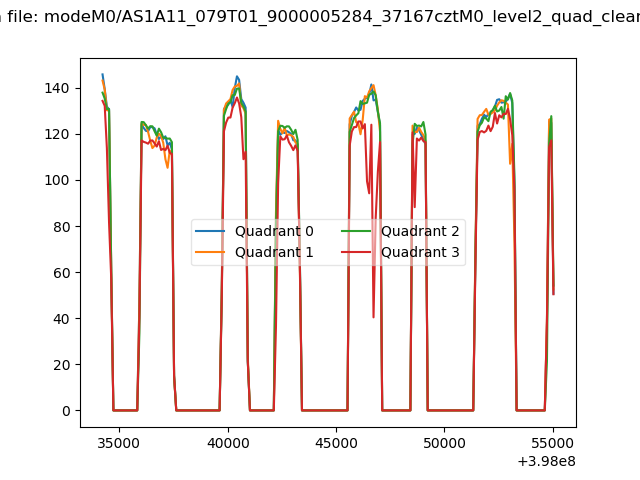
| Quadrant-wise count rates Data is divided into 100 sec bins |
 |
|
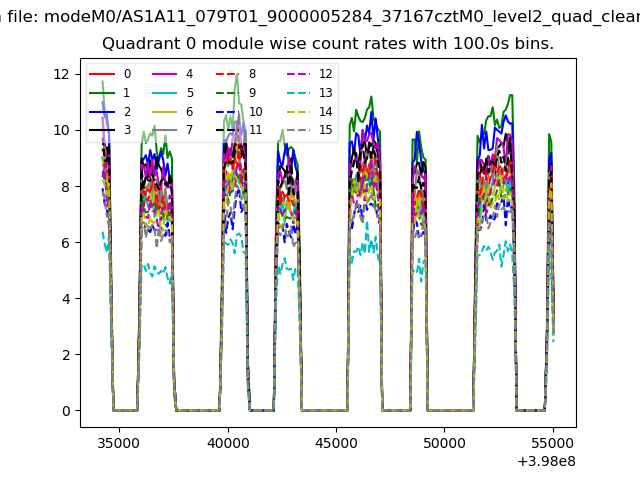
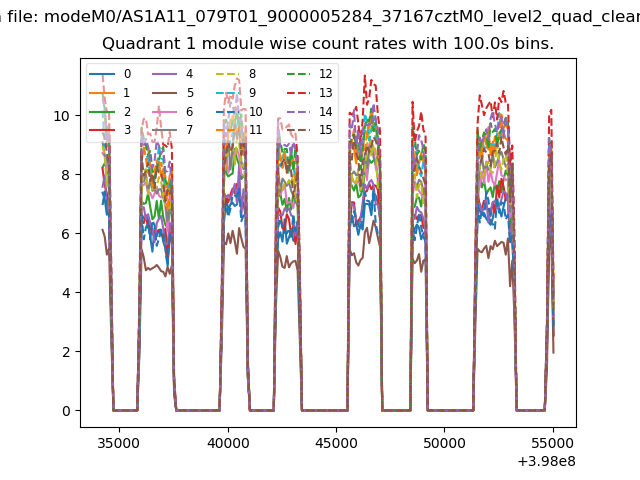
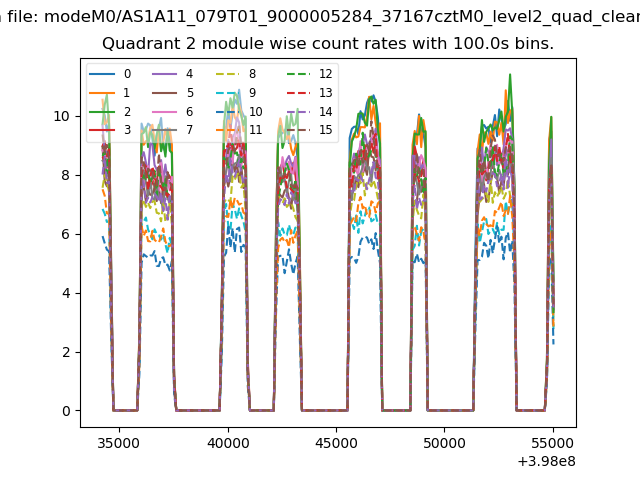
| Module-wise count rates for Quadrant A Data is divided into 100 sec bins |
 |
 |
| Module-wise count rates for Quadrant B Data is divided into 100 sec bins |
 |
 |
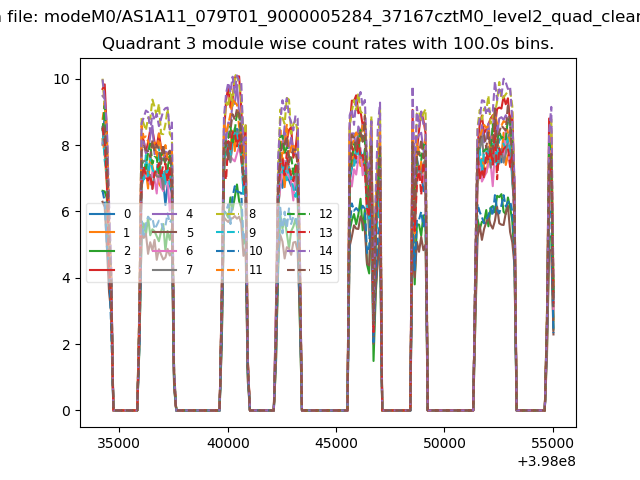
| Module-wise count rates for Quadrant C Data is divided into 100 sec bins |
 |
 |
| Module-wise count rates for Quadrant D Data is divided into 100 sec bins |
 |
 |
| Parameter | Plot |
|---|---|
| CZT HV Monitor | 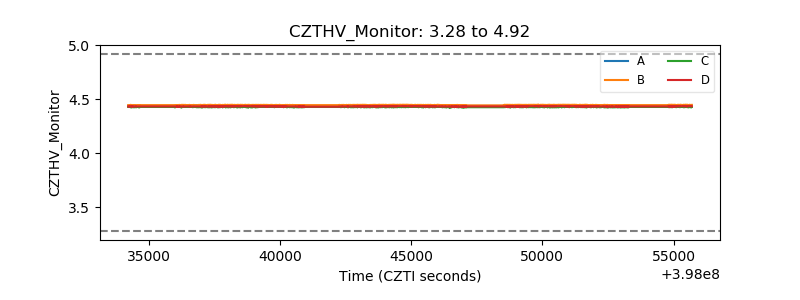 |
| D_VDD | 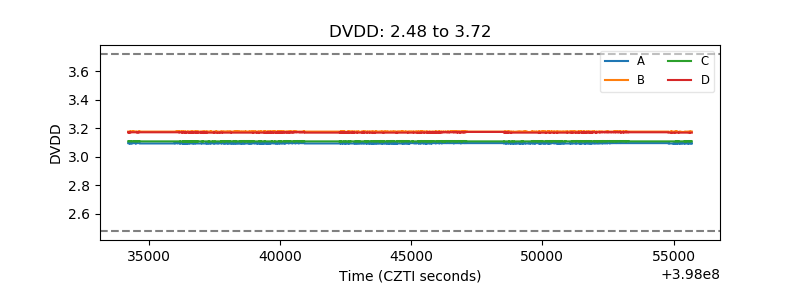 |
| Temperature 1 |  |
| Veto HV Monitor | 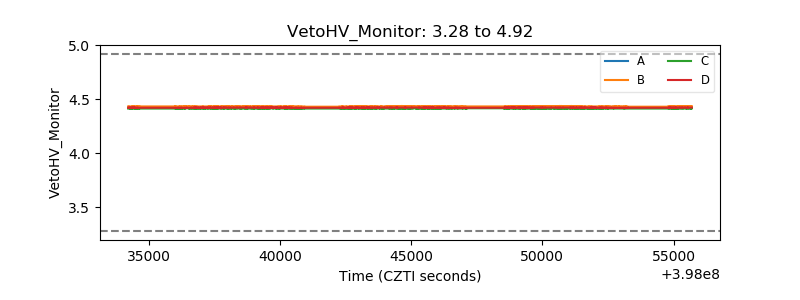 |
| Veto LLD | 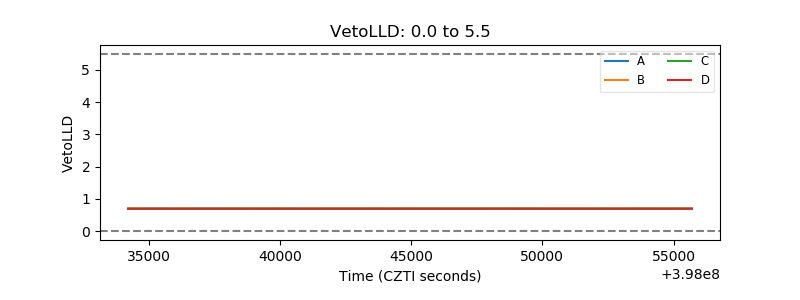 |
| Alpha Counter |  |
| _CPM_Rate | 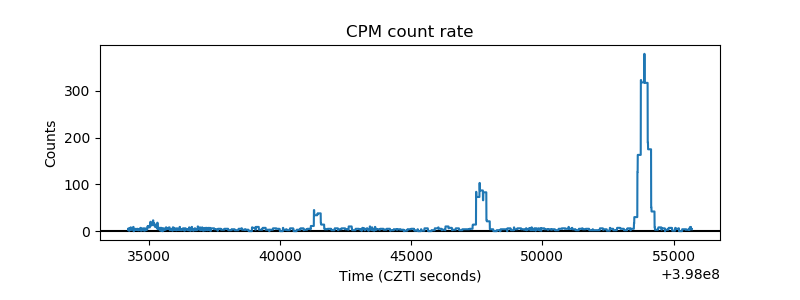 |
| CZT Counter | 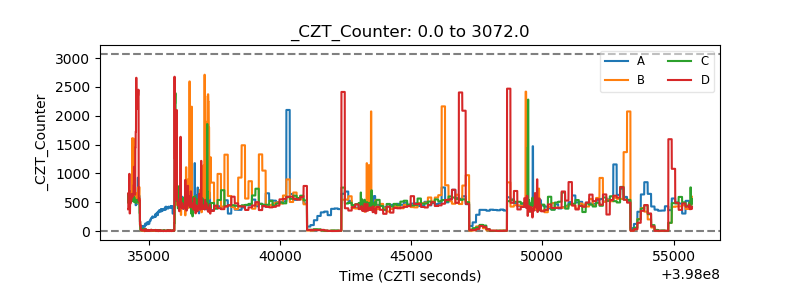 |
| +2.5 Volts monitor | 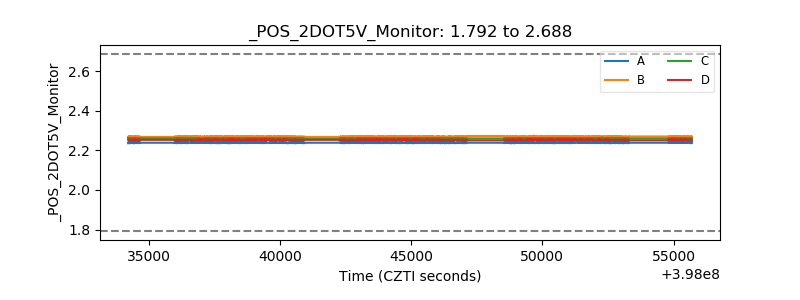 |
| +5 Volts monitor | 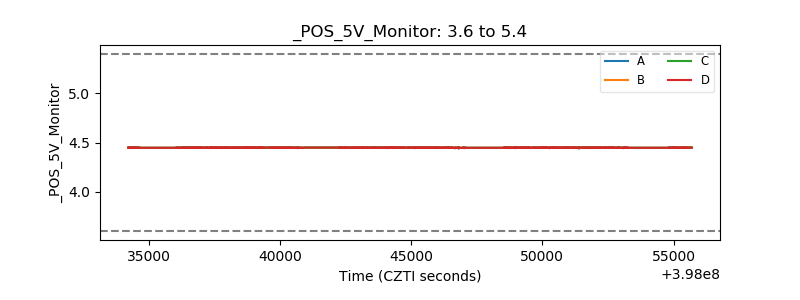 |
| _ROLL_ROT | 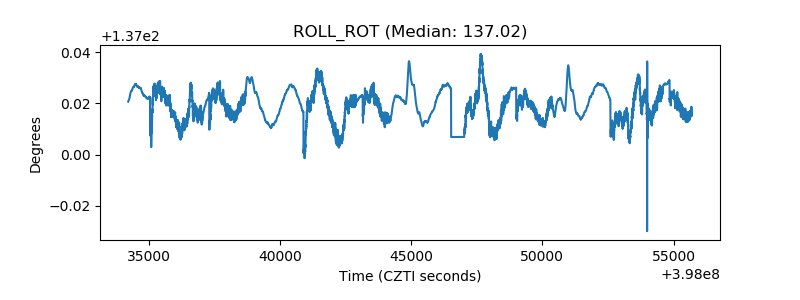 |
| _Roll_DEC | 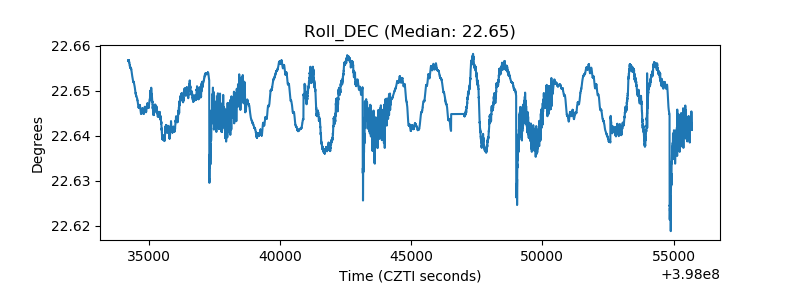 |
| _Roll_RA | 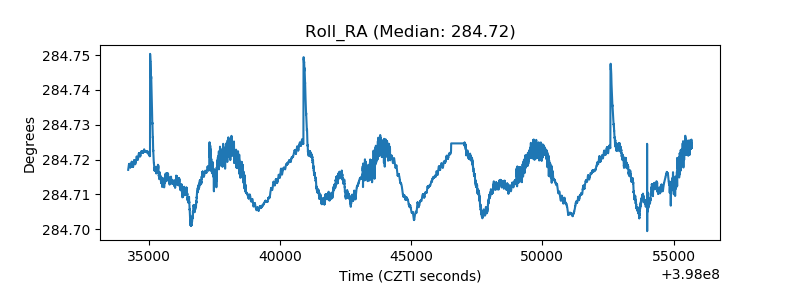 |
| Veto Counter | 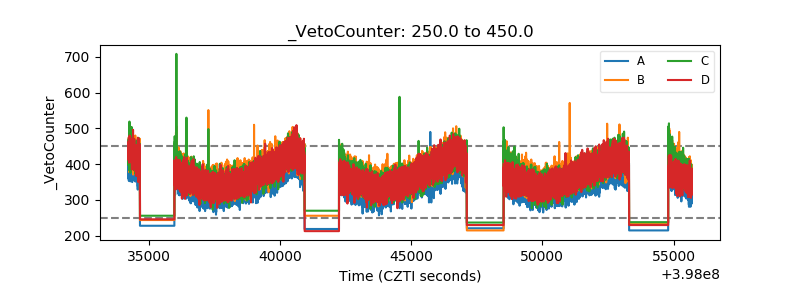 |