| Param | Original file | Final file |
|---|---|---|
| Filename | modeM0/AS1A11_079T01_9000005284_37168cztM0_level2.evt | modeM0/AS1A11_079T01_9000005284_37168cztM0_level2_quad_clean.evt |
| Size (bytes) | 529,243,200 | 63,097,920 |
| Size | 504.7 MB | 60.2 MB |
| Events in quadrant A | 3,099,262 | 379,786 |
| Events in quadrant B | 5,040,544 | 369,455 |
| Events in quadrant C | 3,410,784 | 377,833 |
| Events in quadrant D | 4,066,877 | 360,093 |
| Mode M9 | |||
|---|---|---|---|
| Quadrant | BADHDUFLAG | Total packets | Discarded packets |
| A | 0 | 31 | 0 |
| B | 0 | 31 | 0 |
| C | 0 | 31 | 0 |
| D | 0 | 31 | 0 |
| Mode SS | |||
|---|---|---|---|
| Quadrant | BADHDUFLAG | Total packets | Discarded packets |
| A | 0 | 126 | 0 |
| B | 0 | 126 | 0 |
| C | 0 | 126 | 0 |
| D | 0 | 126 | 0 |
| Mode M0 | |||
|---|---|---|---|
| Quadrant | BADHDUFLAG | Total packets | Discarded packets |
| A | 0 | 12896 | 3 |
| B | 0 | 19160 | 2 |
| C | 0 | 13657 | 2 |
| D | 0 | 16247 | 2 |
| Quadrant | Total seconds | Saturated seconds | Saturation percentage |
|---|---|---|---|
| A | 6054 | 26 | 0.429468% |
| B | 6054 | 563 | 9.299637% |
| C | 6054 | 94 | 1.552692% |
| D | 6054 | 308 | 5.087545% |
Noise dominated data is calculated using 1-second bins in cleaned event files. If a bin has >2000 counts, and if more than 50% of those come from <1% of pixels, then it is considered to be noise-dominated and hence unusable.
| Quadrant | # 1 sec bins | Bins with >0 counts | Bins with >2000 counts | High rate bins dominated by noise | Noise dominated (total time) | Noise dominated (detector-on time) | Marked lightcurve |
|---|---|---|---|---|---|---|---|
| A | 9186 | 6056 | 12 | 12 | 0.13% | 0.20% | 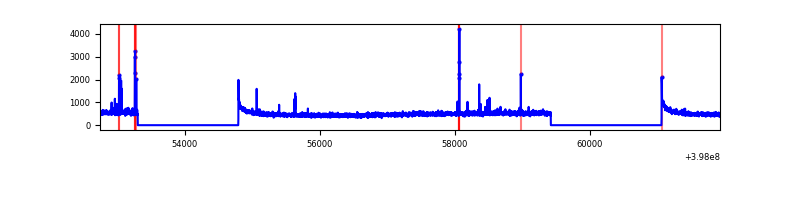 |
| B | 9186 | 6056 | 423 | 423 | 4.60% | 6.98% | 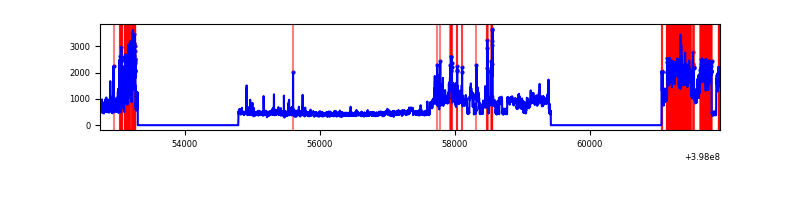 |
| C | 9186 | 6056 | 70 | 70 | 0.76% | 1.16% | 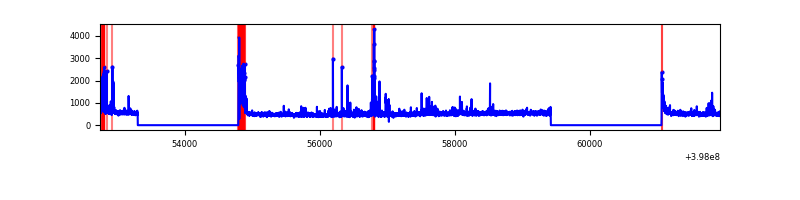 |
| D | 9186 | 6056 | 264 | 264 | 2.87% | 4.36% | 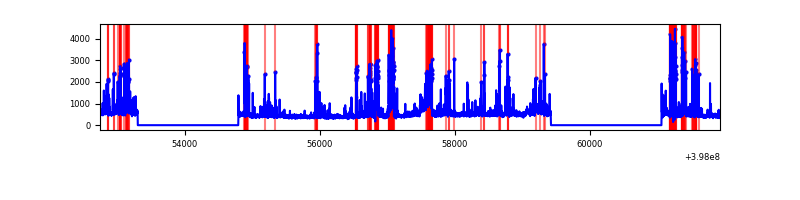 |
Top three noisy pixels from each quadrant. If the there are fewer than three noisy pixels in the level2.evt file, extra rows are filled as -1
| Pixel properties | Quadrant properties | ||||||
|---|---|---|---|---|---|---|---|
| Quadrant | DetID | PixID | Counts | Sigma | Mean | Median | Sigma |
| A | 10 | 83 | 275902 | 1938.08 | 703 | 689 | 142.0 |
| A | 9 | 143 | 47450 | 329.3 | 703 | 689 | 142.0 |
| A | 15 | 237 | 39141 | 270.78 | 703 | 689 | 142.0 |
| B | 4 | 251 | 1634719 | 12258.44 | 682 | 663 | 133.3 |
| B | 5 | 184 | 410330 | 3073.26 | 682 | 663 | 133.3 |
| B | 5 | 172 | 154890 | 1156.99 | 682 | 663 | 133.3 |
| C | 15 | 214 | 258565 | 1608.47 | 683 | 688 | 160.3 |
| C | 0 | 10 | 199511 | 1240.13 | 683 | 688 | 160.3 |
| C | 14 | 254 | 170986 | 1062.21 | 683 | 688 | 160.3 |
| D | 12 | 6 | 591985 | 3602.34 | 668 | 649 | 164.2 |
| D | 2 | 249 | 412456 | 2508.67 | 668 | 649 | 164.2 |
| D | 2 | 153 | 268448 | 1631.39 | 668 | 649 | 164.2 |
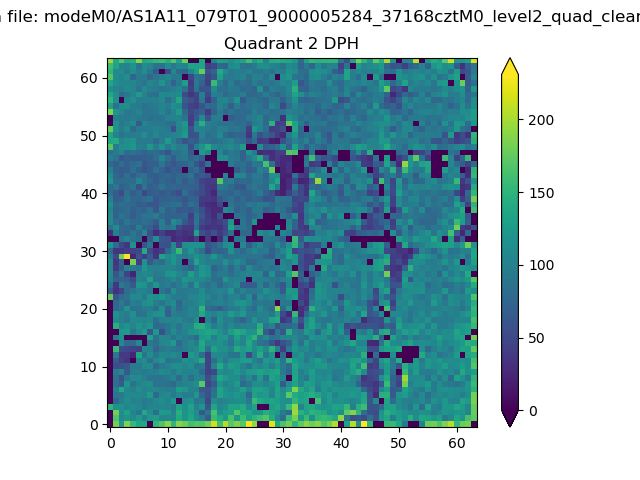
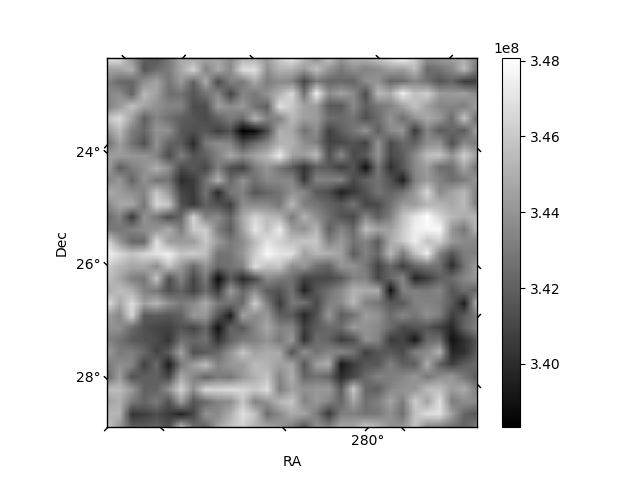
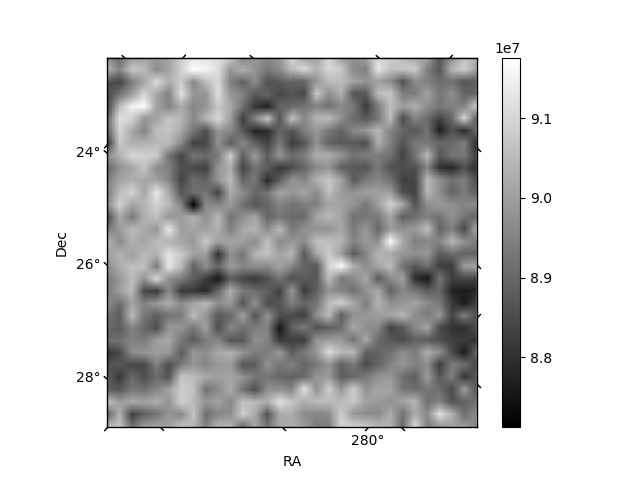
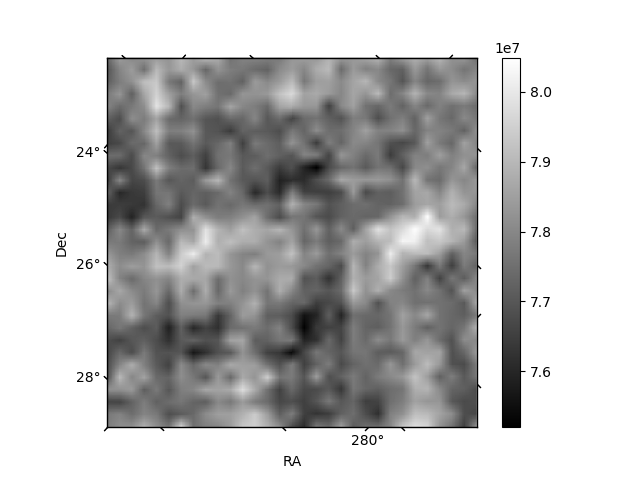
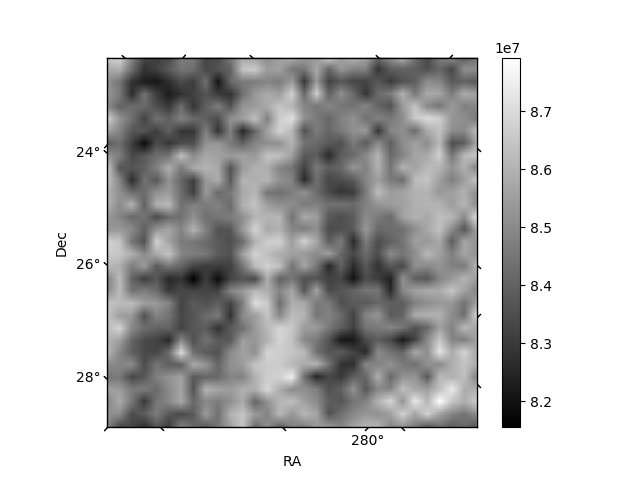
Histogram calculated using DETX and DETY for each event in the final _common_clean file
| Quadrant A | 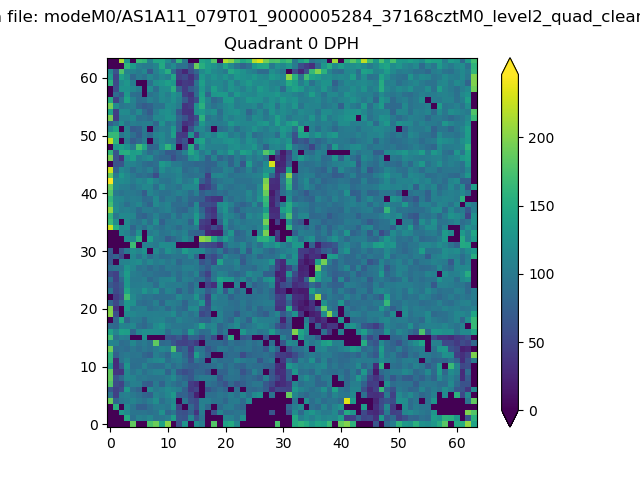 |
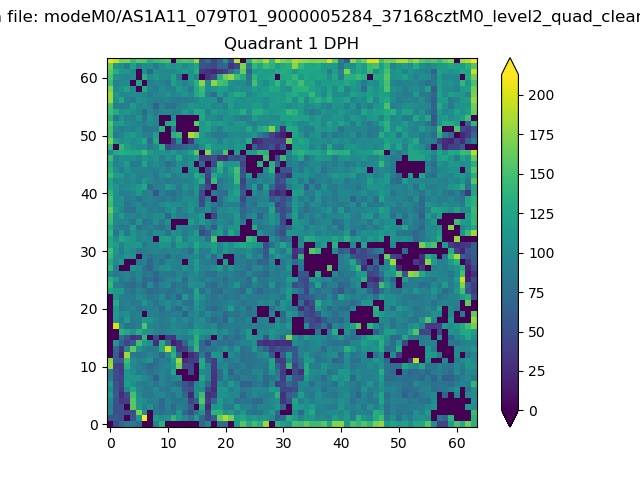 |
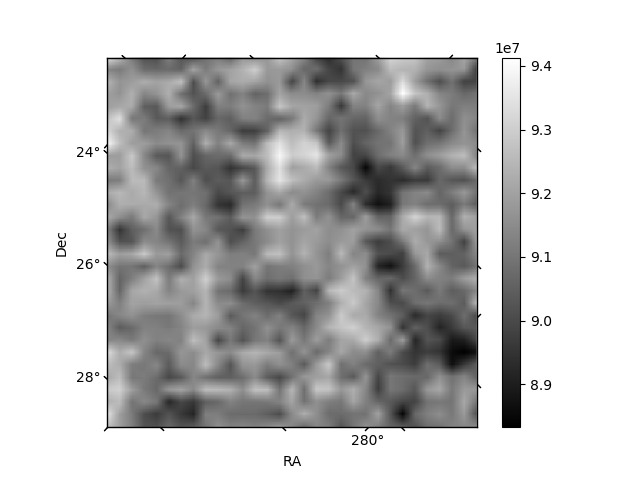
Quadrant B |
|---|---|---|---|
| Quadrant D | 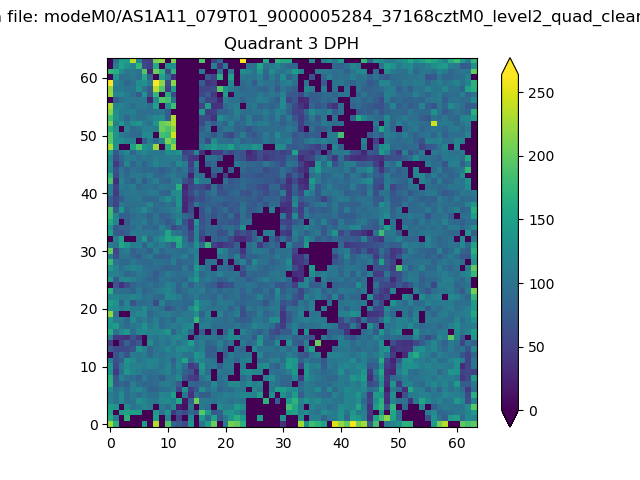 |
 |
Quadrant C |
| Plot type | Count rate plots | Images |
|---|---|---|
| Comparison with Poisson distribution Blue bars denote a histogram of data divided into 1 sec bins. Red curve is a Poisson curve with rate = median count rate of data. |
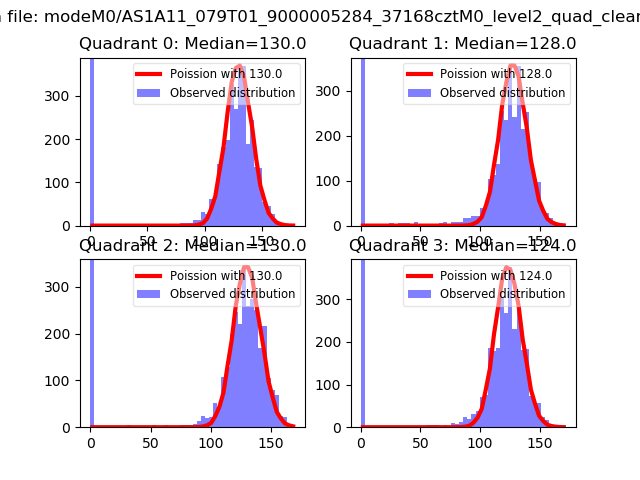 |
 |
| Quadrant-wise count rates Data is divided into 100 sec bins |
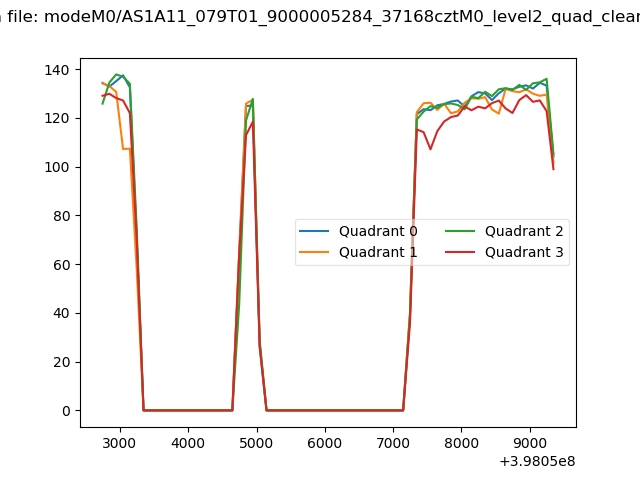 |
|
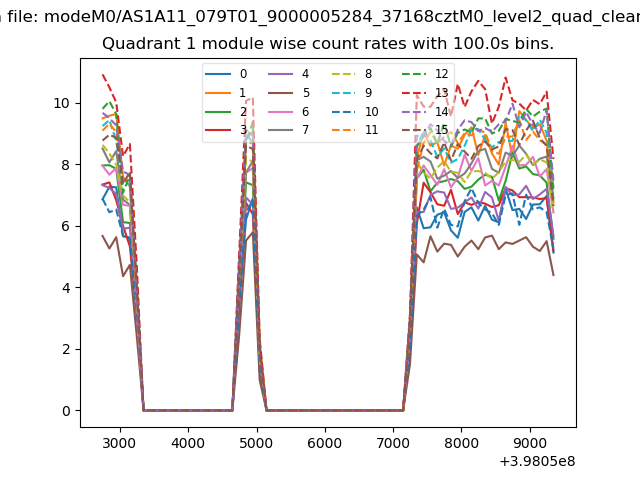
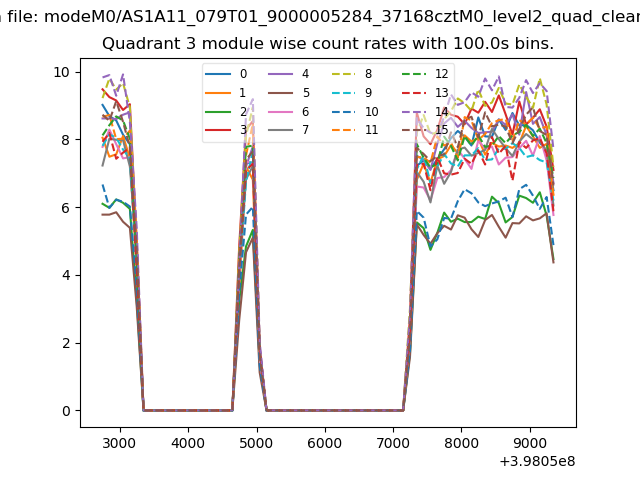
| Module-wise count rates for Quadrant A Data is divided into 100 sec bins |
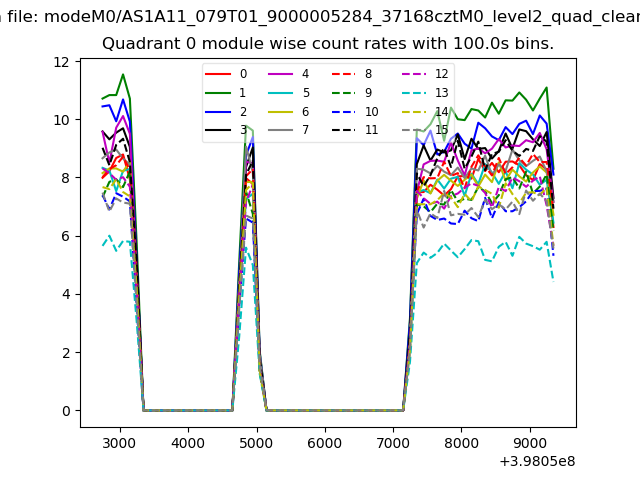 |
 |
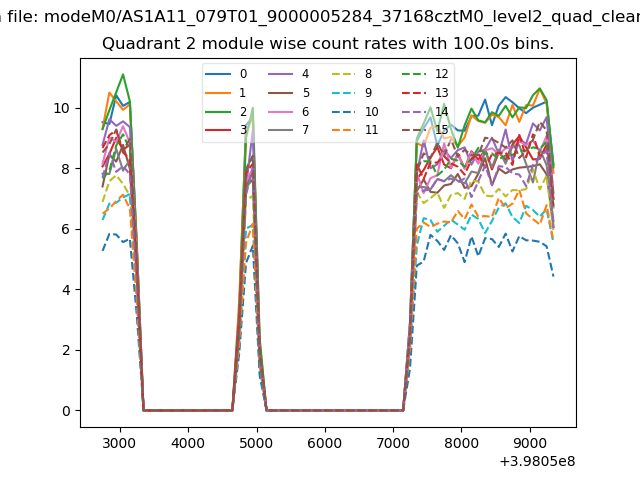
| Module-wise count rates for Quadrant B Data is divided into 100 sec bins |
 |
 |
| Module-wise count rates for Quadrant C Data is divided into 100 sec bins |
 |
 |
| Module-wise count rates for Quadrant D Data is divided into 100 sec bins |
 |
 |
| Parameter | Plot |
|---|---|
| CZT HV Monitor | 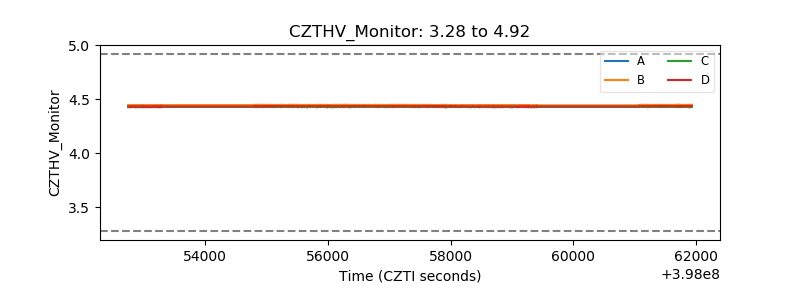 |
| D_VDD | 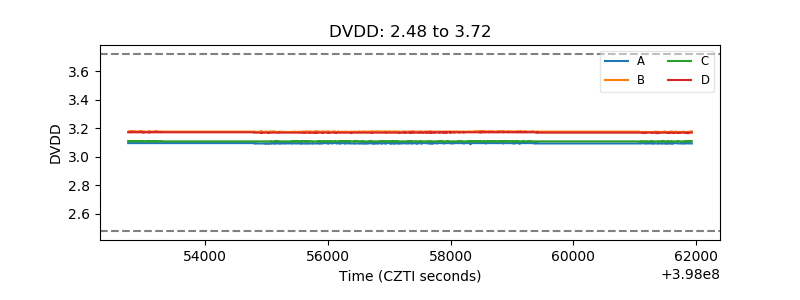 |
| Temperature 1 | 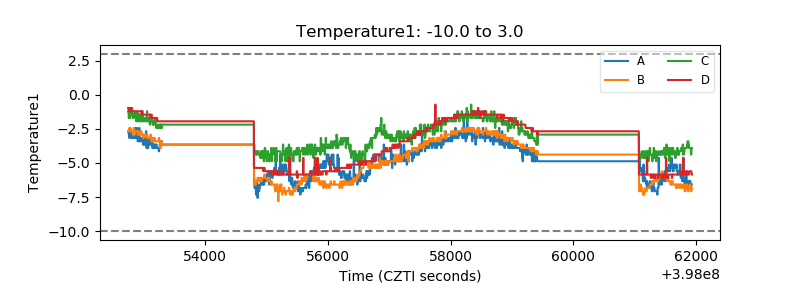 |
| Veto HV Monitor | 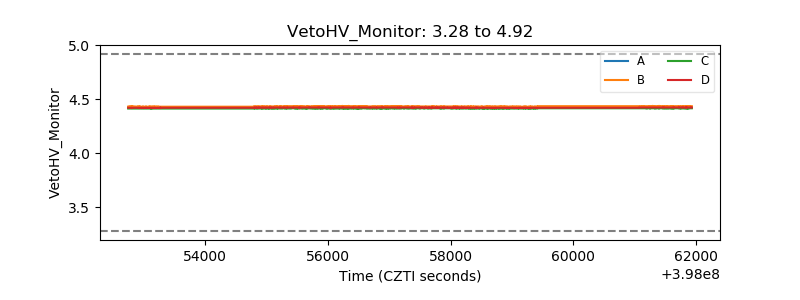 |
| Veto LLD | 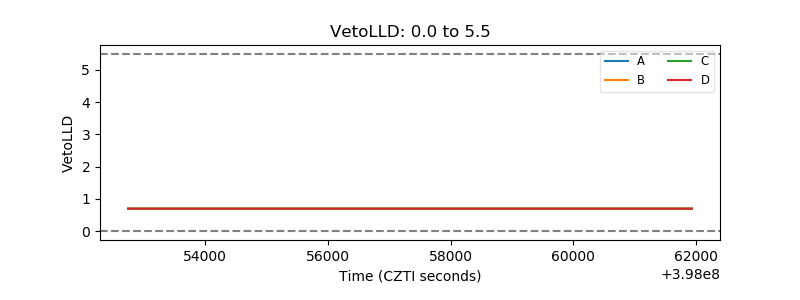 |
| Alpha Counter | 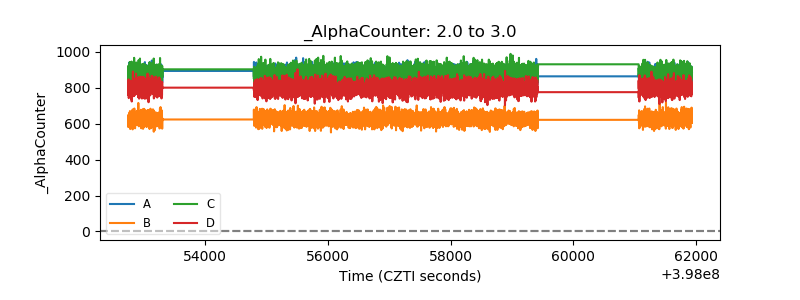 |
| _CPM_Rate | 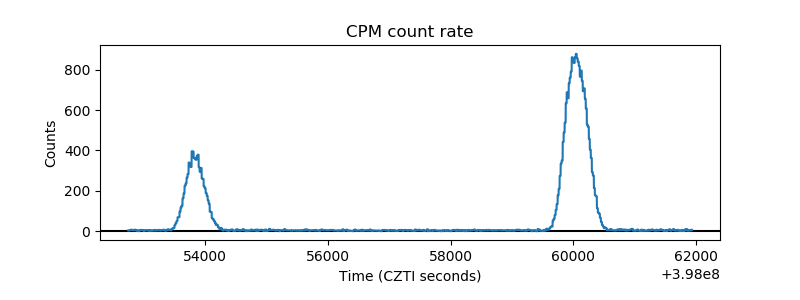 |
| CZT Counter | 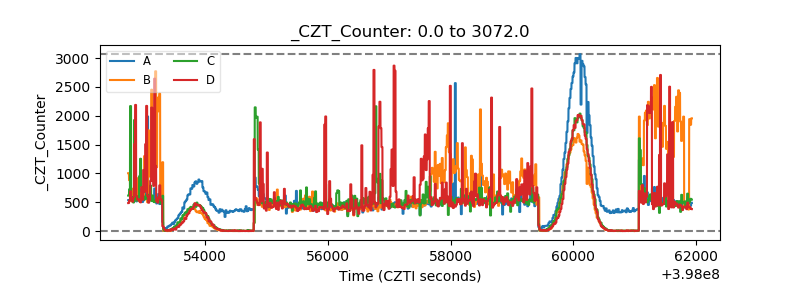 |
| +2.5 Volts monitor | 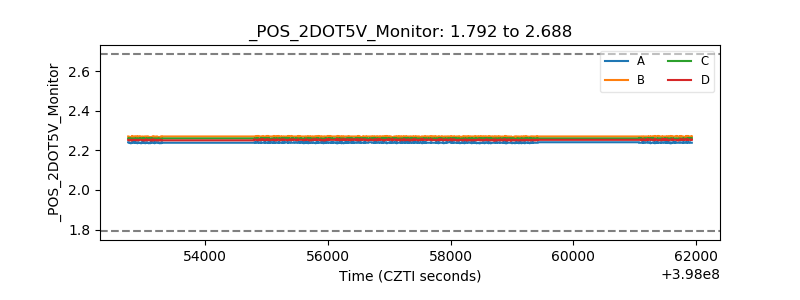 |
| +5 Volts monitor | 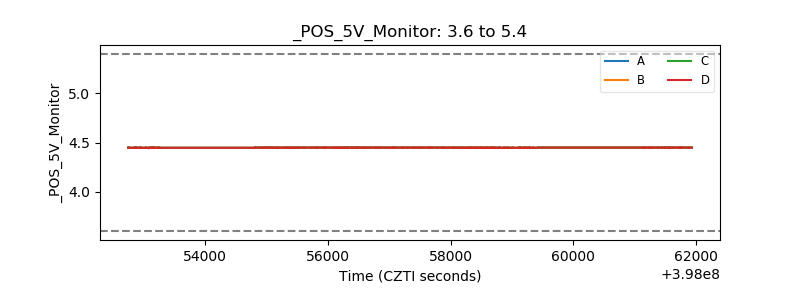 |
| _ROLL_ROT | 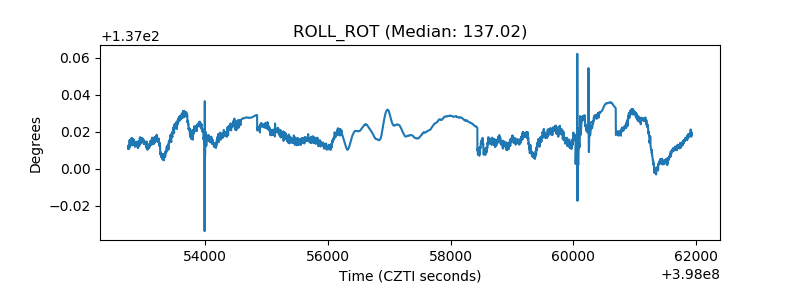 |
| _Roll_DEC | 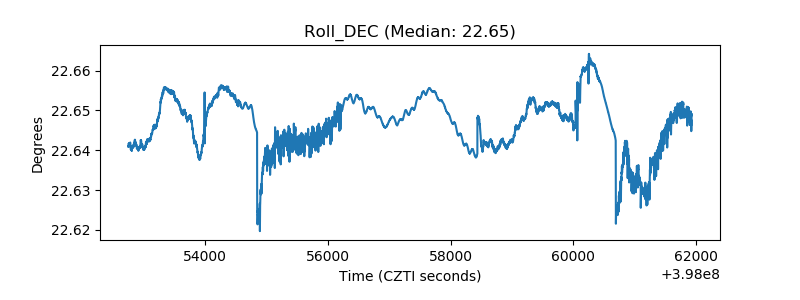 |
| _Roll_RA | 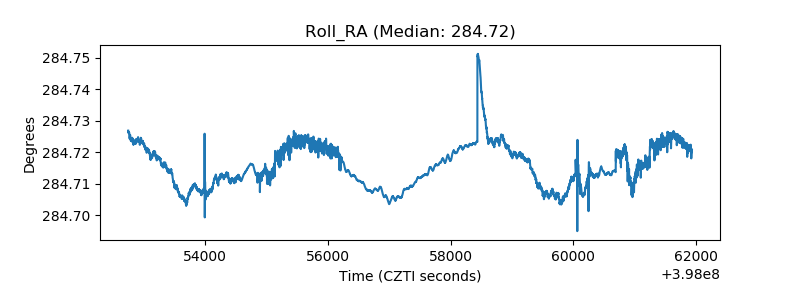 |
| Veto Counter | 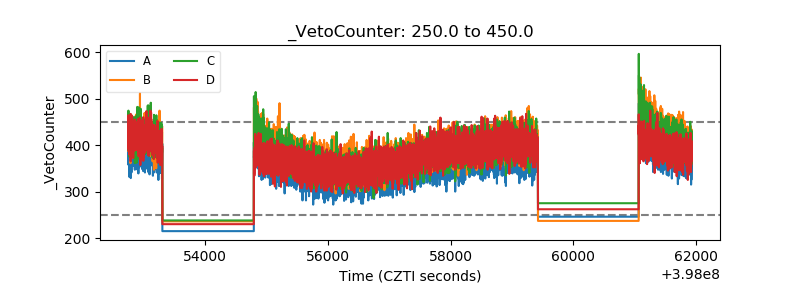 |