| Param | Original file | Final file |
|---|---|---|
| Filename | modeM0/AS1A11_079T01_9000005284_37170cztM0_level2.evt | modeM0/AS1A11_079T01_9000005284_37170cztM0_level2_quad_clean.evt |
| Size (bytes) | 549,495,360 | 51,877,440 |
| Size | 524.0 MB | 49.5 MB |
| Events in quadrant A | 2,658,990 | 314,367 |
| Events in quadrant B | 7,347,021 | 285,090 |
| Events in quadrant C | 2,766,143 | 310,861 |
| Events in quadrant D | 3,515,795 | 294,280 |
| Mode M9 | |||
|---|---|---|---|
| Quadrant | BADHDUFLAG | Total packets | Discarded packets |
| A | 0 | 32 | 0 |
| B | 0 | 32 | 0 |
| C | 0 | 32 | 0 |
| D | 0 | 33 | 0 |
| Mode SS | |||
|---|---|---|---|
| Quadrant | BADHDUFLAG | Total packets | Discarded packets |
| A | 0 | 106 | 0 |
| B | 0 | 106 | 0 |
| C | 0 | 106 | 0 |
| D | 0 | 106 | 0 |
| Mode M0 | |||
|---|---|---|---|
| Quadrant | BADHDUFLAG | Total packets | Discarded packets |
| A | 0 | 11008 | 3 |
| B | 0 | 25320 | 2 |
| C | 0 | 11131 | 2 |
| D | 0 | 13843 | 2 |
| Quadrant | Total seconds | Saturated seconds | Saturation percentage |
|---|---|---|---|
| A | 5220 | 11 | 0.210728% |
| B | 5220 | 1490 | 28.544061% |
| C | 5220 | 14 | 0.268199% |
| D | 5220 | 260 | 4.980843% |
Noise dominated data is calculated using 1-second bins in cleaned event files. If a bin has >2000 counts, and if more than 50% of those come from <1% of pixels, then it is considered to be noise-dominated and hence unusable.
| Quadrant | # 1 sec bins | Bins with >0 counts | Bins with >2000 counts | High rate bins dominated by noise | Noise dominated (total time) | Noise dominated (detector-on time) | Marked lightcurve |
|---|---|---|---|---|---|---|---|
| A | 6982 | 5221 | 4 | 4 | 0.06% | 0.08% | 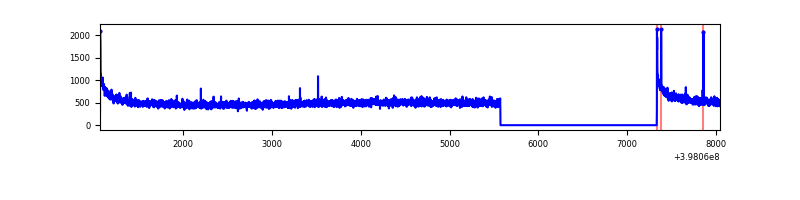 |
| B | 6982 | 5221 | 1197 | 1197 | 17.14% | 22.93% | 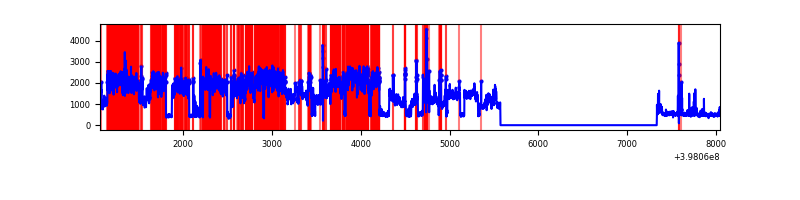 |
| C | 6982 | 5221 | 11 | 11 | 0.16% | 0.21% | 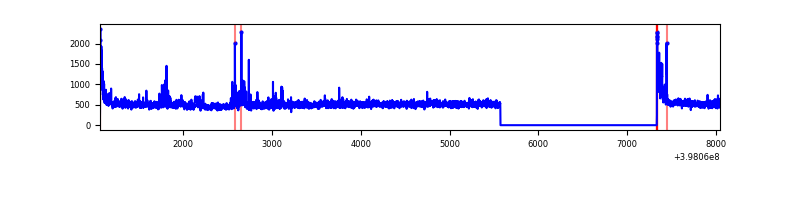 |
| D | 6982 | 5221 | 231 | 231 | 3.31% | 4.42% |  |
Top three noisy pixels from each quadrant. If the there are fewer than three noisy pixels in the level2.evt file, extra rows are filled as -1
| Pixel properties | Quadrant properties | ||||||
|---|---|---|---|---|---|---|---|
| Quadrant | DetID | PixID | Counts | Sigma | Mean | Median | Sigma |
| A | 10 | 83 | 251745 | 2005.4 | 618 | 606 | 125.2 |
| A | 13 | 6 | 8670 | 64.39 | 618 | 606 | 125.2 |
| A | 13 | 254 | 7902 | 58.26 | 618 | 606 | 125.2 |
| B | 4 | 251 | 4692599 | 42651.16 | 574 | 560 | 110.0 |
| B | 5 | 172 | 171005 | 1549.36 | 574 | 560 | 110.0 |
| B | 5 | 184 | 85680 | 773.75 | 574 | 560 | 110.0 |
| C | 15 | 214 | 225495 | 1610.5 | 597 | 603 | 139.6 |
| C | 0 | 10 | 92259 | 656.37 | 597 | 603 | 139.6 |
| C | 10 | 49 | 49383 | 349.33 | 597 | 603 | 139.6 |
| D | 12 | 6 | 611595 | 4307.13 | 580 | 564 | 141.9 |
| D | 2 | 249 | 226227 | 1590.69 | 580 | 564 | 141.9 |
| D | 2 | 153 | 210152 | 1477.38 | 580 | 564 | 141.9 |
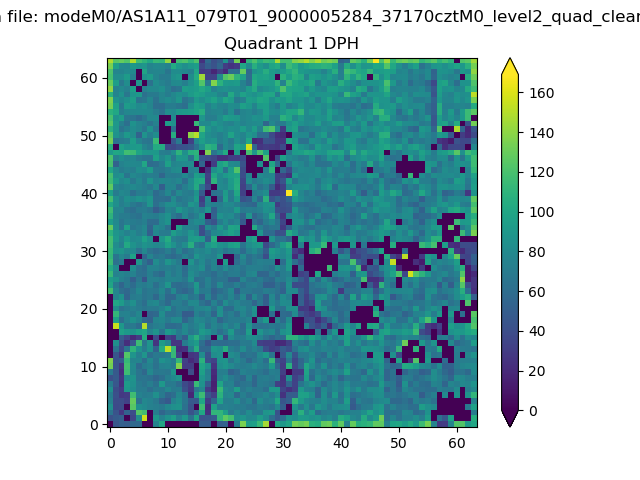
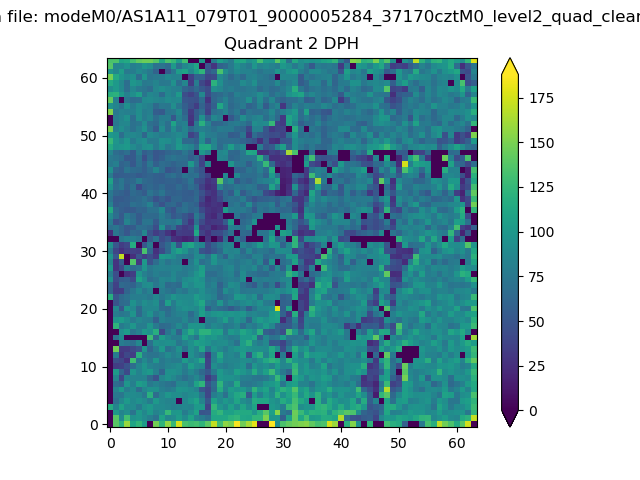
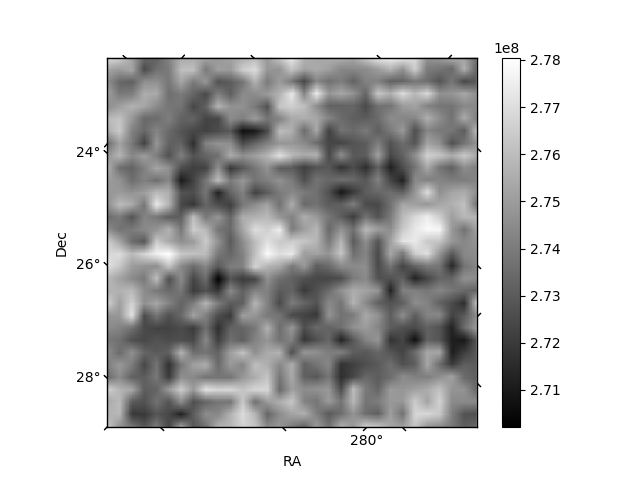
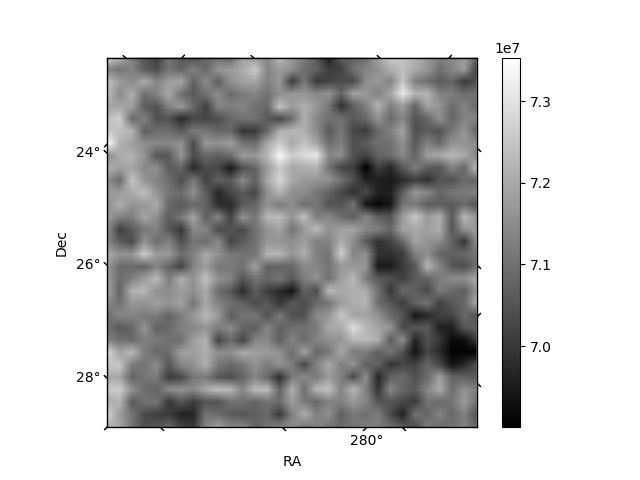
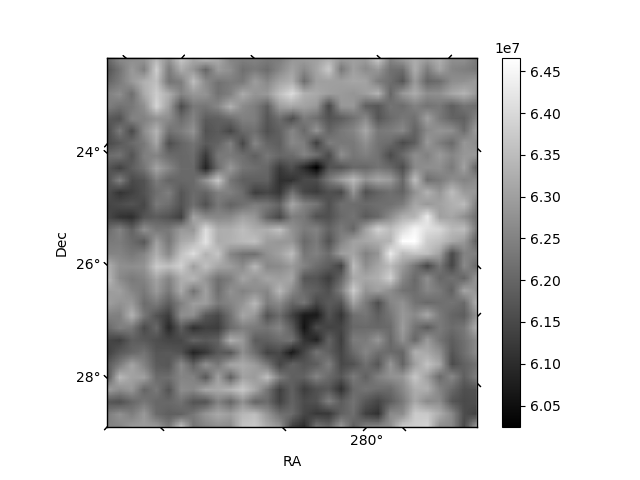
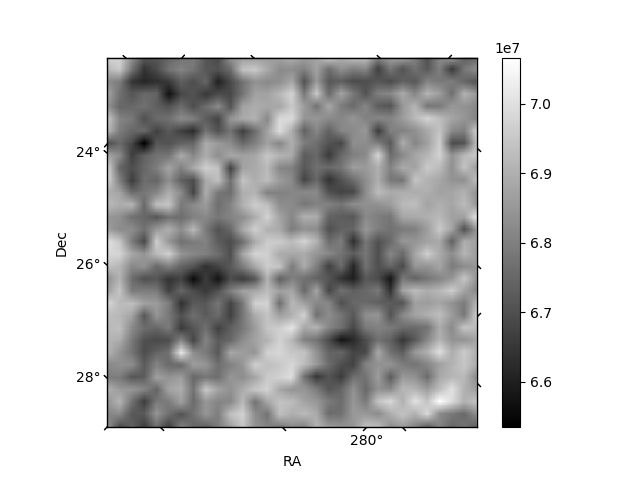
Histogram calculated using DETX and DETY for each event in the final _common_clean file
| Quadrant A | 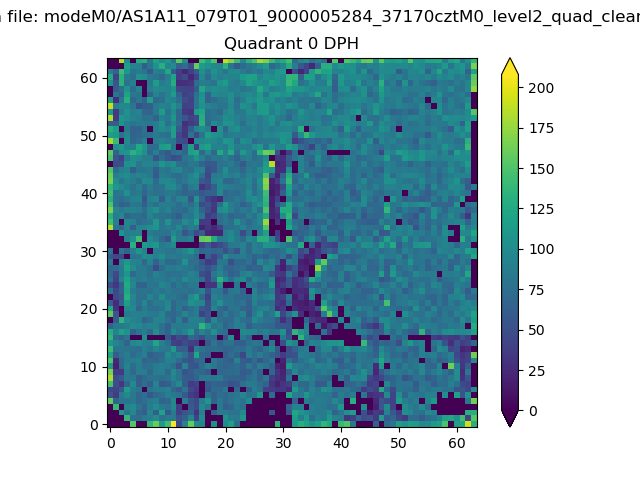 |
 |
Quadrant B |
|---|---|---|---|
| Quadrant D | 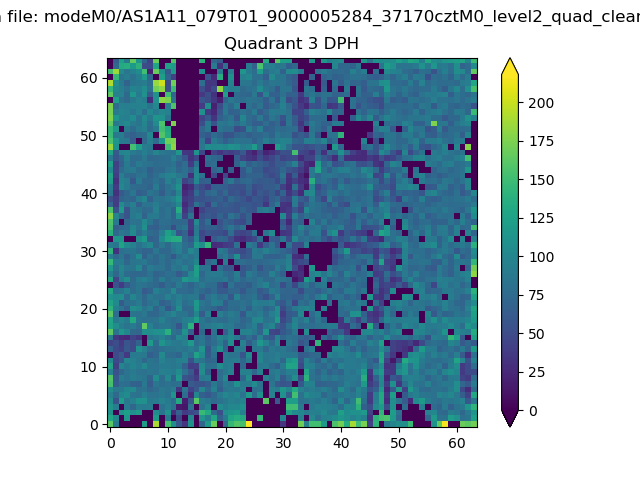 |
 |
Quadrant C |
| Plot type | Count rate plots | Images |
|---|---|---|
| Comparison with Poisson distribution Blue bars denote a histogram of data divided into 1 sec bins. Red curve is a Poisson curve with rate = median count rate of data. |
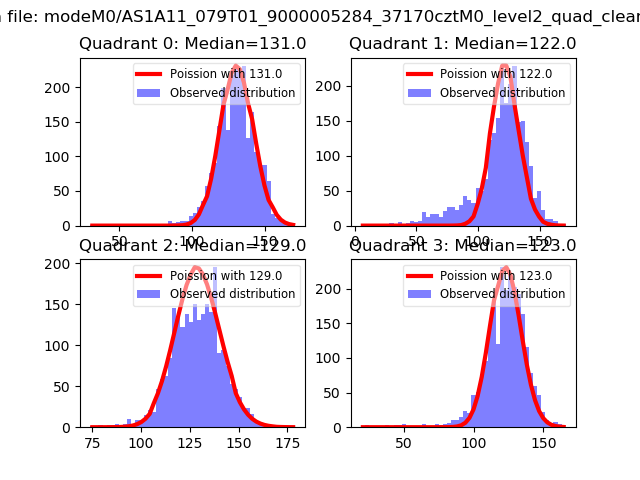 |
 |
| Quadrant-wise count rates Data is divided into 100 sec bins |
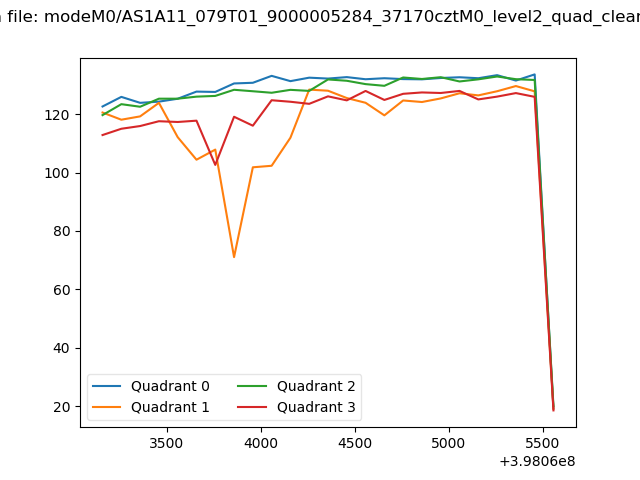 |
|
| Module-wise count rates for Quadrant A Data is divided into 100 sec bins |
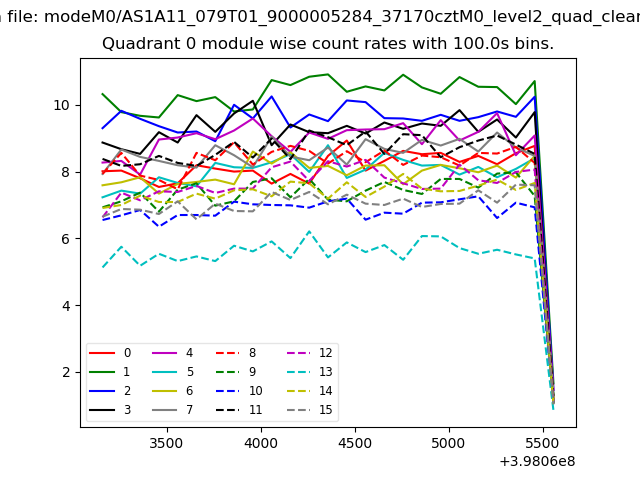 |
 |
| Module-wise count rates for Quadrant B Data is divided into 100 sec bins |
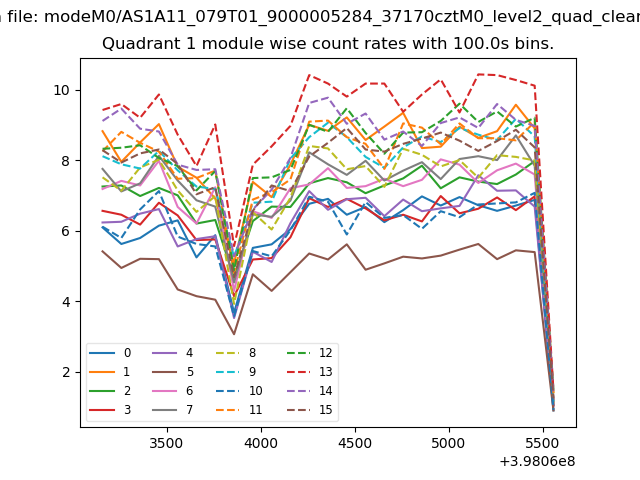 |
 |
| Module-wise count rates for Quadrant C Data is divided into 100 sec bins |
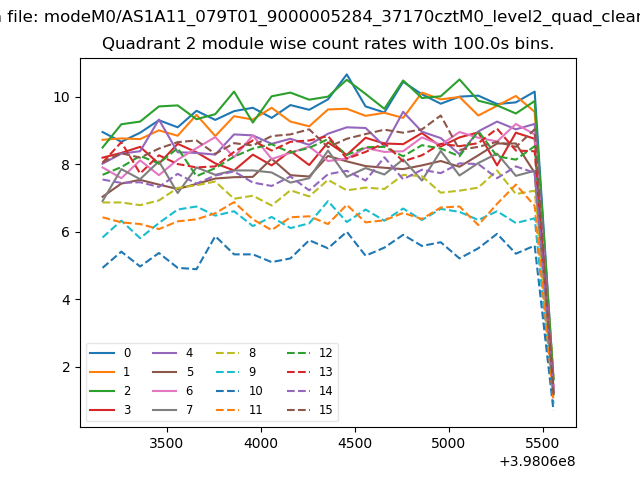 |
 |
| Module-wise count rates for Quadrant D Data is divided into 100 sec bins |
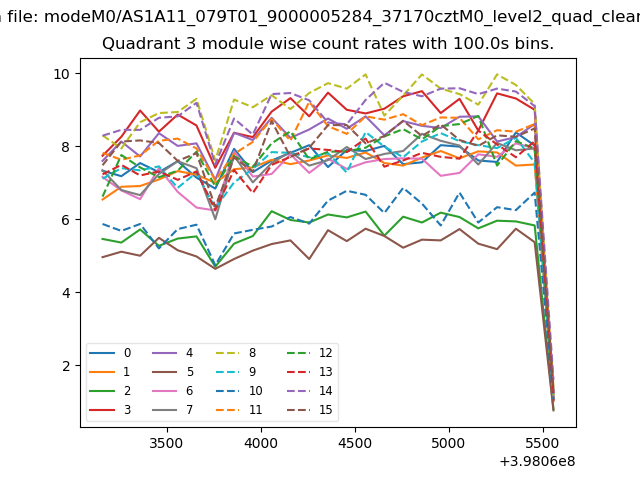 |
 |
| Parameter | Plot |
|---|---|
| CZT HV Monitor | 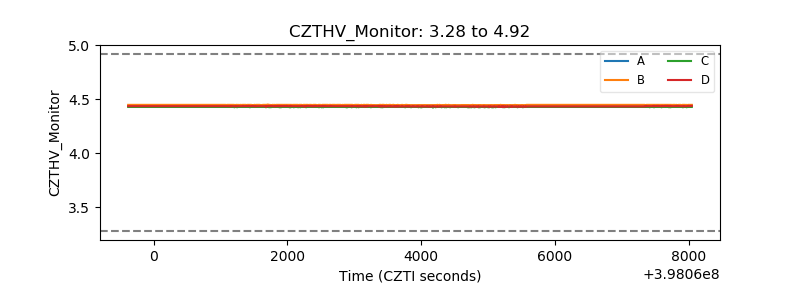 |
| D_VDD | 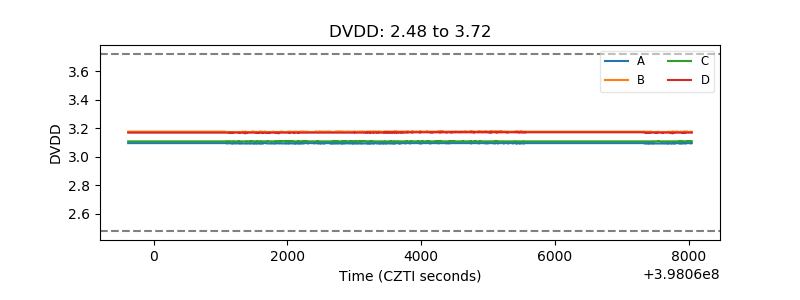 |
| Temperature 1 | 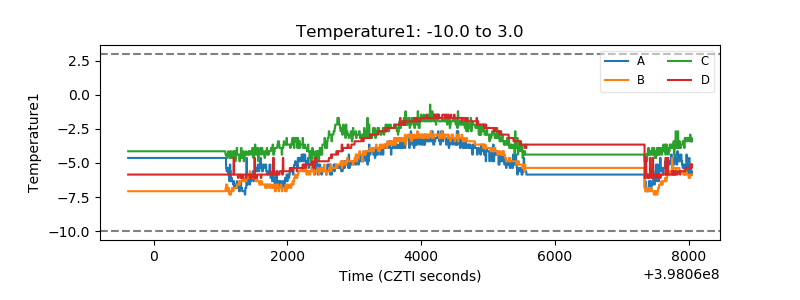 |
| Veto HV Monitor | 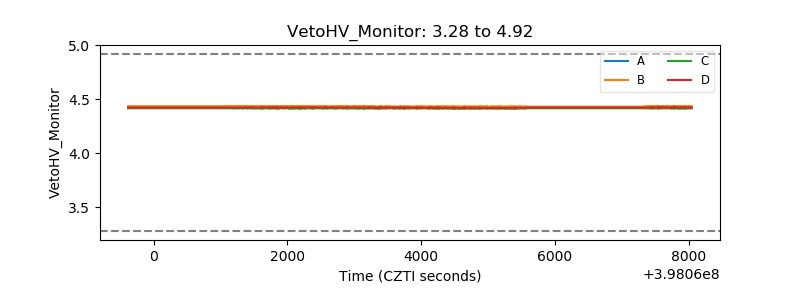 |
| Veto LLD | 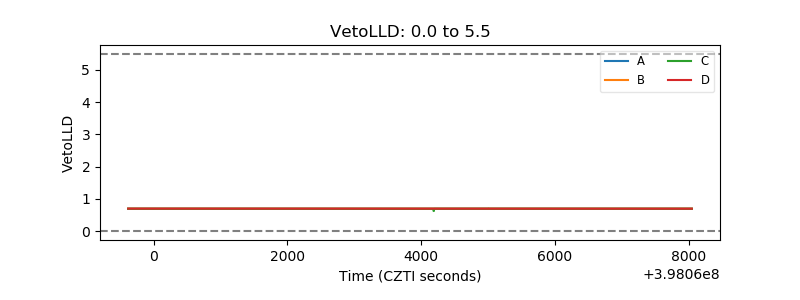 |
| Alpha Counter | 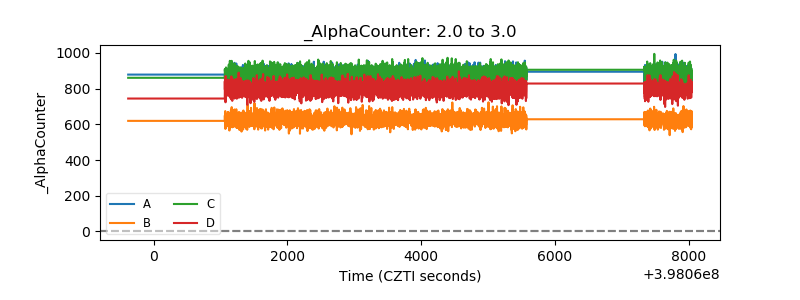 |
| _CPM_Rate | 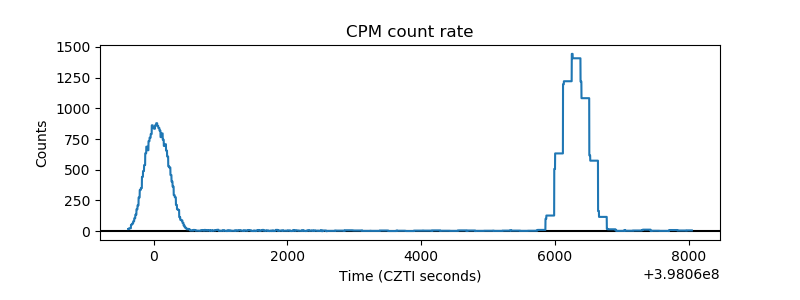 |
| CZT Counter | 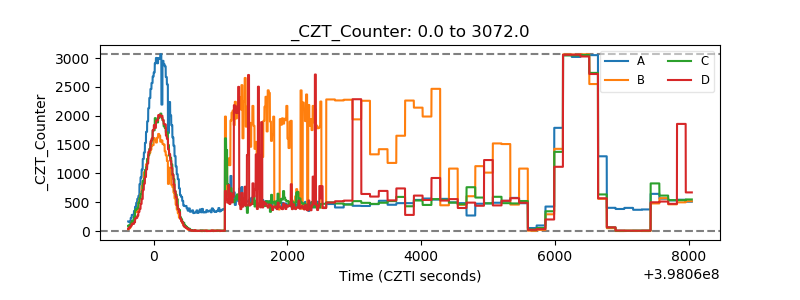 |
| +2.5 Volts monitor | 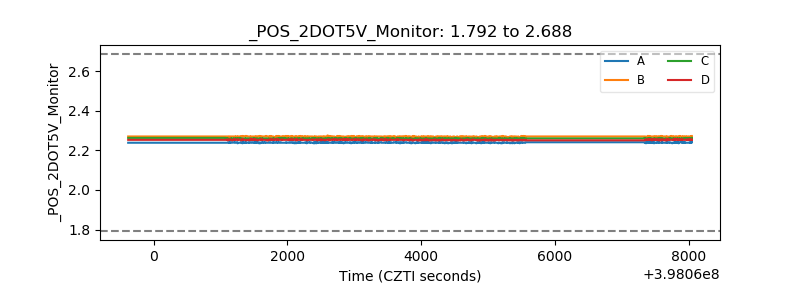 |
| +5 Volts monitor | 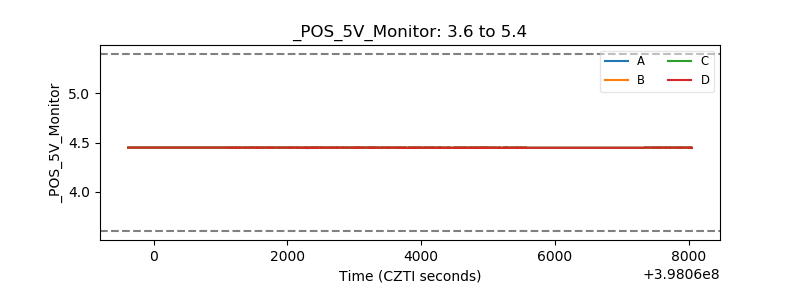 |
| _ROLL_ROT | 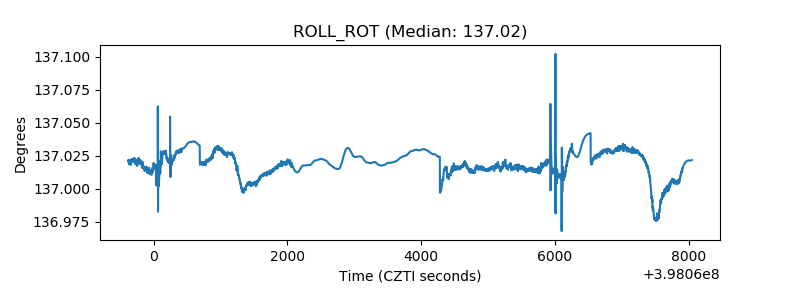 |
| _Roll_DEC | 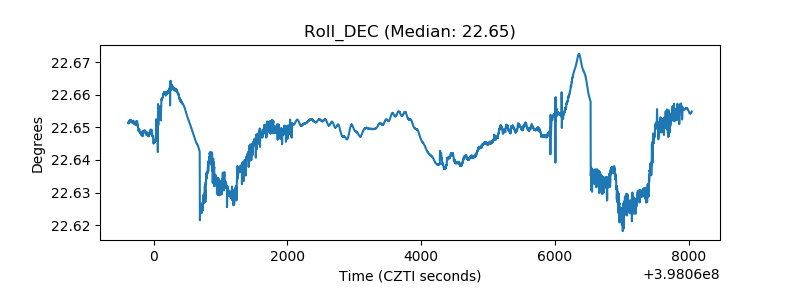 |
| _Roll_RA | 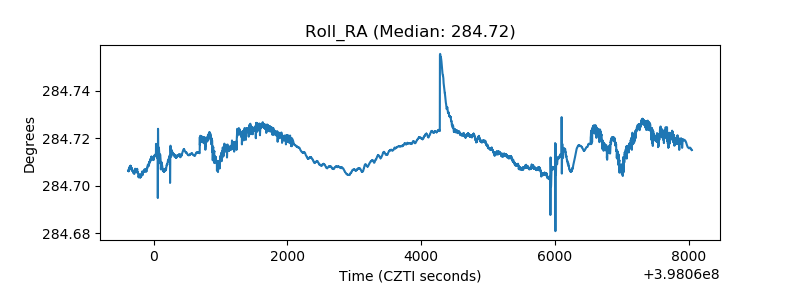 |
| Veto Counter |  |