| Param | Original file | Final file |
|---|---|---|
| Filename | modeM0/AS1A11_079T01_9000005284_37171cztM0_level2.evt | modeM0/AS1A11_079T01_9000005284_37171cztM0_level2_quad_clean.evt |
| Size (bytes) | 425,894,400 | 58,291,200 |
| Size | 406.2 MB | 55.6 MB |
| Events in quadrant A | 2,737,904 | 361,568 |
| Events in quadrant B | 2,727,151 | 364,945 |
| Events in quadrant C | 2,953,550 | 355,276 |
| Events in quadrant D | 4,131,697 | 324,000 |
| Mode M9 | |||
|---|---|---|---|
| Quadrant | BADHDUFLAG | Total packets | Discarded packets |
| A | 0 | 34 | 0 |
| B | 0 | 34 | 0 |
| C | 0 | 34 | 0 |
| D | 0 | 35 | 0 |
| Mode SS | |||
|---|---|---|---|
| Quadrant | BADHDUFLAG | Total packets | Discarded packets |
| A | 0 | 104 | 0 |
| B | 0 | 104 | 0 |
| C | 0 | 104 | 0 |
| D | 0 | 104 | 0 |
| Mode M0 | |||
|---|---|---|---|
| Quadrant | BADHDUFLAG | Total packets | Discarded packets |
| A | 0 | 11105 | 3 |
| B | 0 | 11189 | 2 |
| C | 0 | 11597 | 2 |
| D | 0 | 15551 | 2 |
| Quadrant | Total seconds | Saturated seconds | Saturation percentage |
|---|---|---|---|
| A | 5124 | 17 | 0.331772% |
| B | 5124 | 46 | 0.897736% |
| C | 5124 | 46 | 0.897736% |
| D | 5124 | 417 | 8.138173% |
Noise dominated data is calculated using 1-second bins in cleaned event files. If a bin has >2000 counts, and if more than 50% of those come from <1% of pixels, then it is considered to be noise-dominated and hence unusable.
| Quadrant | # 1 sec bins | Bins with >0 counts | Bins with >2000 counts | High rate bins dominated by noise | Noise dominated (total time) | Noise dominated (detector-on time) | Marked lightcurve |
|---|---|---|---|---|---|---|---|
| A | 7007 | 5125 | 5 | 5 | 0.07% | 0.10% |  |
| B | 7007 | 5125 | 24 | 24 | 0.34% | 0.47% | 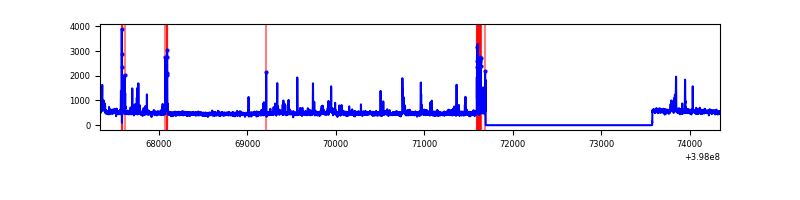 |
| C | 7007 | 5125 | 42 | 42 | 0.60% | 0.82% | 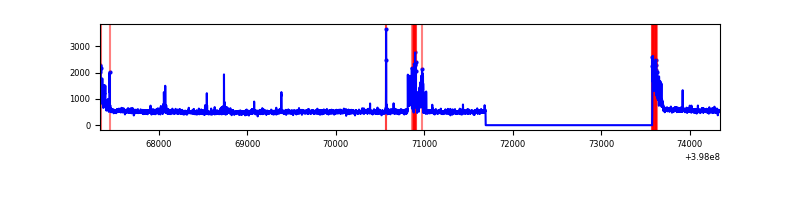 |
| D | 7007 | 5125 | 385 | 385 | 5.49% | 7.51% | 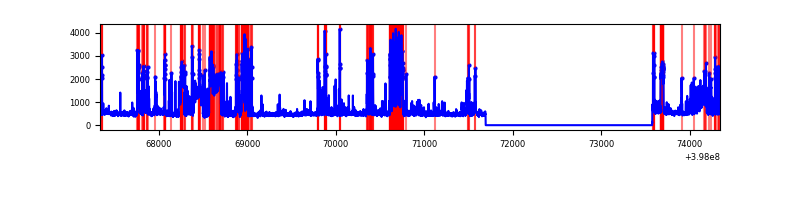 |
Top three noisy pixels from each quadrant. If the there are fewer than three noisy pixels in the level2.evt file, extra rows are filled as -1
| Pixel properties | Quadrant properties | ||||||
|---|---|---|---|---|---|---|---|
| Quadrant | DetID | PixID | Counts | Sigma | Mean | Median | Sigma |
| A | 10 | 83 | 250230 | 1961.61 | 637 | 627 | 127.2 |
| A | 9 | 143 | 14362 | 107.94 | 637 | 627 | 127.2 |
| A | 13 | 6 | 9104 | 66.62 | 637 | 627 | 127.2 |
| B | 5 | 172 | 196552 | 1639.19 | 626 | 613 | 119.5 |
| B | 4 | 232 | 31463 | 258.09 | 626 | 613 | 119.5 |
| B | 0 | 213 | 17213 | 138.87 | 626 | 613 | 119.5 |
| C | 15 | 214 | 222572 | 1557.03 | 608 | 616 | 142.6 |
| C | 0 | 10 | 169017 | 1181.34 | 608 | 616 | 142.6 |
| C | 0 | 207 | 153253 | 1070.75 | 608 | 616 | 142.6 |
| D | 2 | 249 | 646710 | 4549.01 | 588 | 571 | 142.0 |
| D | 2 | 250 | 646513 | 4547.63 | 588 | 571 | 142.0 |
| D | 12 | 6 | 254581 | 1788.31 | 588 | 571 | 142.0 |
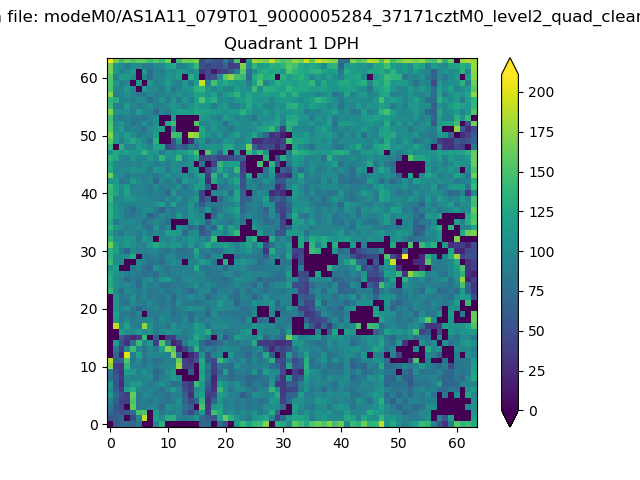
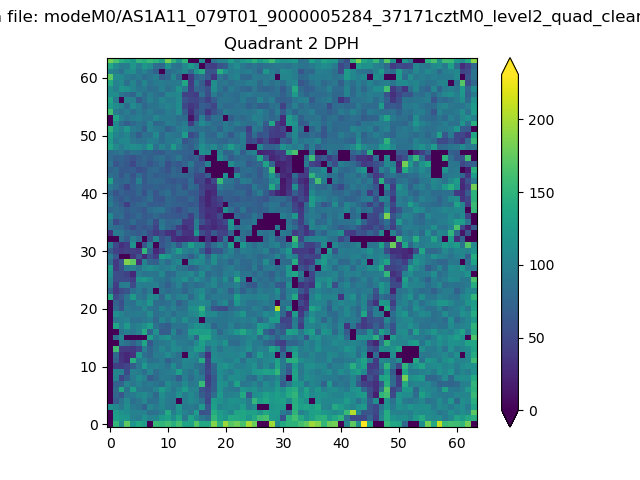
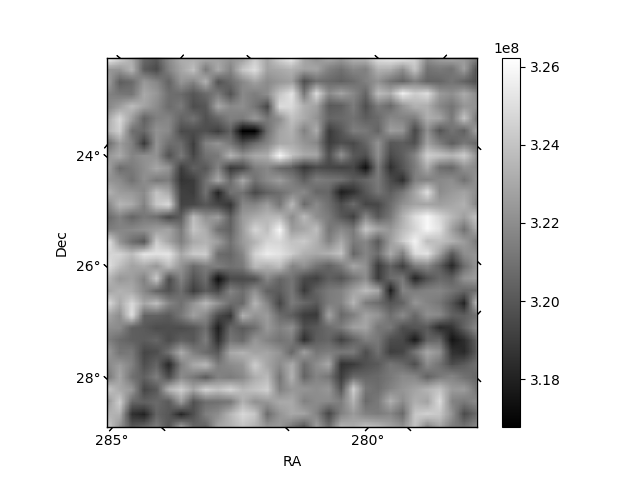
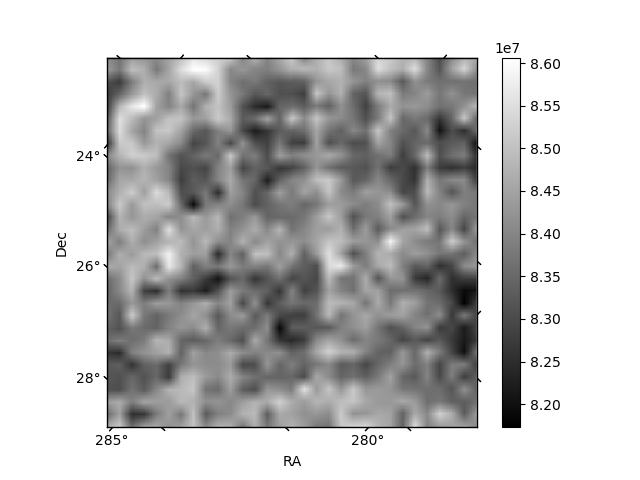
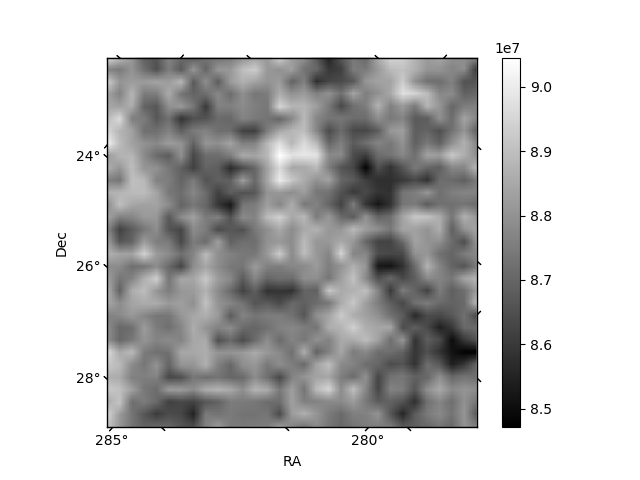
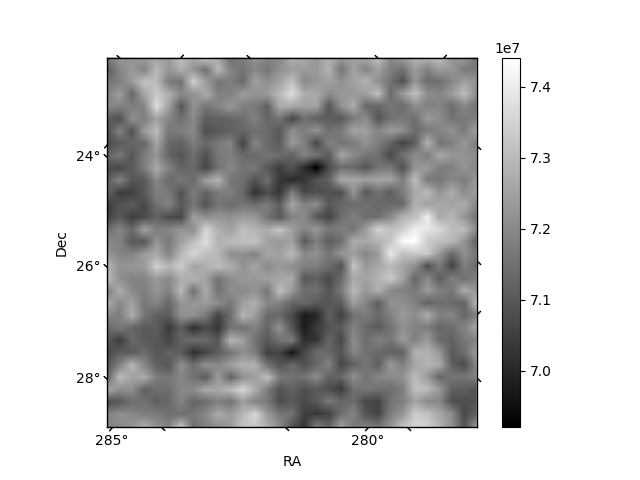
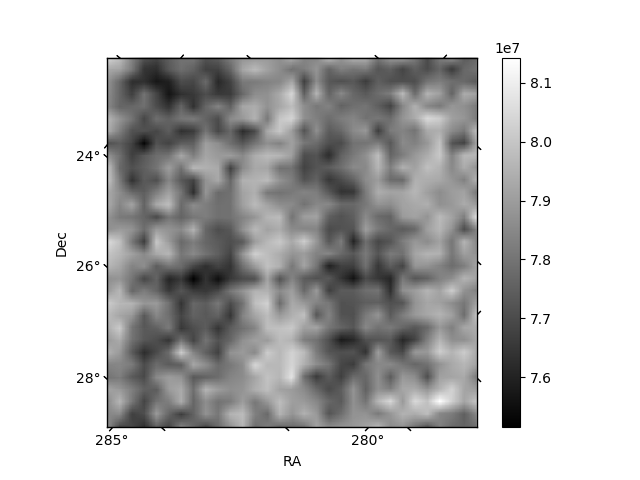
Histogram calculated using DETX and DETY for each event in the final _common_clean file
| Quadrant A | 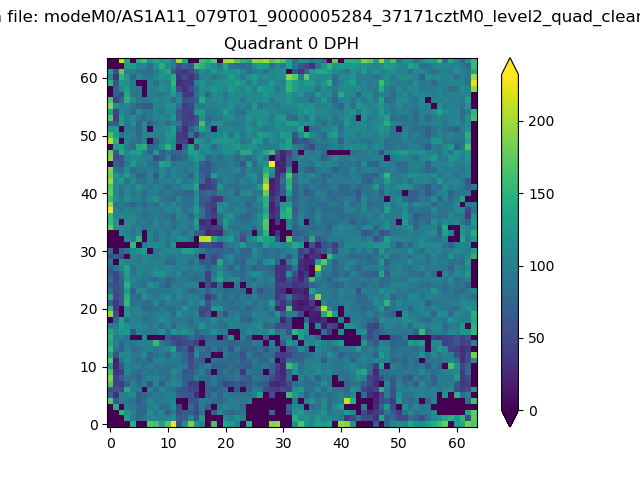 |
 |
Quadrant B |
|---|---|---|---|
| Quadrant D | 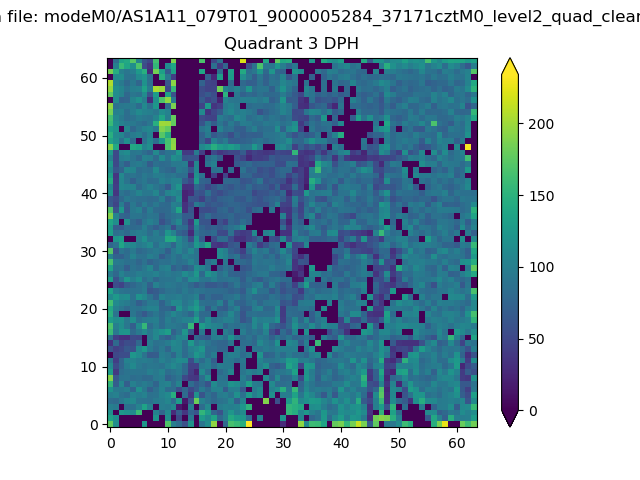 |
 |
Quadrant C |
| Plot type | Count rate plots | Images |
|---|---|---|
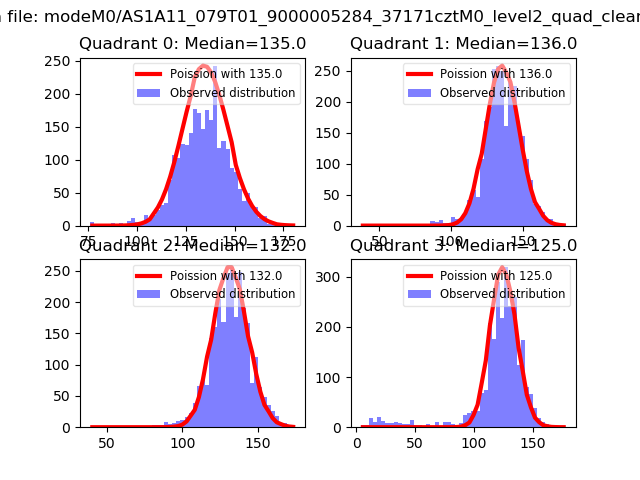
| Comparison with Poisson distribution Blue bars denote a histogram of data divided into 1 sec bins. Red curve is a Poisson curve with rate = median count rate of data. |
 |
 |
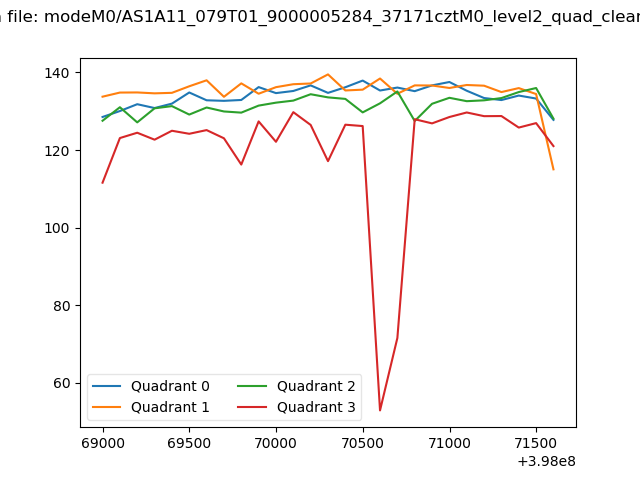
| Quadrant-wise count rates Data is divided into 100 sec bins |
 |
|
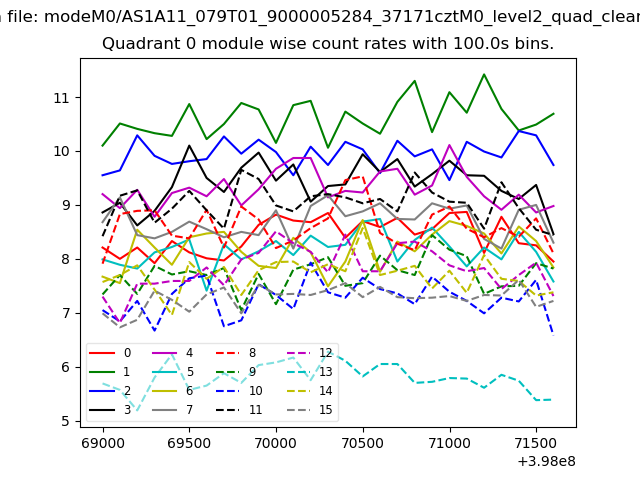
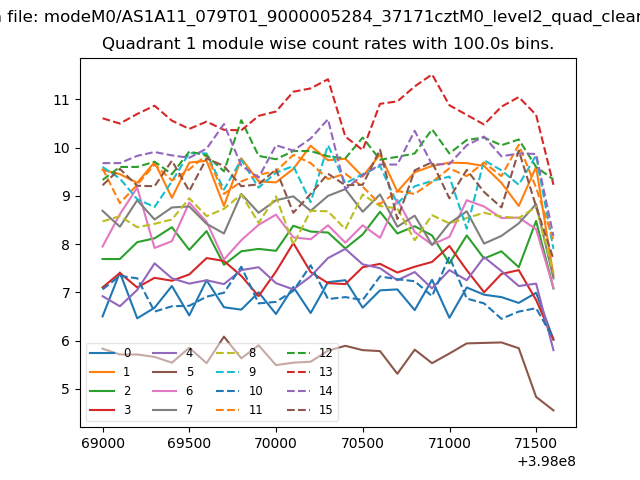
| Module-wise count rates for Quadrant A Data is divided into 100 sec bins |
 |
 |
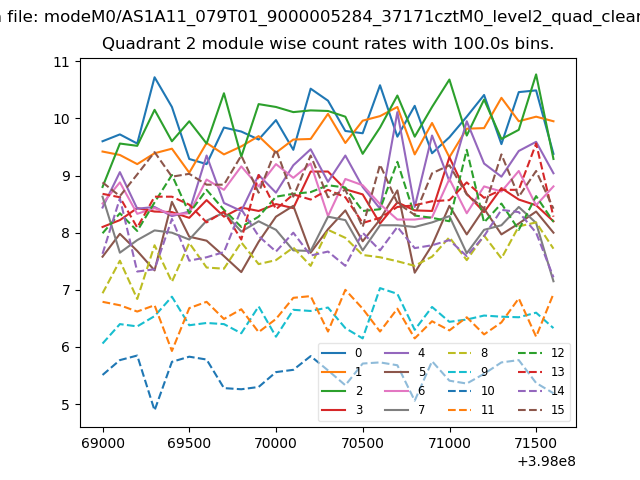
| Module-wise count rates for Quadrant B Data is divided into 100 sec bins |
 |
 |
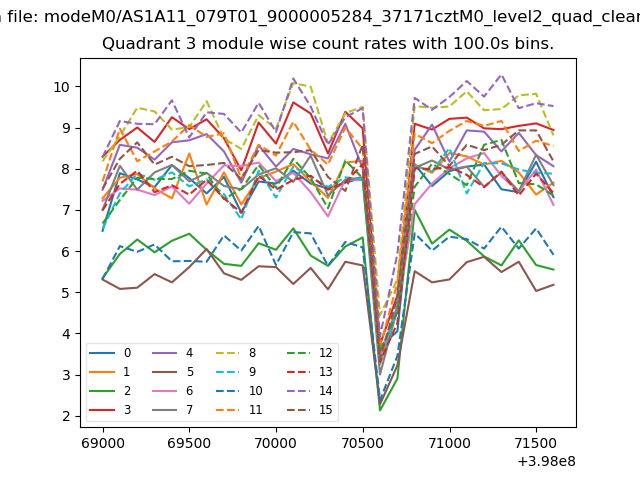
| Module-wise count rates for Quadrant C Data is divided into 100 sec bins |
 |
 |
| Module-wise count rates for Quadrant D Data is divided into 100 sec bins |
 |
 |
| Parameter | Plot |
|---|---|
| CZT HV Monitor | 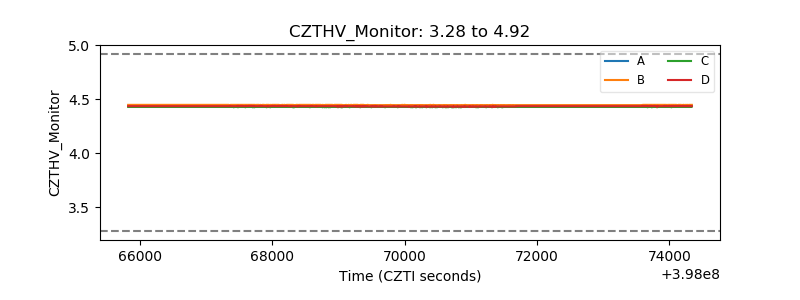 |
| D_VDD | 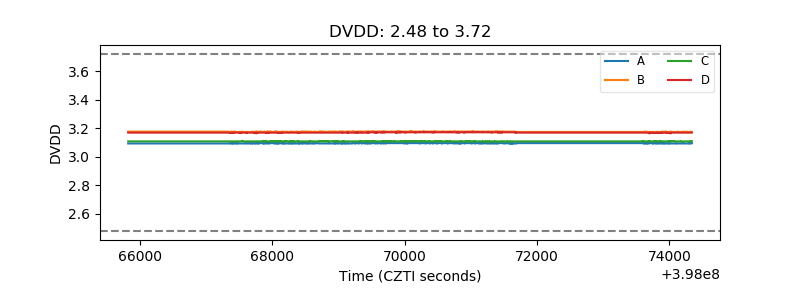 |
| Temperature 1 | 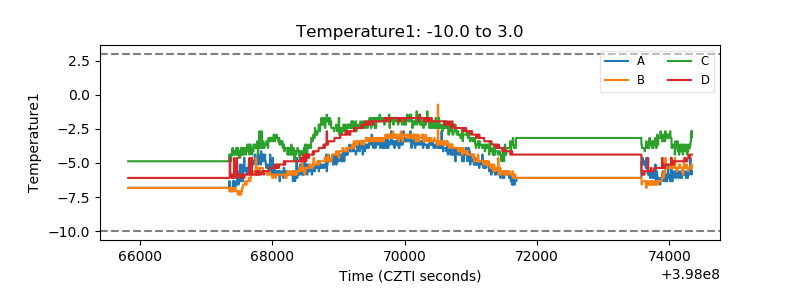 |
| Veto HV Monitor | 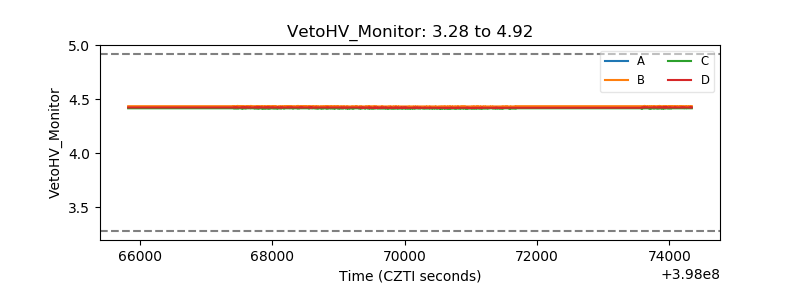 |
| Veto LLD | 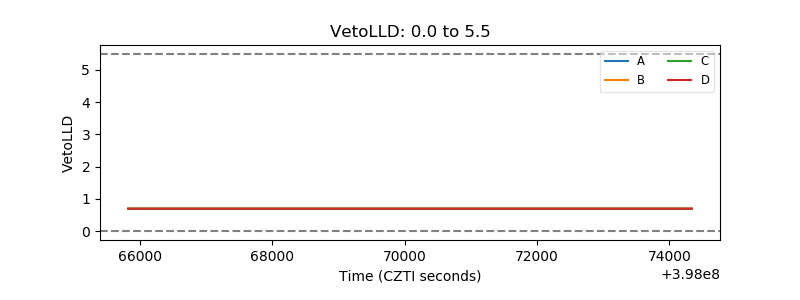 |
| Alpha Counter | 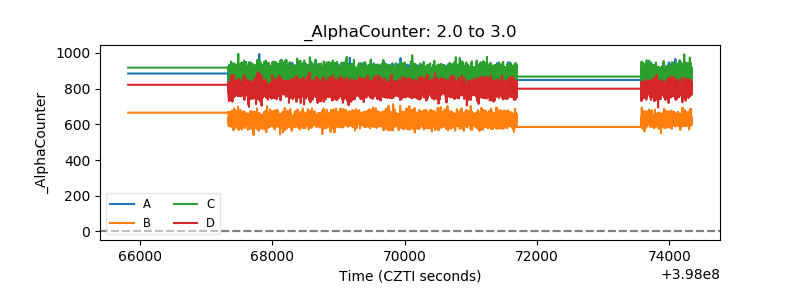 |
| _CPM_Rate |  |
| CZT Counter | 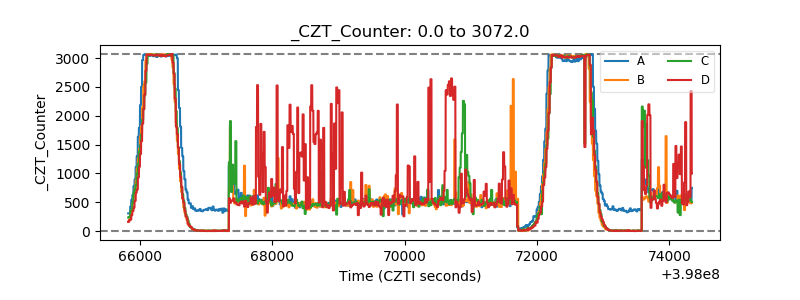 |
| +2.5 Volts monitor | 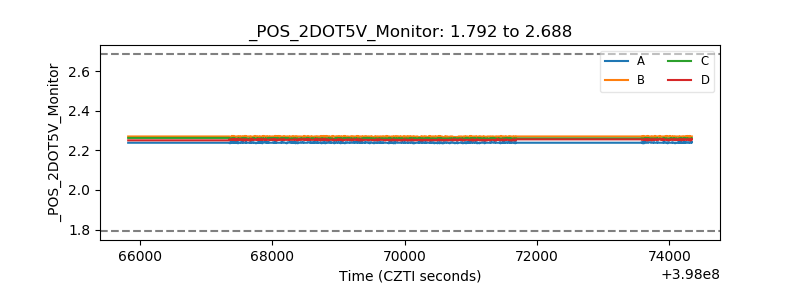 |
| +5 Volts monitor | 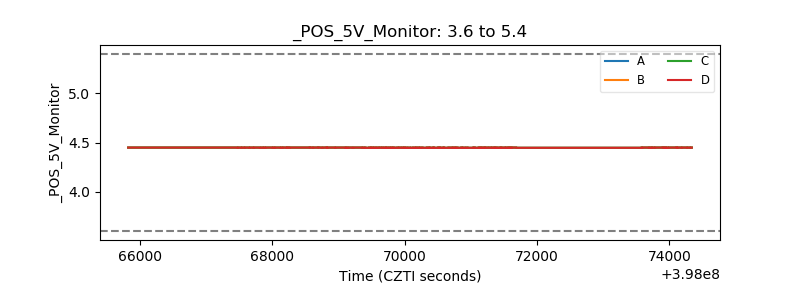 |
| _ROLL_ROT | 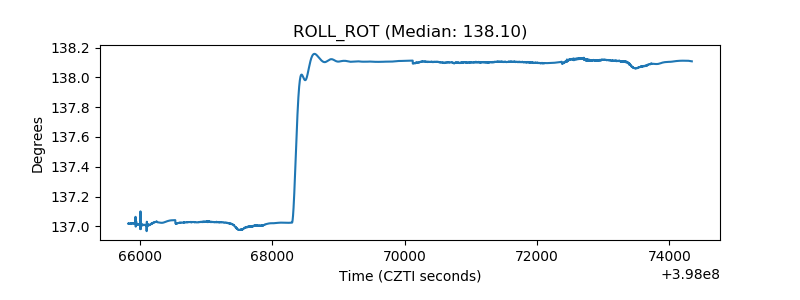 |
| _Roll_DEC | 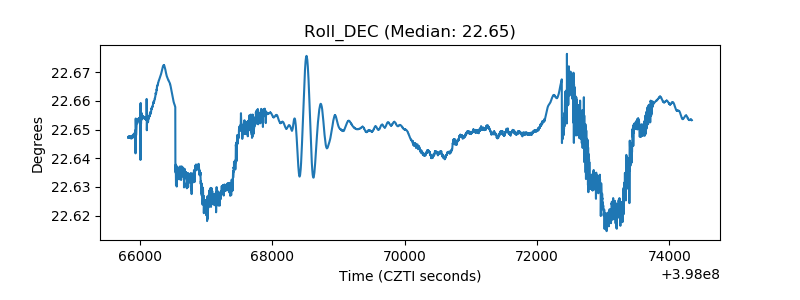 |
| _Roll_RA | 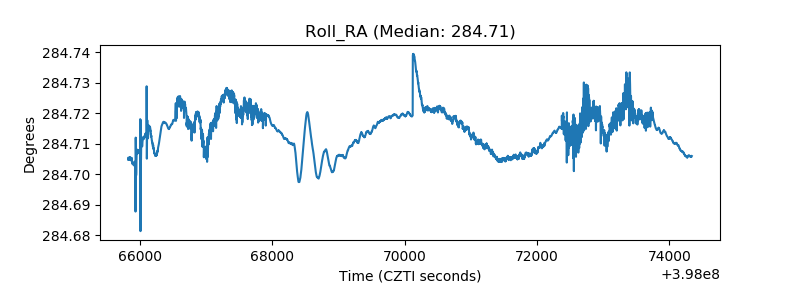 |
| Veto Counter | 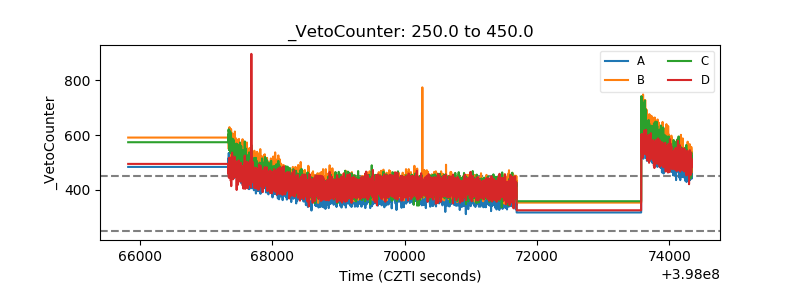 |