| Param | Original file | Final file |
|---|---|---|
| Filename | modeM0/AS1A11_079T01_9000005284_37172cztM0_level2.evt | modeM0/AS1A11_079T01_9000005284_37172cztM0_level2_quad_clean.evt |
| Size (bytes) | 452,289,600 | 66,375,360 |
| Size | 431.3 MB | 63.3 MB |
| Events in quadrant A | 2,860,239 | 428,832 |
| Events in quadrant B | 3,352,742 | 417,693 |
| Events in quadrant C | 3,049,467 | 417,143 |
| Events in quadrant D | 4,088,093 | 387,402 |
| Mode M9 | |||
|---|---|---|---|
| Quadrant | BADHDUFLAG | Total packets | Discarded packets |
| A | 0 | 32 | 0 |
| B | 0 | 32 | 0 |
| C | 0 | 32 | 0 |
| D | 0 | 33 | 0 |
| Mode SS | |||
|---|---|---|---|
| Quadrant | BADHDUFLAG | Total packets | Discarded packets |
| A | 0 | 104 | 0 |
| B | 0 | 104 | 0 |
| C | 0 | 104 | 0 |
| D | 0 | 104 | 0 |
| Mode M0 | |||
|---|---|---|---|
| Quadrant | BADHDUFLAG | Total packets | Discarded packets |
| A | 0 | 11455 | 3 |
| B | 0 | 12960 | 2 |
| C | 0 | 11917 | 2 |
| D | 0 | 15428 | 2 |
| Quadrant | Total seconds | Saturated seconds | Saturation percentage |
|---|---|---|---|
| A | 5117 | 18 | 0.351769% |
| B | 5117 | 224 | 4.377565% |
| C | 5117 | 50 | 0.977135% |
| D | 5117 | 342 | 6.683604% |
Noise dominated data is calculated using 1-second bins in cleaned event files. If a bin has >2000 counts, and if more than 50% of those come from <1% of pixels, then it is considered to be noise-dominated and hence unusable.
| Quadrant | # 1 sec bins | Bins with >0 counts | Bins with >2000 counts | High rate bins dominated by noise | Noise dominated (total time) | Noise dominated (detector-on time) | Marked lightcurve |
|---|---|---|---|---|---|---|---|
| A | 7120 | 5118 | 5 | 5 | 0.07% | 0.10% | 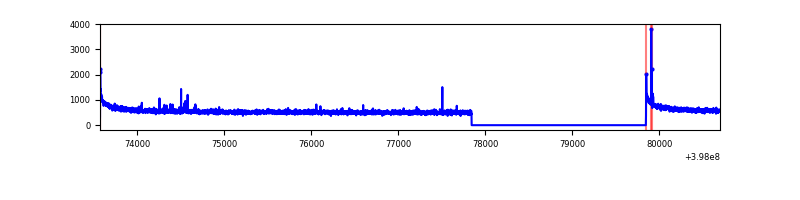 |
| B | 7120 | 5118 | 171 | 171 | 2.40% | 3.34% | 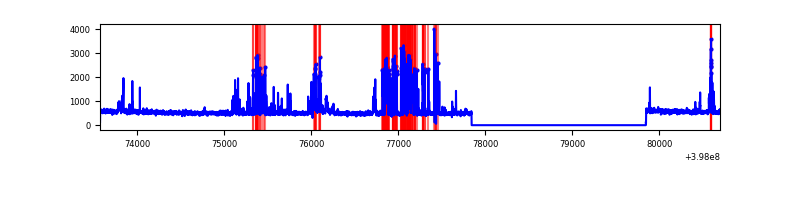 |
| C | 7120 | 5118 | 43 | 43 | 0.60% | 0.84% | 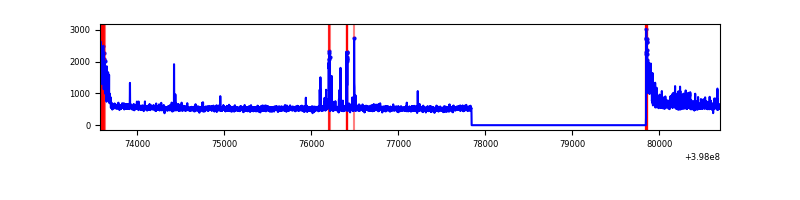 |
| D | 7120 | 5118 | 298 | 298 | 4.19% | 5.82% | 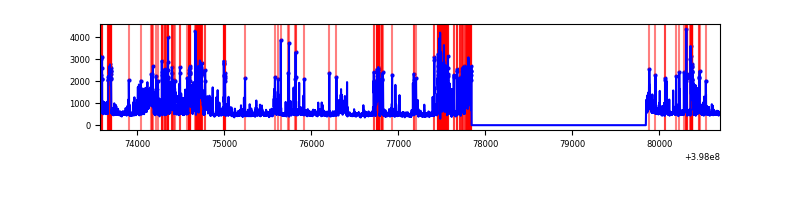 |
Top three noisy pixels from each quadrant. If the there are fewer than three noisy pixels in the level2.evt file, extra rows are filled as -1
| Pixel properties | Quadrant properties | ||||||
|---|---|---|---|---|---|---|---|
| Quadrant | DetID | PixID | Counts | Sigma | Mean | Median | Sigma |
| A | 10 | 83 | 251172 | 1891.26 | 666 | 656 | 132.5 |
| A | 9 | 143 | 30016 | 221.65 | 666 | 656 | 132.5 |
| A | 13 | 254 | 7296 | 50.13 | 666 | 656 | 132.5 |
| B | 5 | 200 | 423084 | 3441.98 | 648 | 634 | 122.7 |
| B | 5 | 172 | 309344 | 2515.27 | 648 | 634 | 122.7 |
| B | 4 | 232 | 48556 | 390.45 | 648 | 634 | 122.7 |
| C | 15 | 214 | 222805 | 1531.73 | 633 | 641 | 145.0 |
| C | 0 | 10 | 182922 | 1256.75 | 633 | 641 | 145.0 |
| C | 10 | 49 | 83139 | 568.79 | 633 | 641 | 145.0 |
| D | 2 | 250 | 450954 | 2978.07 | 624 | 609 | 151.2 |
| D | 2 | 249 | 339515 | 2241.14 | 624 | 609 | 151.2 |
| D | 12 | 6 | 334433 | 2207.53 | 624 | 609 | 151.2 |
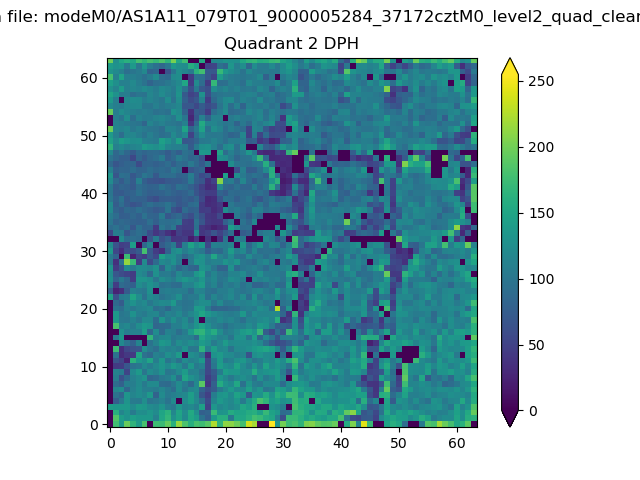
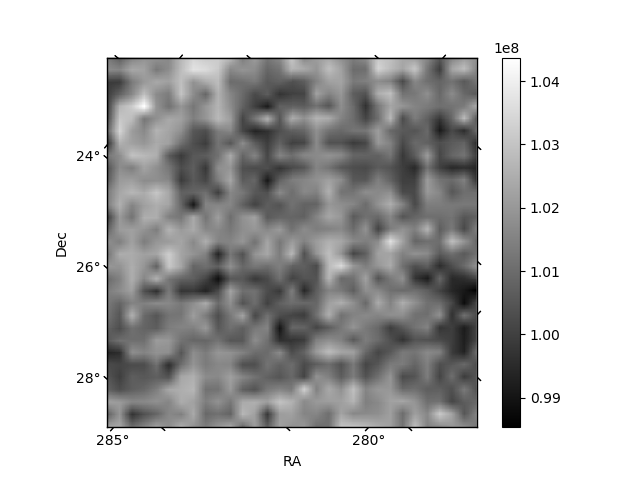
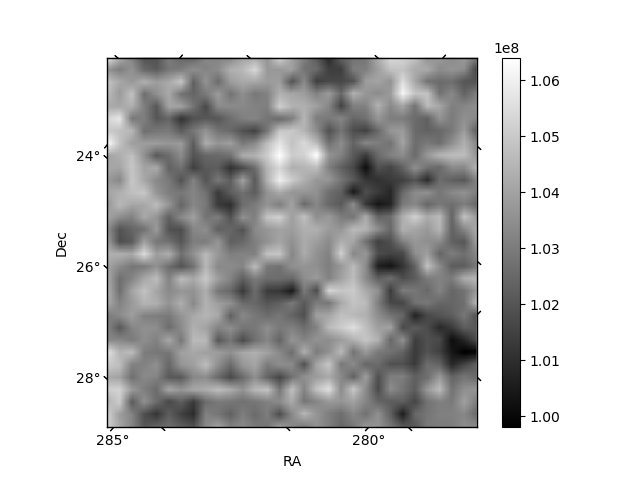
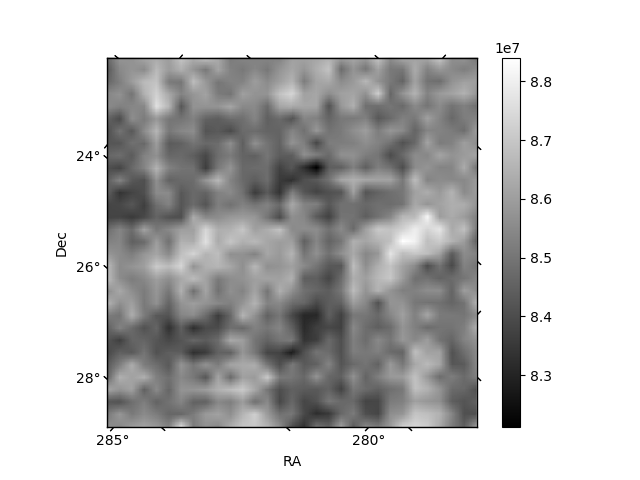
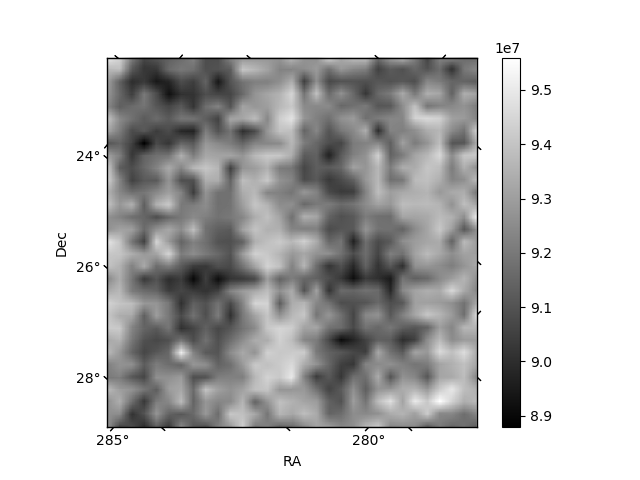
Histogram calculated using DETX and DETY for each event in the final _common_clean file
| Quadrant A | 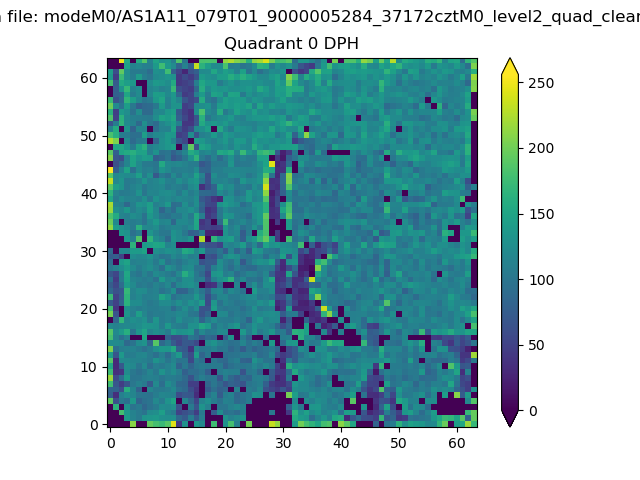 |
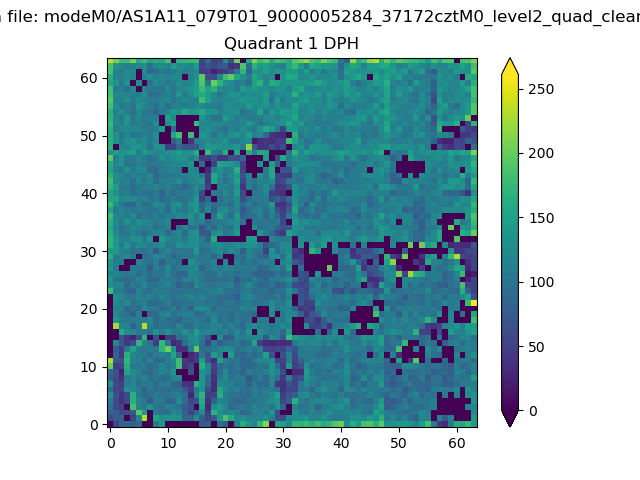 |
Quadrant B |
|---|---|---|---|
| Quadrant D | 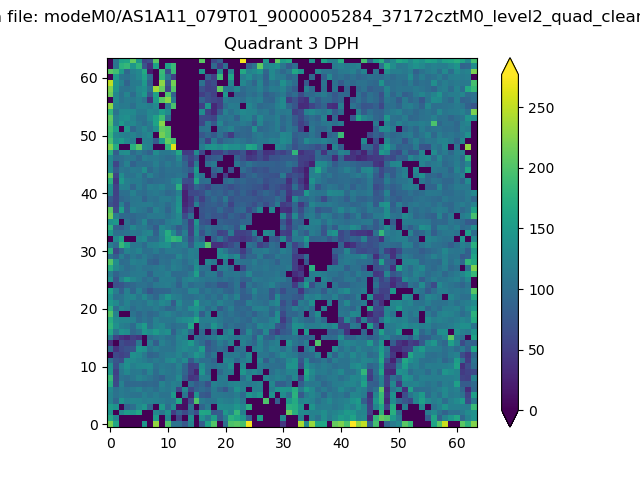 |
 |
Quadrant C |
| Plot type | Count rate plots | Images |
|---|---|---|
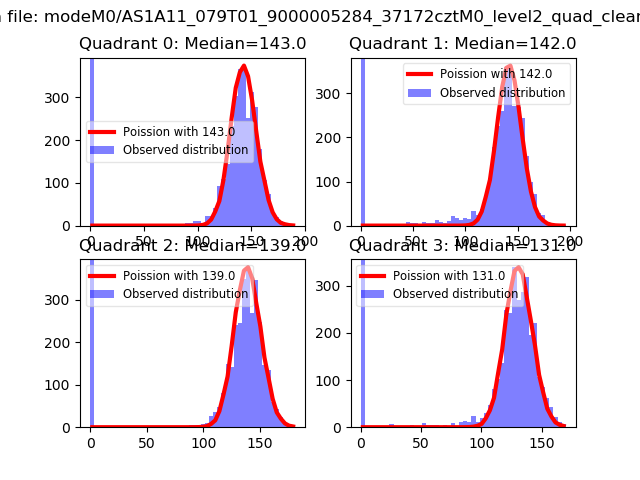
| Comparison with Poisson distribution Blue bars denote a histogram of data divided into 1 sec bins. Red curve is a Poisson curve with rate = median count rate of data. |
 |
 |
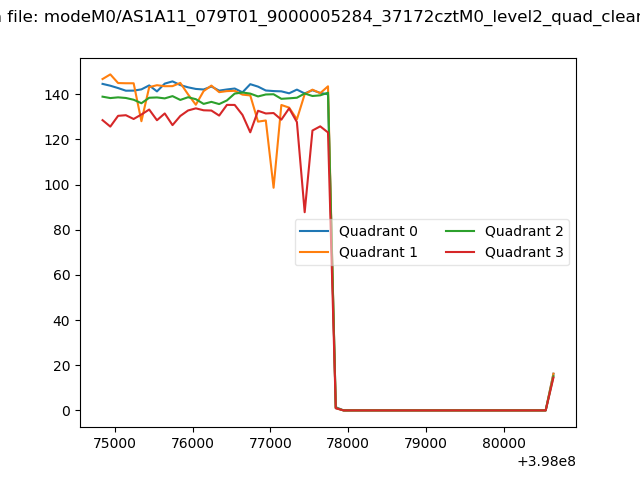
| Quadrant-wise count rates Data is divided into 100 sec bins |
 |
|
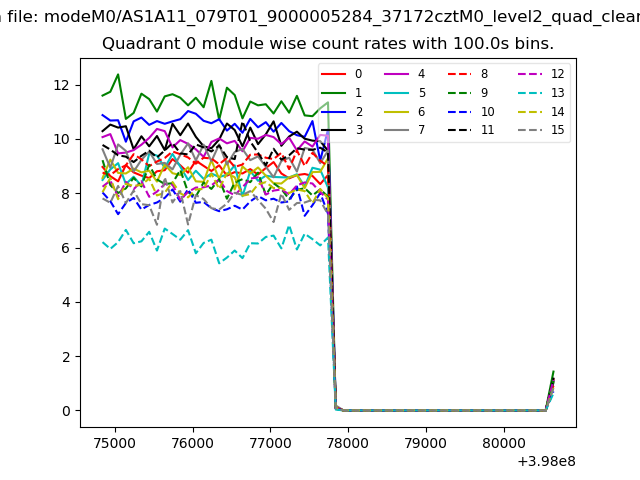
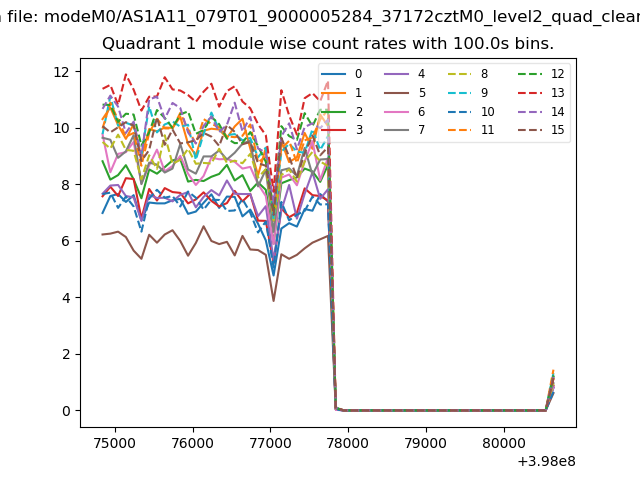
| Module-wise count rates for Quadrant A Data is divided into 100 sec bins |
 |
 |
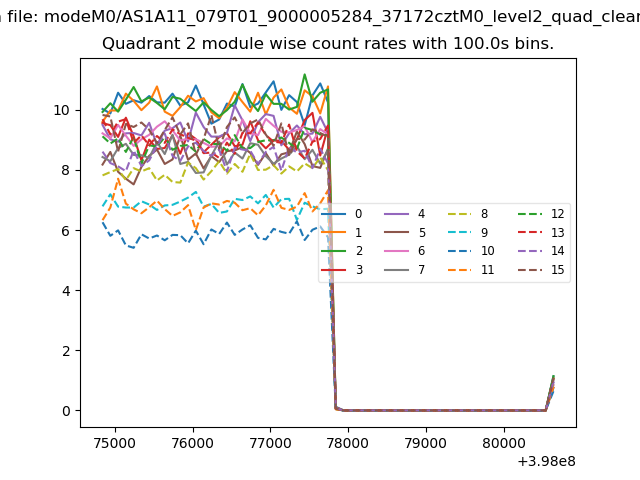
| Module-wise count rates for Quadrant B Data is divided into 100 sec bins |
 |
 |
| Module-wise count rates for Quadrant C Data is divided into 100 sec bins |
 |
 |
| Module-wise count rates for Quadrant D Data is divided into 100 sec bins |
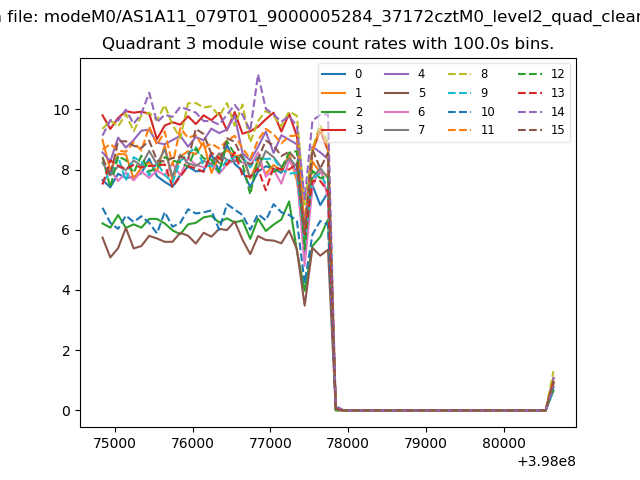 |
 |
| Parameter | Plot |
|---|---|
| CZT HV Monitor | 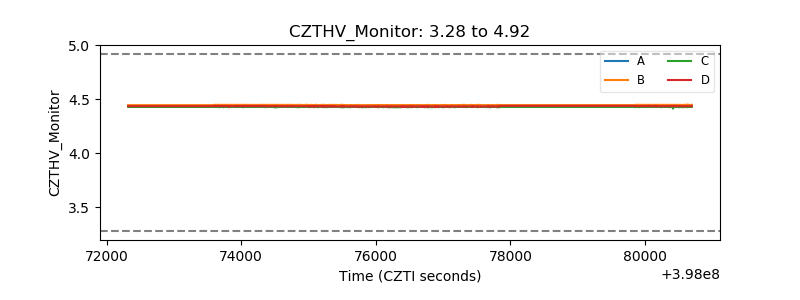 |
| D_VDD | 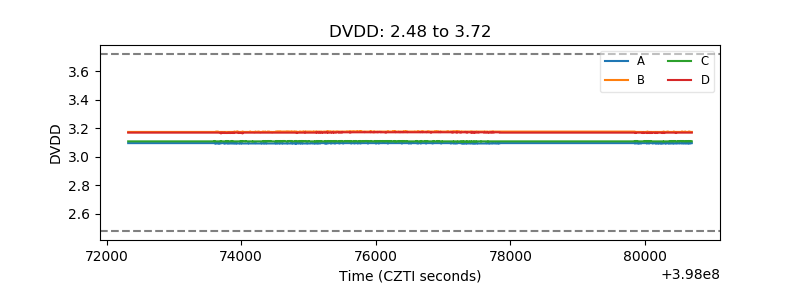 |
| Temperature 1 | 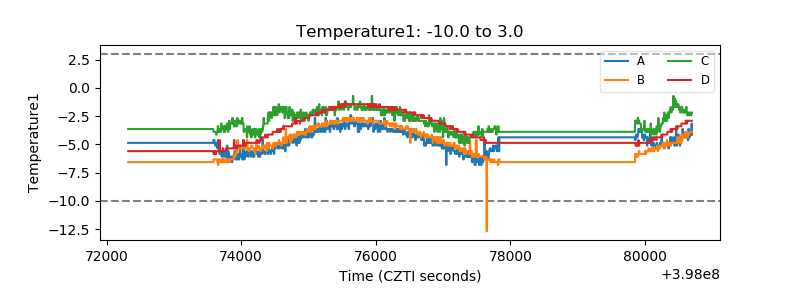 |
| Veto HV Monitor | 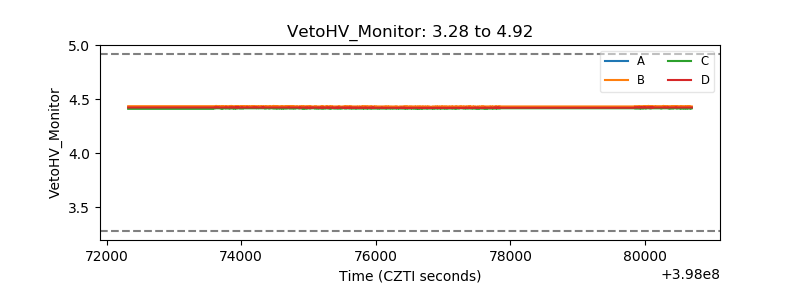 |
| Veto LLD | 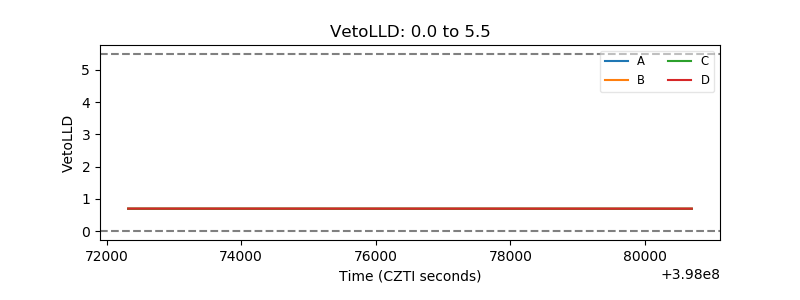 |
| Alpha Counter | 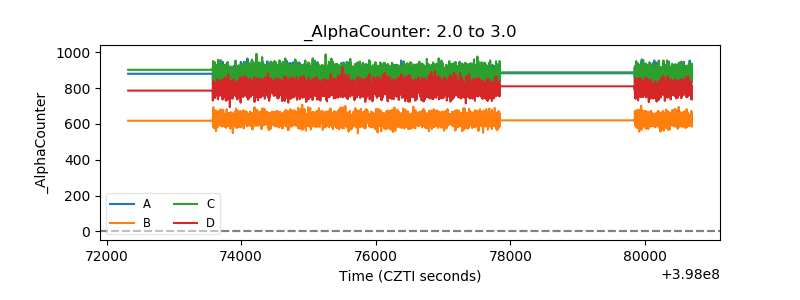 |
| _CPM_Rate | 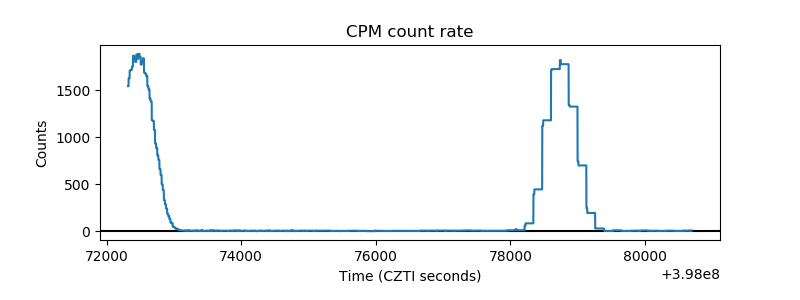 |
| CZT Counter | 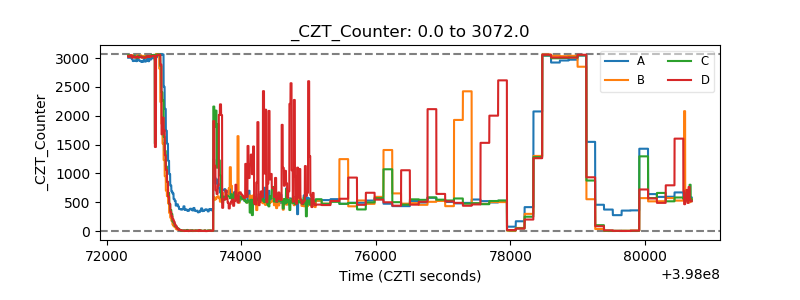 |
| +2.5 Volts monitor | 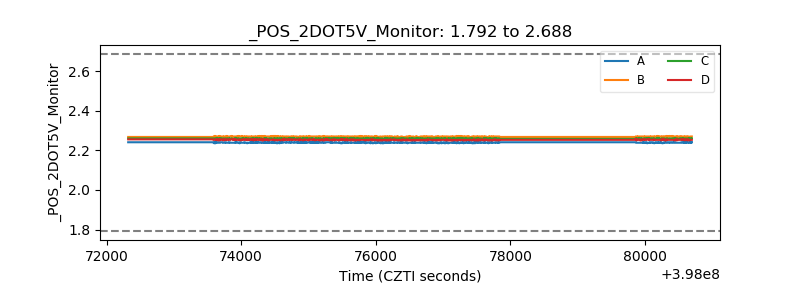 |
| +5 Volts monitor | 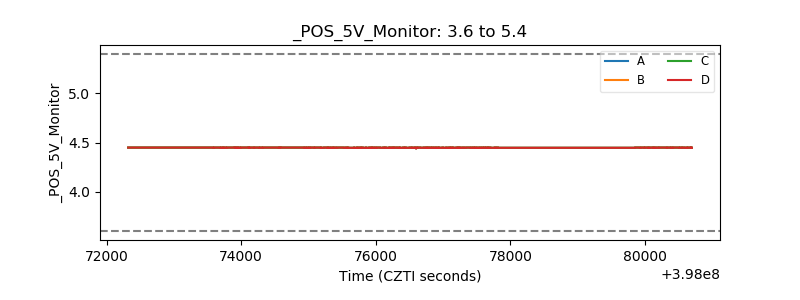 |
| _ROLL_ROT | 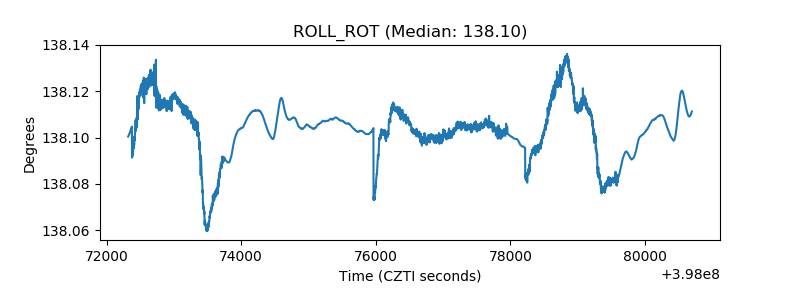 |
| _Roll_DEC | 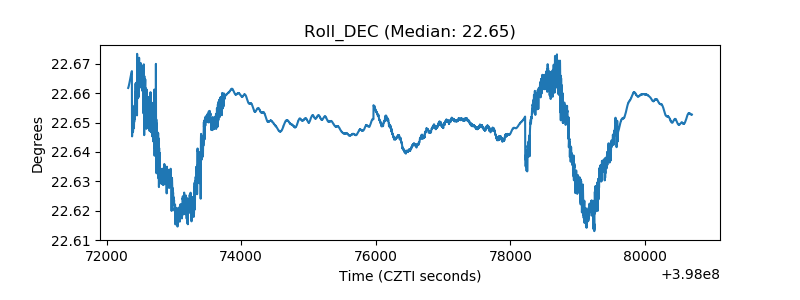 |
| _Roll_RA | 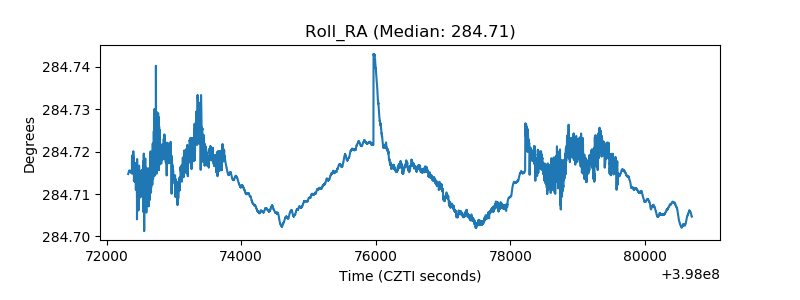 |
| Veto Counter | 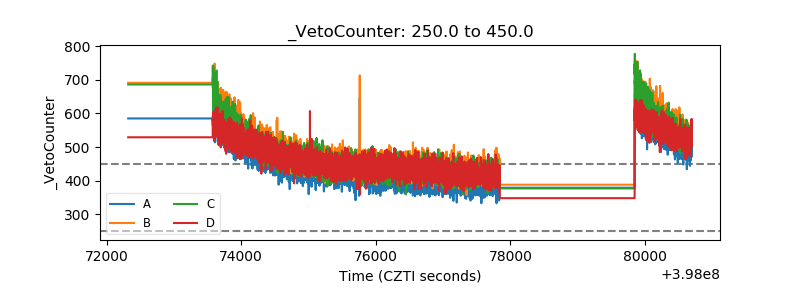 |