| Param | Original file | Final file |
|---|---|---|
| Filename | modeM0/AS1A11_079T01_9000005284_37173cztM0_level2.evt | modeM0/AS1A11_079T01_9000005284_37173cztM0_level2_quad_clean.evt |
| Size (bytes) | 443,554,560 | 81,175,680 |
| Size | 423.0 MB | 77.4 MB |
| Events in quadrant A | 2,825,543 | 546,518 |
| Events in quadrant B | 2,857,149 | 547,668 |
| Events in quadrant C | 3,128,377 | 529,193 |
| Events in quadrant D | 4,285,606 | 486,919 |
| Mode M9 | |||
|---|---|---|---|
| Quadrant | BADHDUFLAG | Total packets | Discarded packets |
| A | 0 | 30 | 0 |
| B | 0 | 30 | 0 |
| C | 0 | 30 | 0 |
| D | 0 | 31 | 0 |
| Mode SS | |||
|---|---|---|---|
| Quadrant | BADHDUFLAG | Total packets | Discarded packets |
| A | 0 | 102 | 0 |
| B | 0 | 102 | 0 |
| C | 0 | 102 | 0 |
| D | 0 | 102 | 0 |
| Mode M0 | |||
|---|---|---|---|
| Quadrant | BADHDUFLAG | Total packets | Discarded packets |
| A | 0 | 11343 | 3 |
| B | 0 | 11476 | 2 |
| C | 0 | 12306 | 2 |
| D | 0 | 16007 | 2 |
| Quadrant | Total seconds | Saturated seconds | Saturation percentage |
|---|---|---|---|
| A | 4956 | 17 | 0.343019% |
| B | 4956 | 45 | 0.907990% |
| C | 4956 | 57 | 1.150121% |
| D | 4956 | 339 | 6.840194% |
Noise dominated data is calculated using 1-second bins in cleaned event files. If a bin has >2000 counts, and if more than 50% of those come from <1% of pixels, then it is considered to be noise-dominated and hence unusable.
| Quadrant | # 1 sec bins | Bins with >0 counts | Bins with >2000 counts | High rate bins dominated by noise | Noise dominated (total time) | Noise dominated (detector-on time) | Marked lightcurve |
|---|---|---|---|---|---|---|---|
| A | 7049 | 4957 | 5 | 5 | 0.07% | 0.10% | 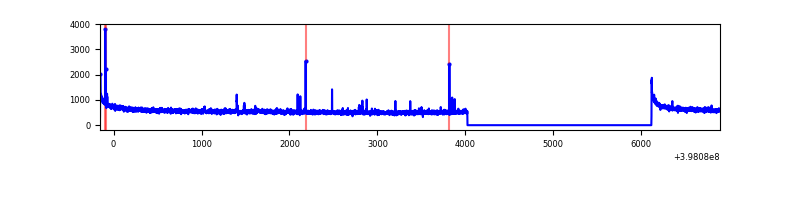 |
| B | 7049 | 4957 | 17 | 17 | 0.24% | 0.34% | 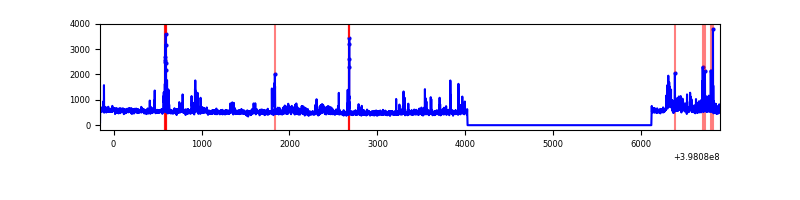 |
| C | 7049 | 4957 | 47 | 47 | 0.67% | 0.95% | 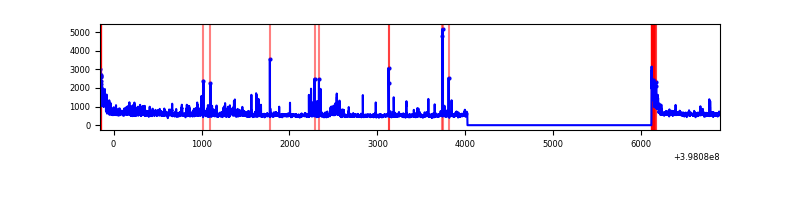 |
| D | 7049 | 4957 | 323 | 323 | 4.58% | 6.52% | 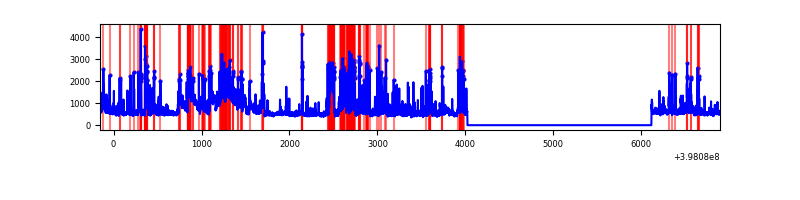 |
Top three noisy pixels from each quadrant. If the there are fewer than three noisy pixels in the level2.evt file, extra rows are filled as -1
| Pixel properties | Quadrant properties | ||||||
|---|---|---|---|---|---|---|---|
| Quadrant | DetID | PixID | Counts | Sigma | Mean | Median | Sigma |
| A | 10 | 83 | 251819 | 1930.57 | 652 | 642 | 130.1 |
| A | 9 | 143 | 26550 | 199.13 | 652 | 642 | 130.1 |
| A | 13 | 6 | 12923 | 94.39 | 652 | 642 | 130.1 |
| B | 5 | 172 | 105257 | 865.7 | 638 | 627 | 120.9 |
| B | 0 | 190 | 61399 | 502.82 | 638 | 627 | 120.9 |
| B | 4 | 232 | 54222 | 443.44 | 638 | 627 | 120.9 |
| C | 15 | 214 | 216213 | 1512.72 | 618 | 623 | 142.5 |
| C | 10 | 49 | 203985 | 1426.92 | 618 | 623 | 142.5 |
| C | 0 | 10 | 159695 | 1116.15 | 618 | 623 | 142.5 |
| D | 10 | 253 | 930875 | 6300.29 | 615 | 601 | 147.7 |
| D | 2 | 249 | 205719 | 1389.16 | 615 | 601 | 147.7 |
| D | 12 | 6 | 163103 | 1100.55 | 615 | 601 | 147.7 |
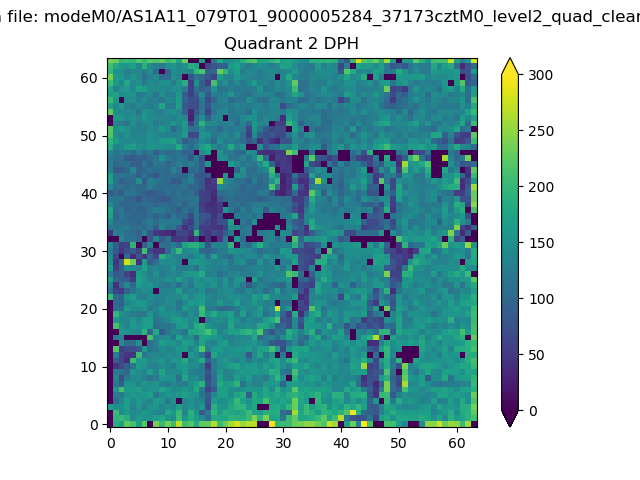
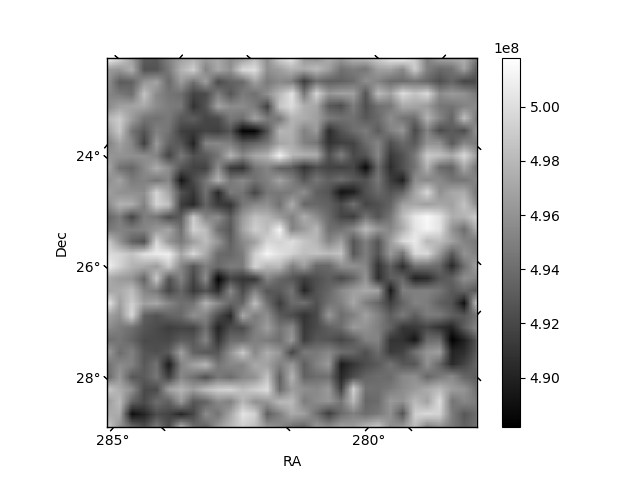
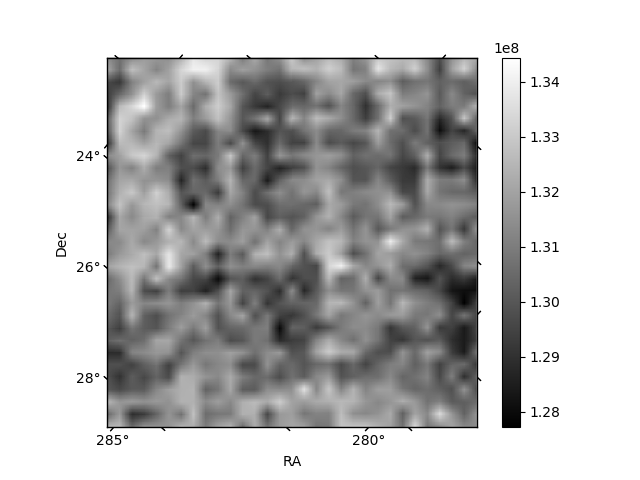
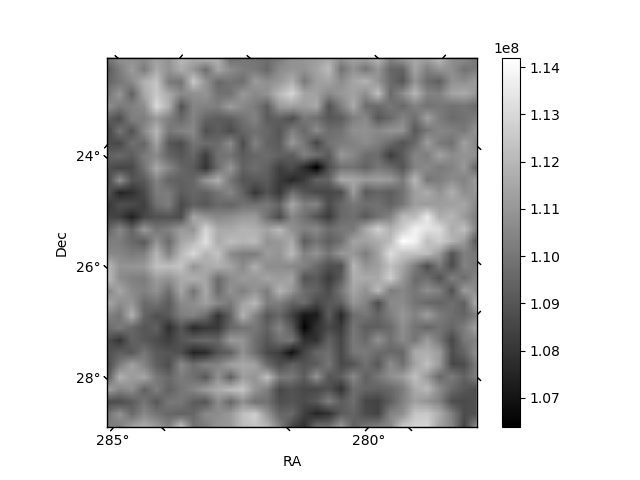
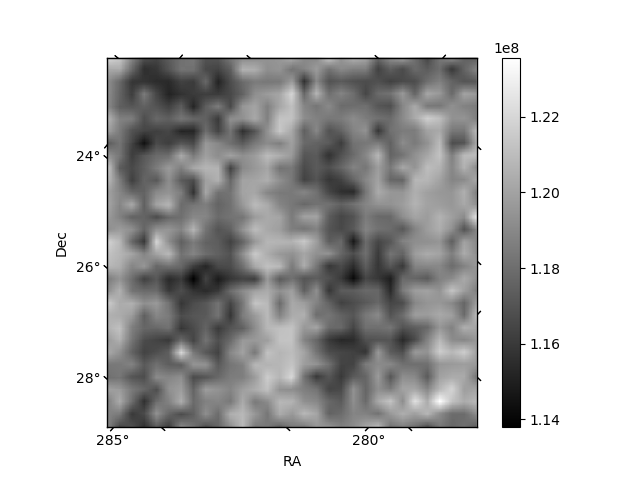
Histogram calculated using DETX and DETY for each event in the final _common_clean file
| Quadrant A | 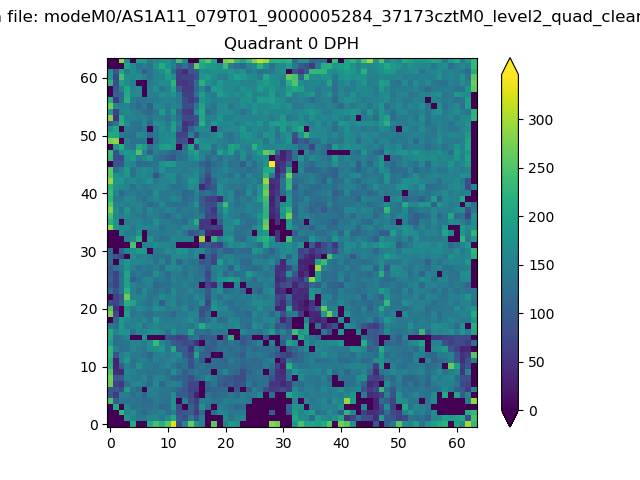 |
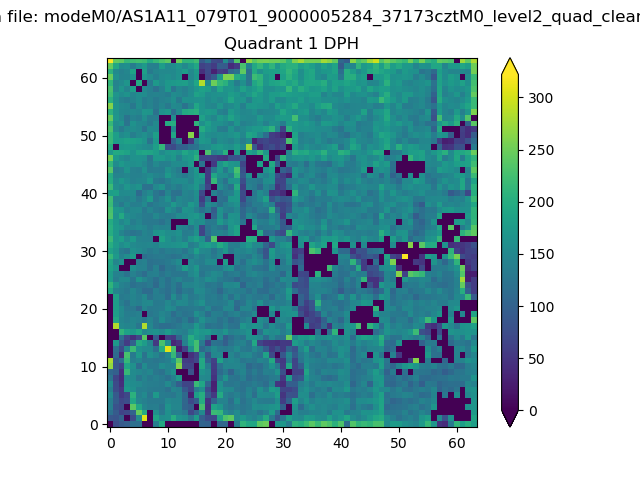 |
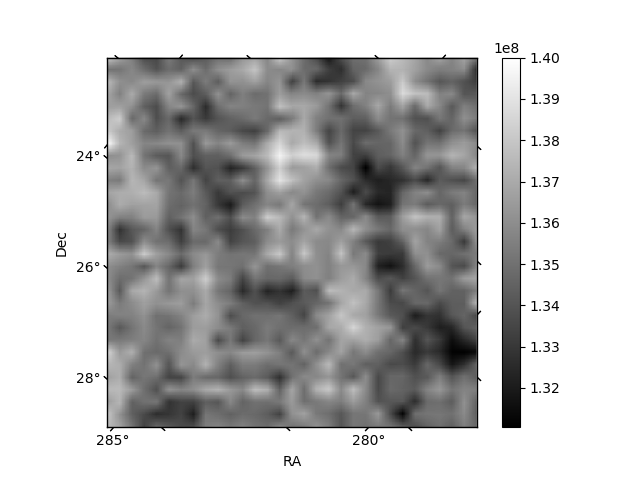
Quadrant B |
|---|---|---|---|
| Quadrant D | 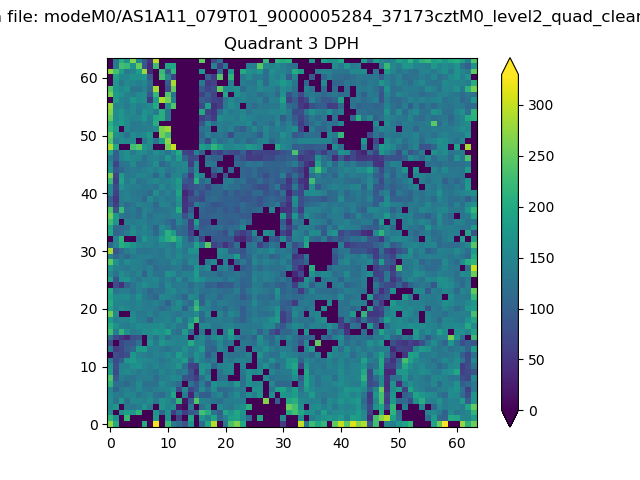 |
 |
Quadrant C |
| Plot type | Count rate plots | Images |
|---|---|---|
| Comparison with Poisson distribution Blue bars denote a histogram of data divided into 1 sec bins. Red curve is a Poisson curve with rate = median count rate of data. |
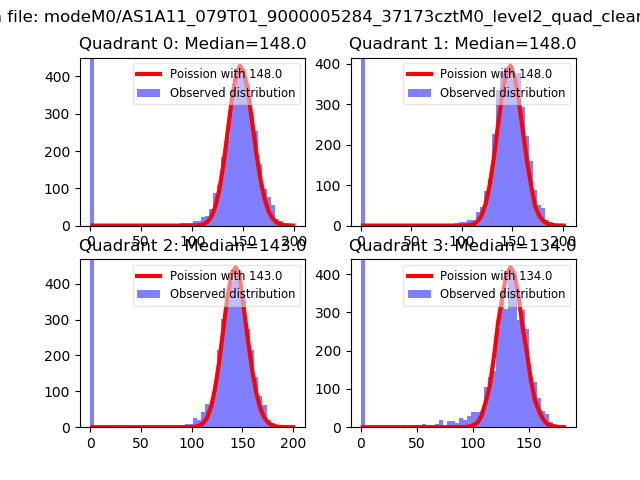 |
 |
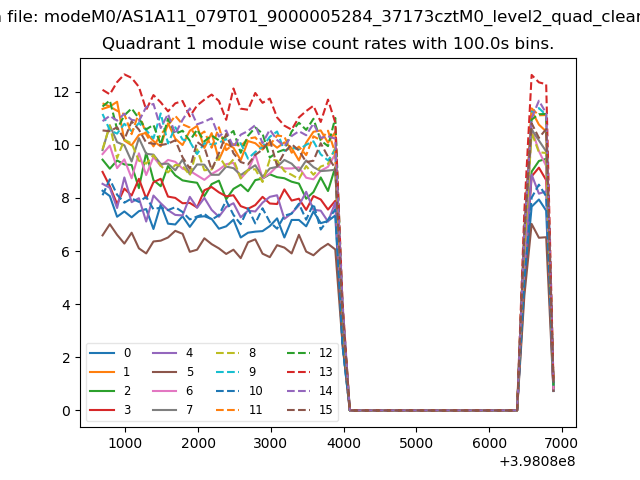
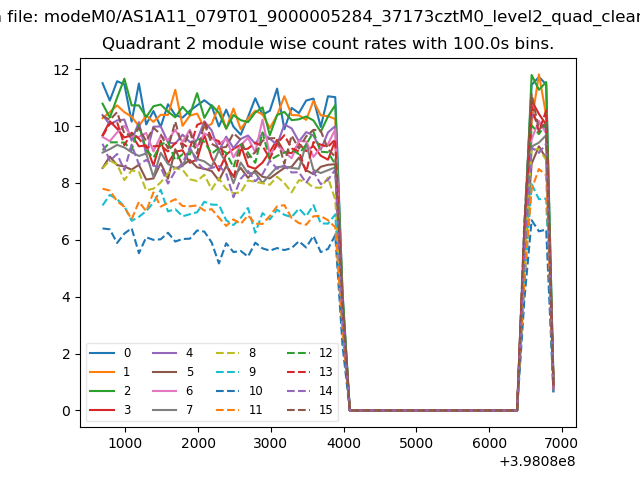
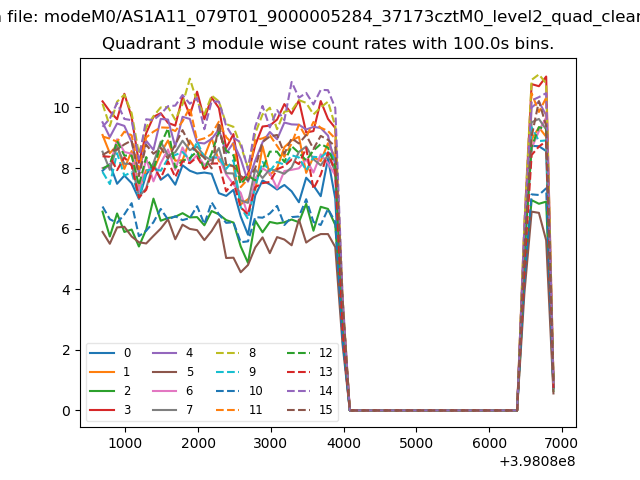
| Quadrant-wise count rates Data is divided into 100 sec bins |
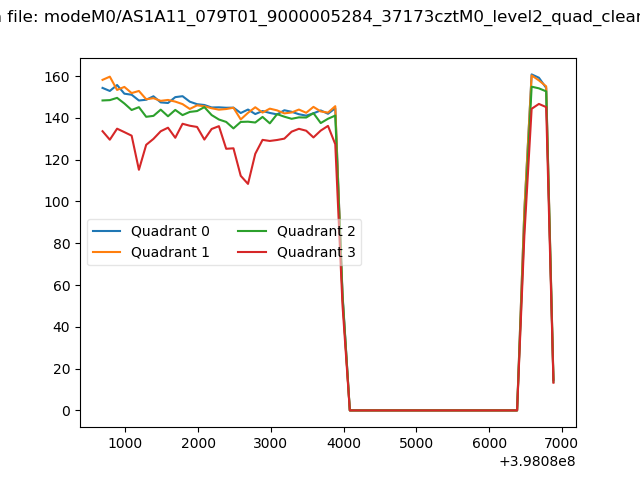 |
|
| Module-wise count rates for Quadrant A Data is divided into 100 sec bins |
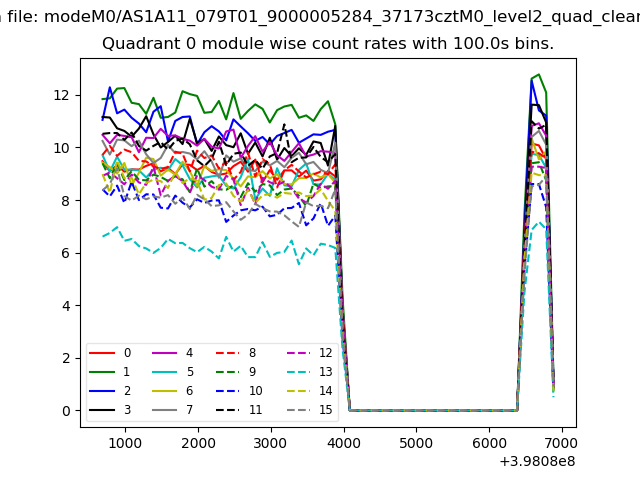 |
 |
| Module-wise count rates for Quadrant B Data is divided into 100 sec bins |
 |
 |
| Module-wise count rates for Quadrant C Data is divided into 100 sec bins |
 |
 |
| Module-wise count rates for Quadrant D Data is divided into 100 sec bins |
 |
 |
| Parameter | Plot |
|---|---|
| CZT HV Monitor | 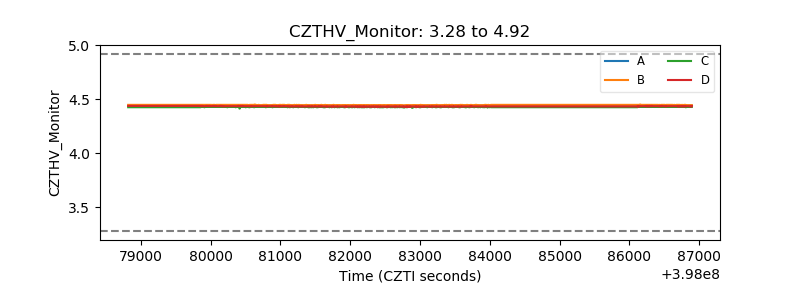 |
| D_VDD | 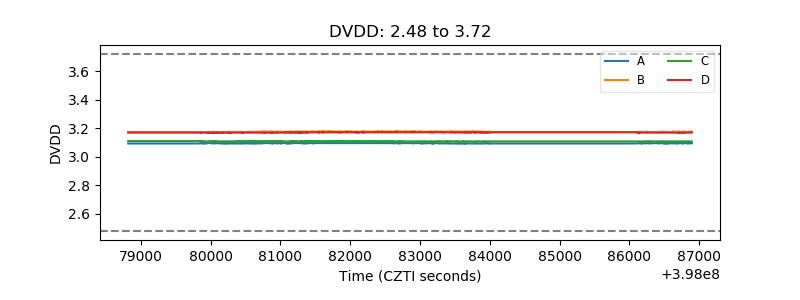 |
| Temperature 1 | 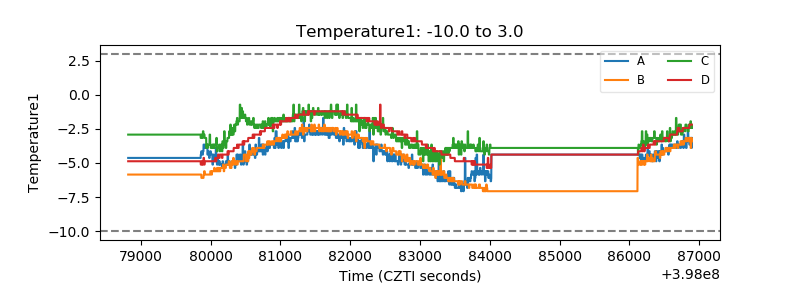 |
| Veto HV Monitor | 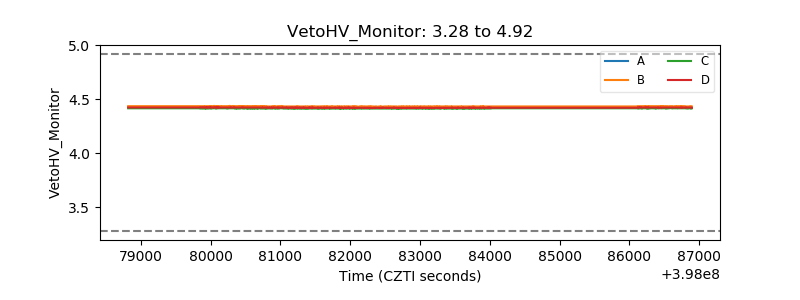 |
| Veto LLD | 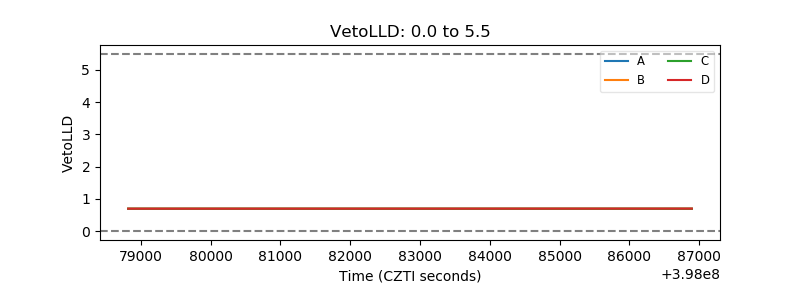 |
| Alpha Counter |  |
| _CPM_Rate | 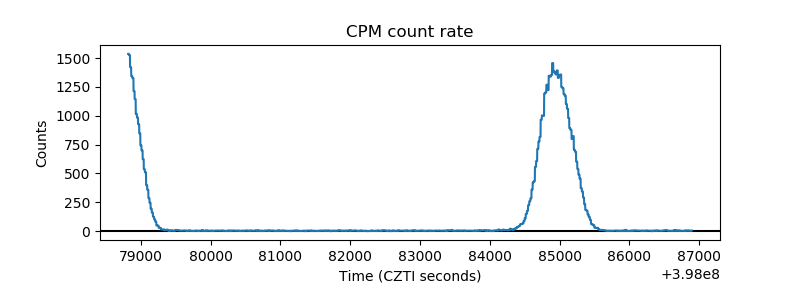 |
| CZT Counter | 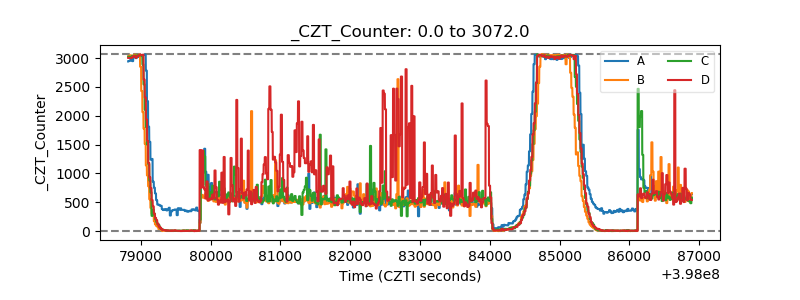 |
| +2.5 Volts monitor | 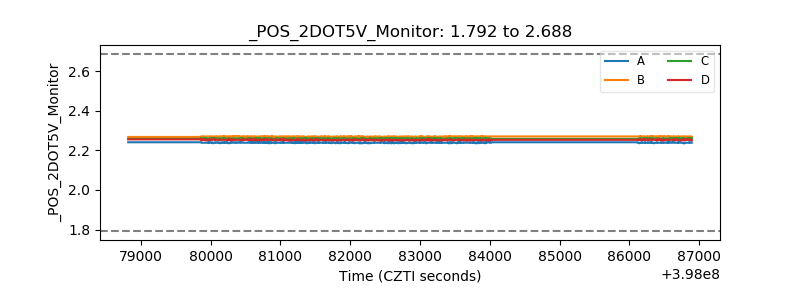 |
| +5 Volts monitor |  |
| _ROLL_ROT | 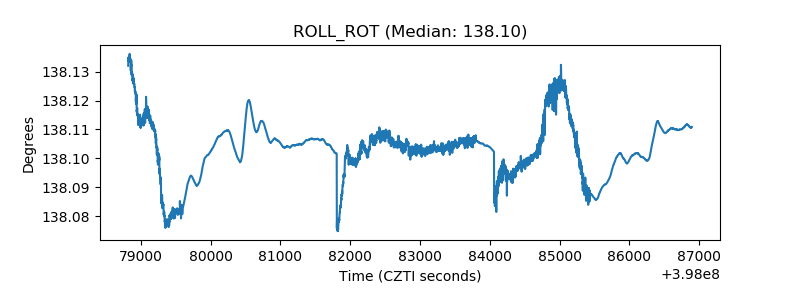 |
| _Roll_DEC | 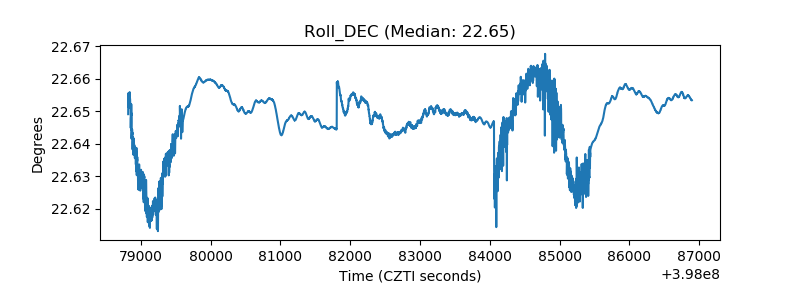 |
| _Roll_RA | 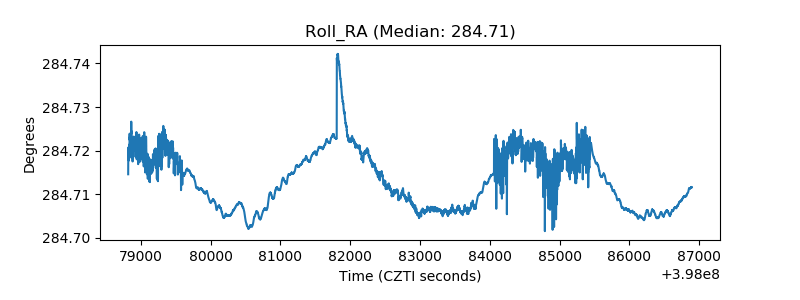 |
| Veto Counter | 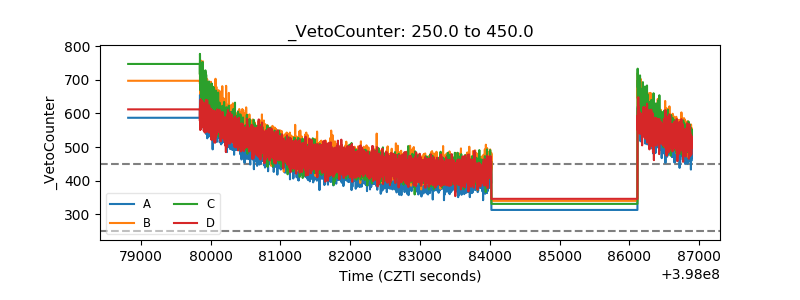 |