| Param | Original file | Final file |
|---|---|---|
| Filename | modeM0/AS1A11_079T01_9000005284_37175cztM0_level2.evt | modeM0/AS1A11_079T01_9000005284_37175cztM0_level2_quad_clean.evt |
| Size (bytes) | 417,836,160 | 91,779,840 |
| Size | 398.5 MB | 87.5 MB |
| Events in quadrant A | 2,751,674 | 621,863 |
| Events in quadrant B | 2,705,218 | 623,341 |
| Events in quadrant C | 2,953,605 | 608,709 |
| Events in quadrant D | 3,898,353 | 569,242 |
| Mode M9 | |||
|---|---|---|---|
| Quadrant | BADHDUFLAG | Total packets | Discarded packets |
| A | 0 | 24 | 0 |
| B | 0 | 24 | 0 |
| C | 0 | 24 | 0 |
| D | 0 | 25 | 0 |
| Mode SS | |||
|---|---|---|---|
| Quadrant | BADHDUFLAG | Total packets | Discarded packets |
| A | 0 | 104 | 0 |
| B | 0 | 104 | 0 |
| C | 0 | 104 | 0 |
| D | 0 | 104 | 0 |
| Mode M0 | |||
|---|---|---|---|
| Quadrant | BADHDUFLAG | Total packets | Discarded packets |
| A | 0 | 11314 | 3 |
| B | 0 | 11125 | 2 |
| C | 0 | 11723 | 2 |
| D | 0 | 14873 | 2 |
| Quadrant | Total seconds | Saturated seconds | Saturation percentage |
|---|---|---|---|
| A | 5083 | 19 | 0.373795% |
| B | 5083 | 32 | 0.629549% |
| C | 5083 | 76 | 1.495180% |
| D | 5083 | 260 | 5.115090% |
Noise dominated data is calculated using 1-second bins in cleaned event files. If a bin has >2000 counts, and if more than 50% of those come from <1% of pixels, then it is considered to be noise-dominated and hence unusable.
| Quadrant | # 1 sec bins | Bins with >0 counts | Bins with >2000 counts | High rate bins dominated by noise | Noise dominated (total time) | Noise dominated (detector-on time) | Marked lightcurve |
|---|---|---|---|---|---|---|---|
| A | 7176 | 5084 | 11 | 11 | 0.15% | 0.22% | 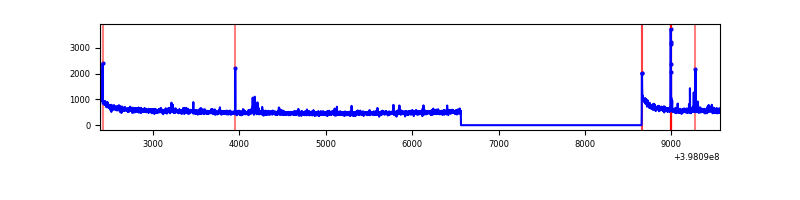 |
| B | 7176 | 5084 | 13 | 13 | 0.18% | 0.26% | 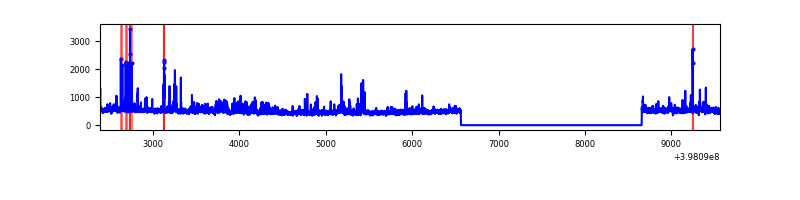 |
| C | 7176 | 5084 | 60 | 60 | 0.84% | 1.18% | 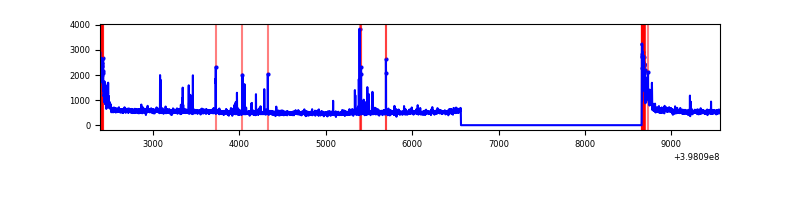 |
| D | 7176 | 5084 | 232 | 232 | 3.23% | 4.56% | 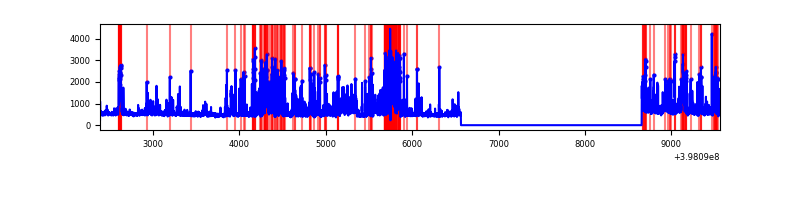 |
Top three noisy pixels from each quadrant. If the there are fewer than three noisy pixels in the level2.evt file, extra rows are filled as -1
| Pixel properties | Quadrant properties | ||||||
|---|---|---|---|---|---|---|---|
| Quadrant | DetID | PixID | Counts | Sigma | Mean | Median | Sigma |
| A | 10 | 83 | 254017 | 2023.12 | 620 | 609 | 125.3 |
| A | 9 | 143 | 52943 | 417.82 | 620 | 609 | 125.3 |
| A | 8 | 144 | 38942 | 306.04 | 620 | 609 | 125.3 |
| B | 5 | 172 | 113217 | 972.03 | 606 | 590 | 115.9 |
| B | 0 | 190 | 96712 | 829.58 | 606 | 590 | 115.9 |
| B | 4 | 232 | 42502 | 361.72 | 606 | 590 | 115.9 |
| C | 0 | 10 | 268356 | 1940.4 | 594 | 600 | 138.0 |
| C | 15 | 214 | 218138 | 1576.47 | 594 | 600 | 138.0 |
| C | 10 | 49 | 38861 | 277.27 | 594 | 600 | 138.0 |
| D | 2 | 249 | 540735 | 3759.05 | 594 | 579 | 143.7 |
| D | 1 | 52 | 456656 | 3173.93 | 594 | 579 | 143.7 |
| D | 12 | 6 | 262194 | 1820.63 | 594 | 579 | 143.7 |
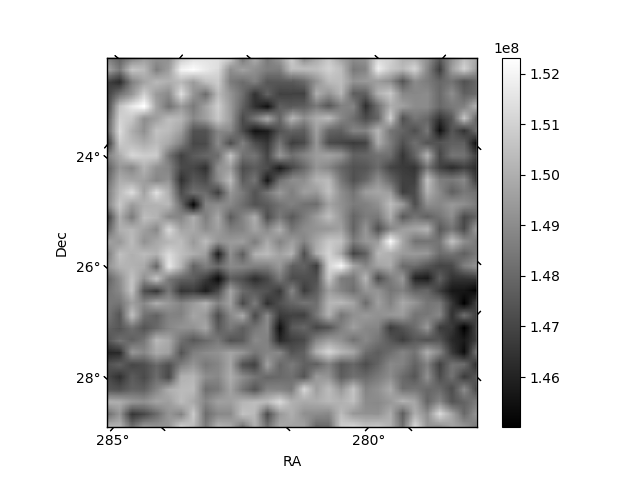
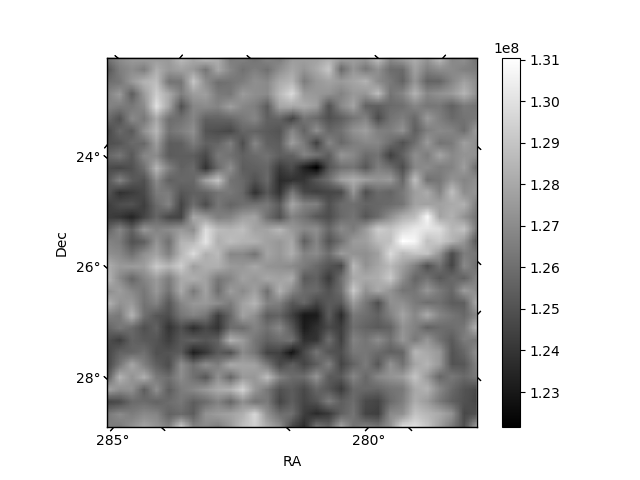
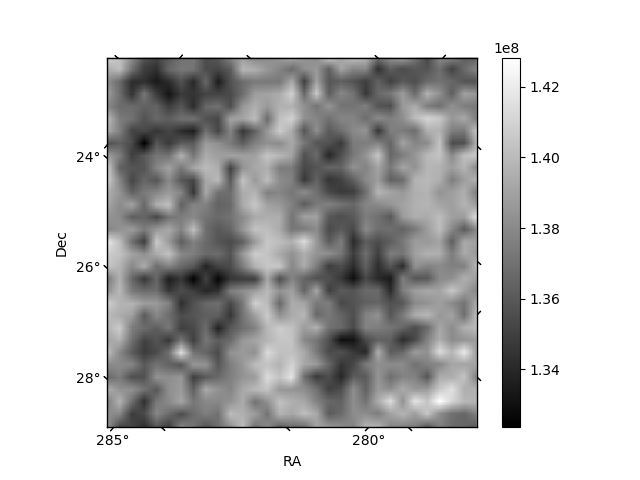
Histogram calculated using DETX and DETY for each event in the final _common_clean file
| Quadrant A | 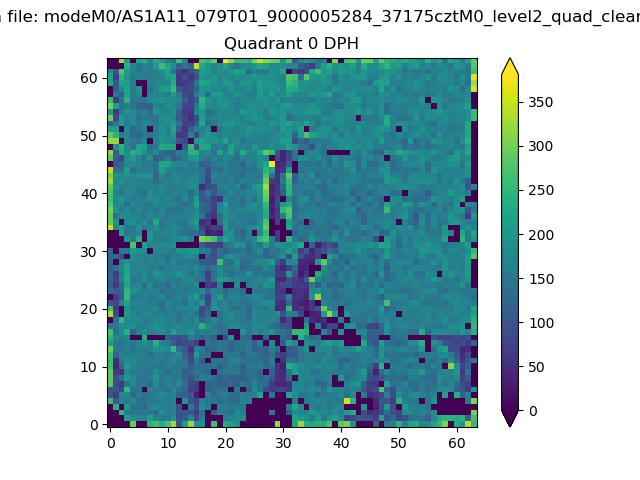 |
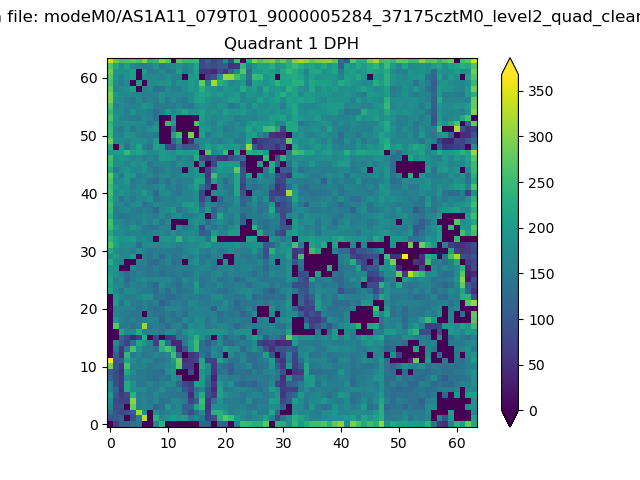 |
Quadrant B |
|---|---|---|---|
| Quadrant D |  |
 |
Quadrant C |
| Plot type | Count rate plots | Images |
|---|---|---|
| Comparison with Poisson distribution Blue bars denote a histogram of data divided into 1 sec bins. Red curve is a Poisson curve with rate = median count rate of data. |
 |
 |
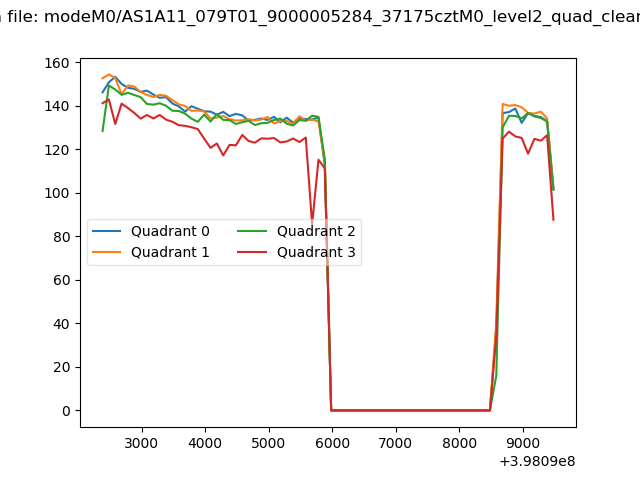
| Quadrant-wise count rates Data is divided into 100 sec bins |
 |
|
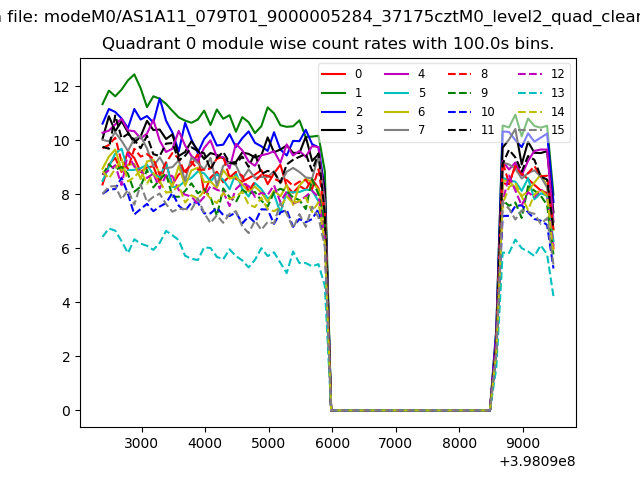
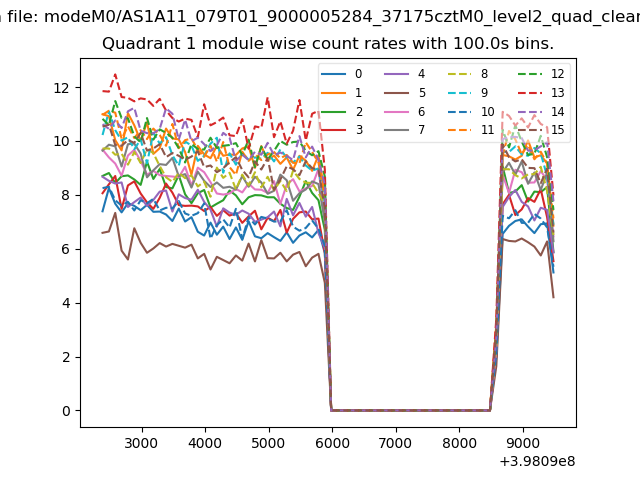
| Module-wise count rates for Quadrant A Data is divided into 100 sec bins |
 |
 |
| Module-wise count rates for Quadrant B Data is divided into 100 sec bins |
 |
 |
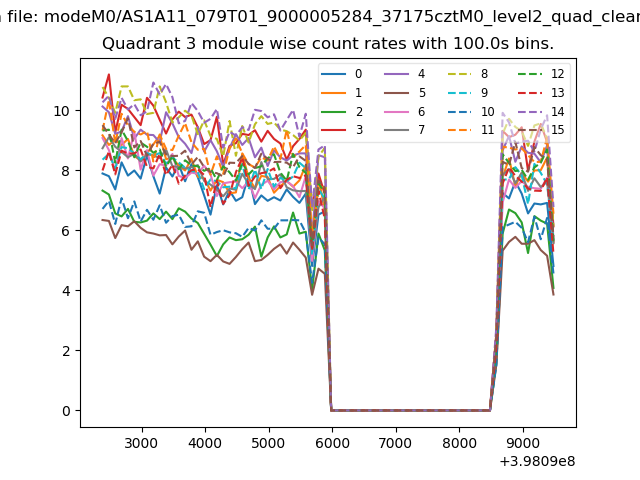
| Module-wise count rates for Quadrant C Data is divided into 100 sec bins |
 |
 |
| Module-wise count rates for Quadrant D Data is divided into 100 sec bins |
 |
 |
| Parameter | Plot |
|---|---|
| CZT HV Monitor |  |
| D_VDD | 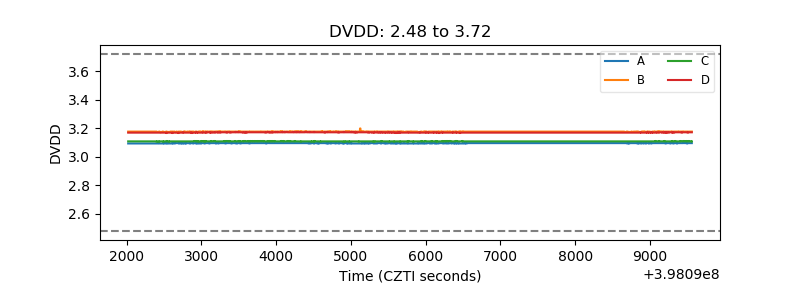 |
| Temperature 1 | 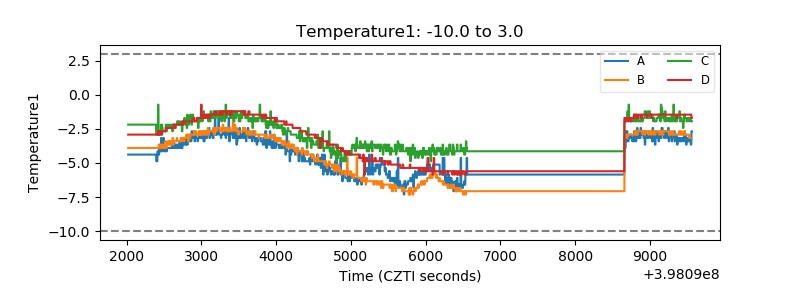 |
| Veto HV Monitor | 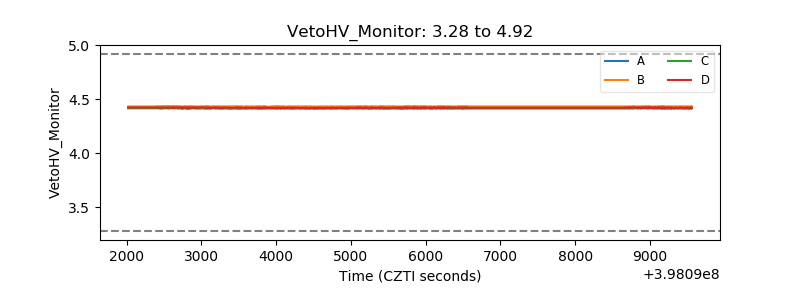 |
| Veto LLD | 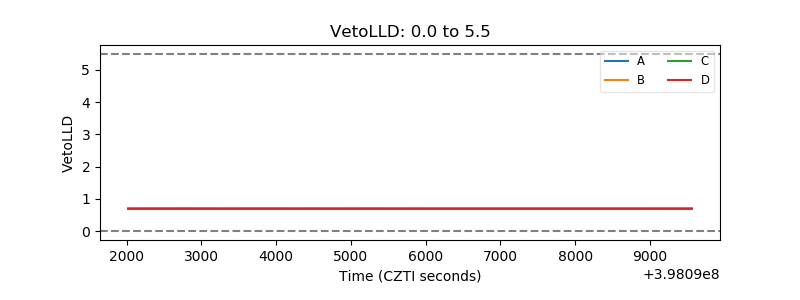 |
| Alpha Counter |  |
| _CPM_Rate | 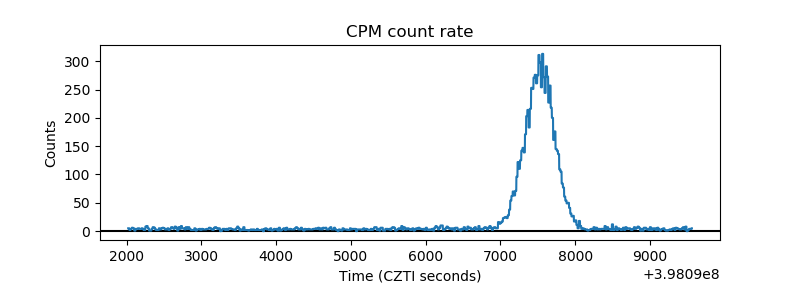 |
| CZT Counter |  |
| +2.5 Volts monitor |  |
| +5 Volts monitor |  |
| _ROLL_ROT | 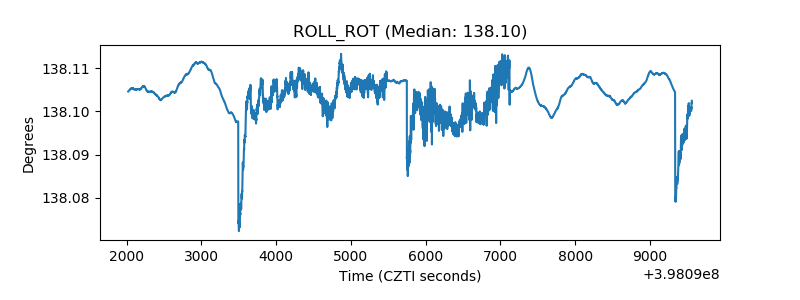 |
| _Roll_DEC | 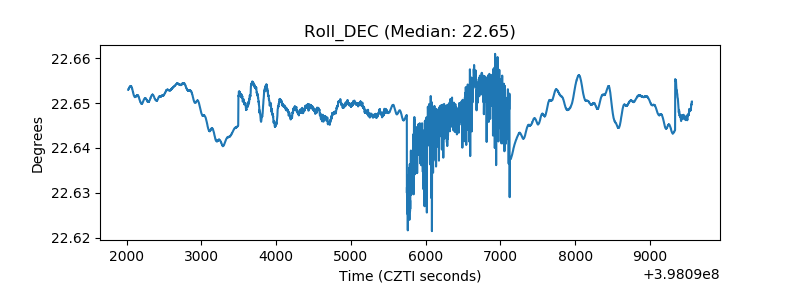 |
| _Roll_RA |  |
| Veto Counter | 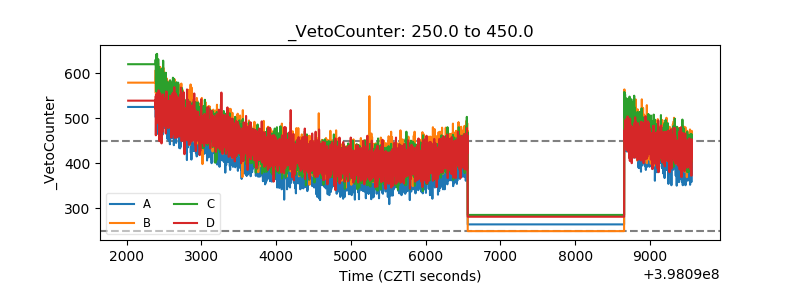 |