| Param | Original file | Final file |
|---|---|---|
| Filename | modeM0/AS1A11_079T01_9000005284_37176cztM0_level2.evt | modeM0/AS1A11_079T01_9000005284_37176cztM0_level2_quad_clean.evt |
| Size (bytes) | 432,097,920 | 80,294,400 |
| Size | 412.1 MB | 76.6 MB |
| Events in quadrant A | 2,809,843 | 525,312 |
| Events in quadrant B | 2,871,631 | 526,309 |
| Events in quadrant C | 3,232,384 | 517,304 |
| Events in quadrant D | 3,812,840 | 491,896 |
| Mode M9 | |||
|---|---|---|---|
| Quadrant | BADHDUFLAG | Total packets | Discarded packets |
| A | 0 | 34 | 0 |
| B | 0 | 34 | 0 |
| C | 0 | 34 | 0 |
| D | 0 | 35 | 0 |
| Mode SS | |||
|---|---|---|---|
| Quadrant | BADHDUFLAG | Total packets | Discarded packets |
| A | 0 | 106 | 0 |
| B | 0 | 106 | 0 |
| C | 0 | 106 | 0 |
| D | 0 | 106 | 0 |
| Mode M0 | |||
|---|---|---|---|
| Quadrant | BADHDUFLAG | Total packets | Discarded packets |
| A | 0 | 11700 | 3 |
| B | 0 | 12083 | 2 |
| C | 0 | 13096 | 2 |
| D | 0 | 14879 | 2 |
| Quadrant | Total seconds | Saturated seconds | Saturation percentage |
|---|---|---|---|
| A | 5299 | 48 | 0.905831% |
| B | 5299 | 15 | 0.283072% |
| C | 5299 | 74 | 1.396490% |
| D | 5299 | 288 | 5.434988% |
Noise dominated data is calculated using 1-second bins in cleaned event files. If a bin has >2000 counts, and if more than 50% of those come from <1% of pixels, then it is considered to be noise-dominated and hence unusable.
| Quadrant | # 1 sec bins | Bins with >0 counts | Bins with >2000 counts | High rate bins dominated by noise | Noise dominated (total time) | Noise dominated (detector-on time) | Marked lightcurve |
|---|---|---|---|---|---|---|---|
| A | 7152 | 5300 | 28 | 28 | 0.39% | 0.53% | 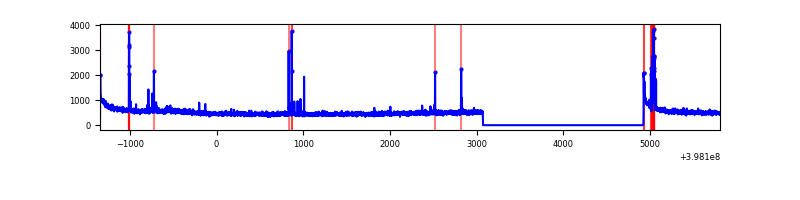 |
| B | 7152 | 5300 | 6 | 6 | 0.08% | 0.11% | 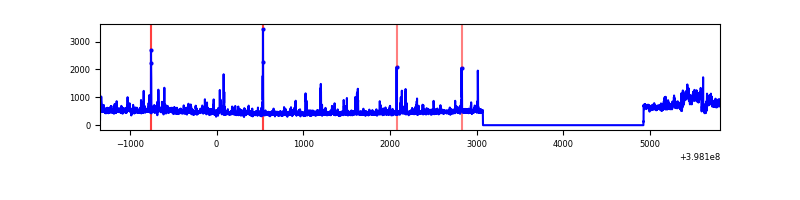 |
| C | 7152 | 5300 | 62 | 62 | 0.87% | 1.17% | 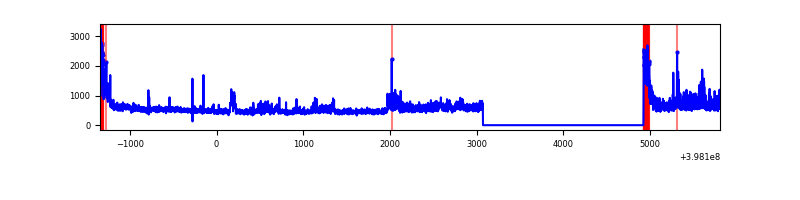 |
| D | 7152 | 5300 | 250 | 250 | 3.50% | 4.72% | 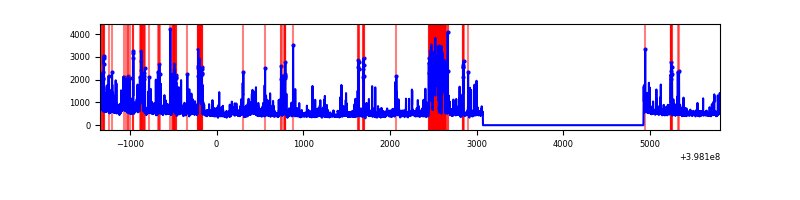 |
Top three noisy pixels from each quadrant. If the there are fewer than three noisy pixels in the level2.evt file, extra rows are filled as -1
| Pixel properties | Quadrant properties | ||||||
|---|---|---|---|---|---|---|---|
| Quadrant | DetID | PixID | Counts | Sigma | Mean | Median | Sigma |
| A | 10 | 83 | 257882 | 2071.29 | 613 | 601 | 124.2 |
| A | 9 | 143 | 127143 | 1018.75 | 613 | 601 | 124.2 |
| A | 8 | 144 | 42836 | 340.02 | 613 | 601 | 124.2 |
| B | 4 | 251 | 237797 | 2018.22 | 608 | 592 | 117.5 |
| B | 0 | 190 | 89486 | 756.34 | 608 | 592 | 117.5 |
| B | 5 | 172 | 50088 | 421.13 | 608 | 592 | 117.5 |
| C | 10 | 49 | 370371 | 2641.07 | 597 | 602 | 140.0 |
| C | 0 | 10 | 258118 | 1839.31 | 597 | 602 | 140.0 |
| C | 15 | 214 | 224787 | 1601.24 | 597 | 602 | 140.0 |
| D | 1 | 52 | 749652 | 5178.08 | 591 | 574 | 144.7 |
| D | 2 | 249 | 206329 | 1422.3 | 591 | 574 | 144.7 |
| D | 13 | 249 | 162366 | 1118.4 | 591 | 574 | 144.7 |
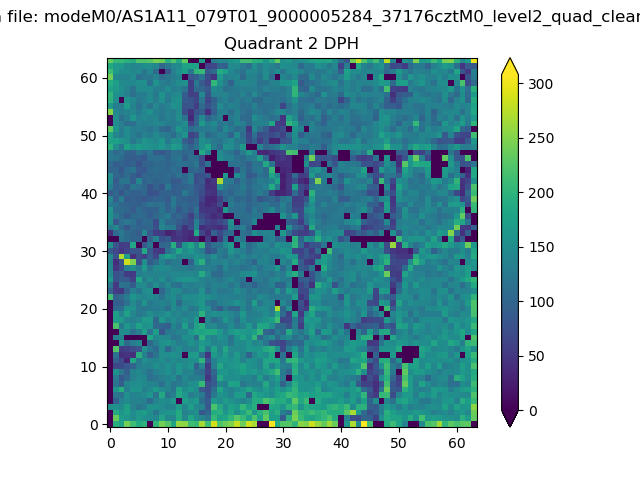
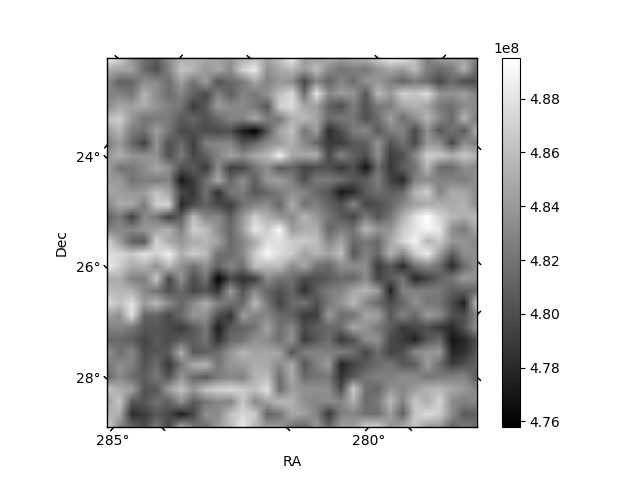
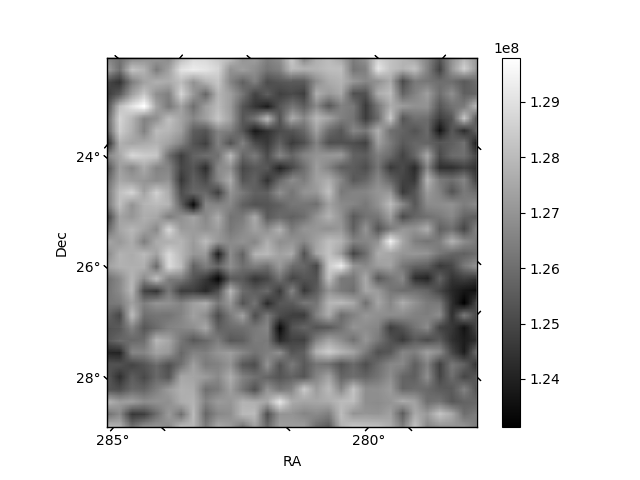
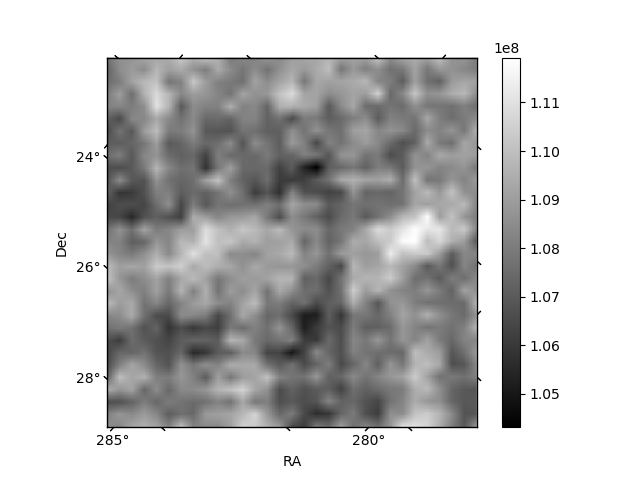
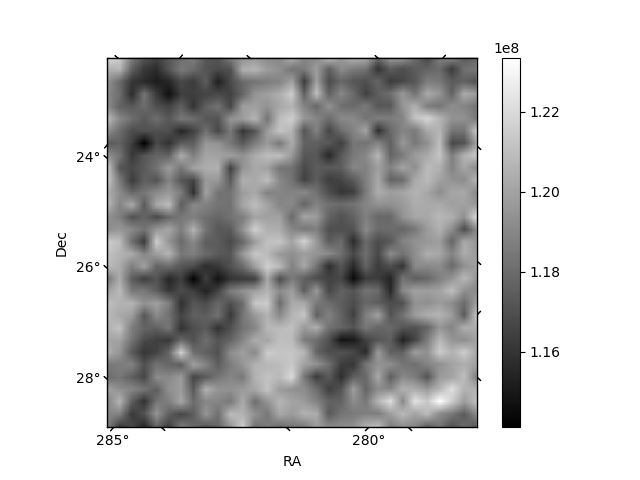
Histogram calculated using DETX and DETY for each event in the final _common_clean file
| Quadrant A | 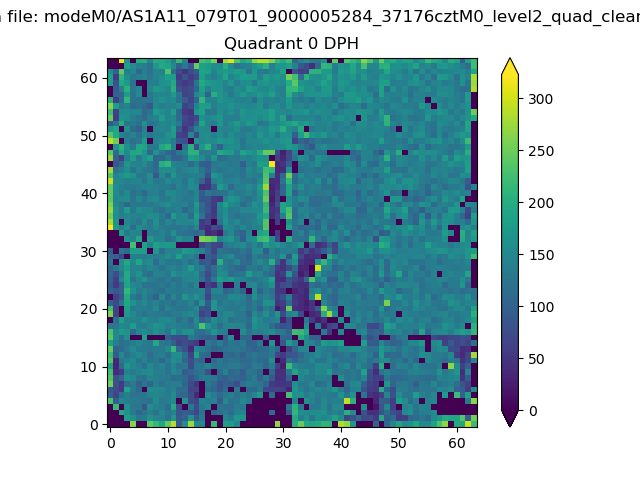 |
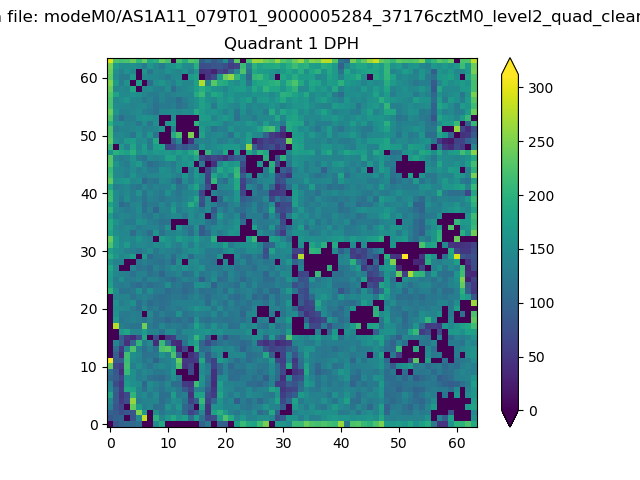 |
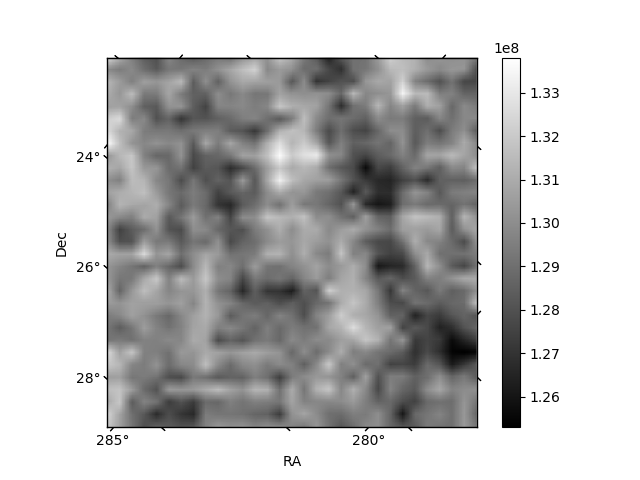
Quadrant B |
|---|---|---|---|
| Quadrant D | 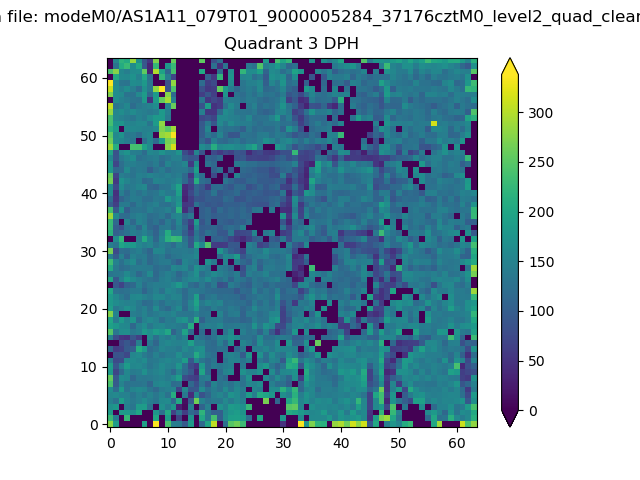 |
 |
Quadrant C |
| Plot type | Count rate plots | Images |
|---|---|---|
| Comparison with Poisson distribution Blue bars denote a histogram of data divided into 1 sec bins. Red curve is a Poisson curve with rate = median count rate of data. |
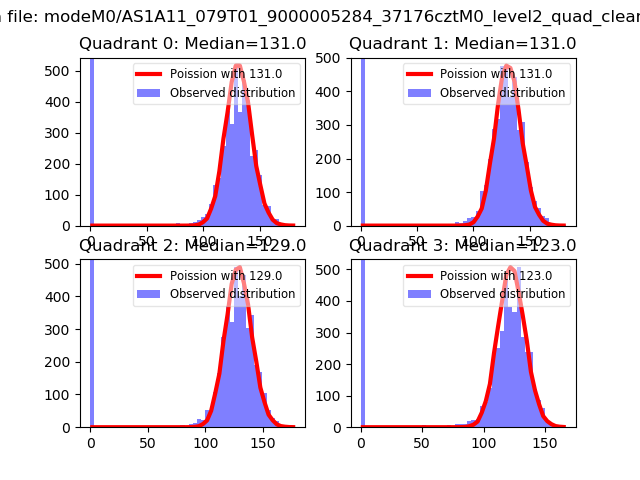 |
 |
| Quadrant-wise count rates Data is divided into 100 sec bins |
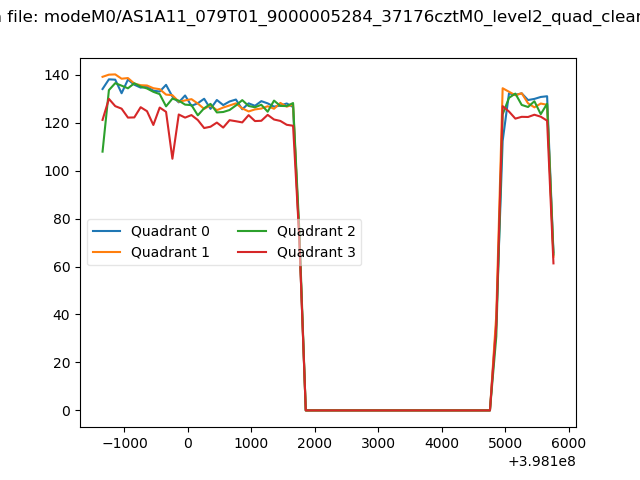 |
|
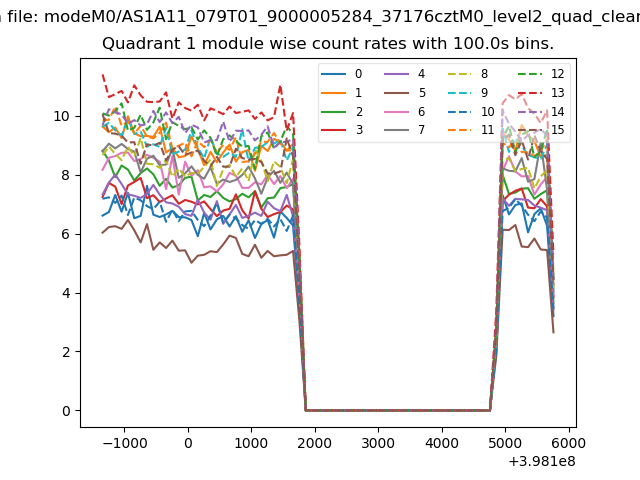
| Module-wise count rates for Quadrant A Data is divided into 100 sec bins |
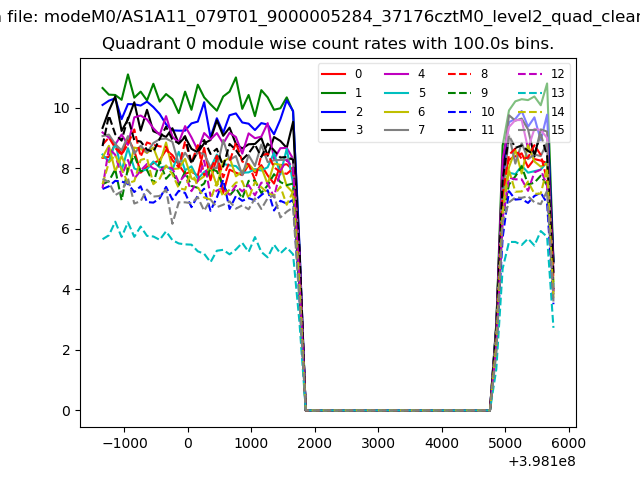 |
 |
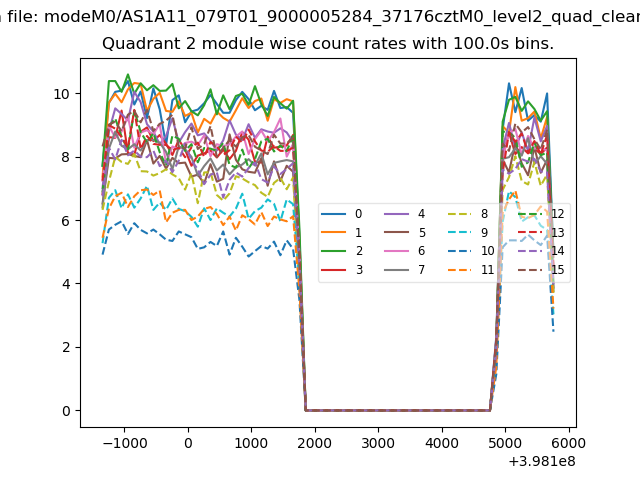
| Module-wise count rates for Quadrant B Data is divided into 100 sec bins |
 |
 |
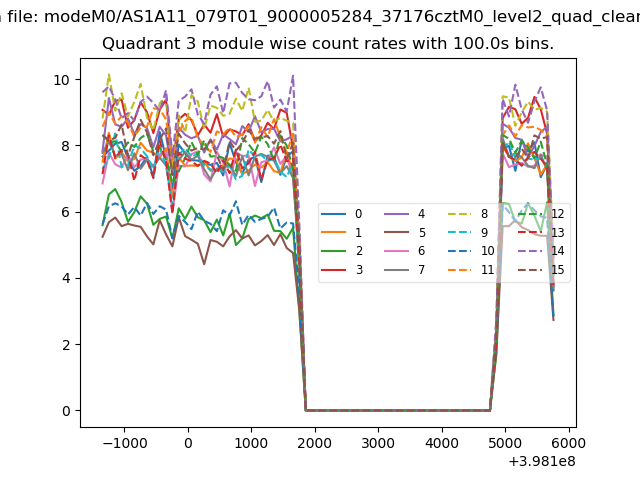
| Module-wise count rates for Quadrant C Data is divided into 100 sec bins |
 |
 |
| Module-wise count rates for Quadrant D Data is divided into 100 sec bins |
 |
 |
| Parameter | Plot |
|---|---|
| CZT HV Monitor | 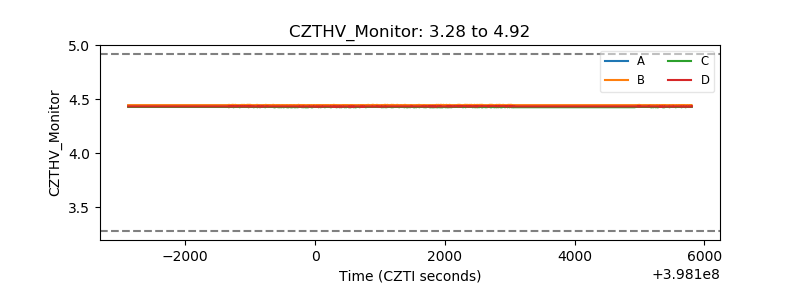 |
| D_VDD | 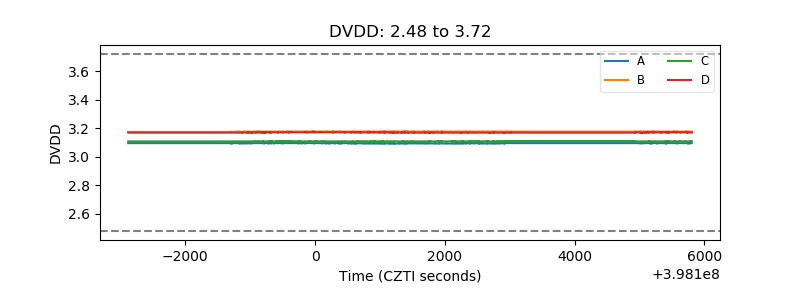 |
| Temperature 1 | 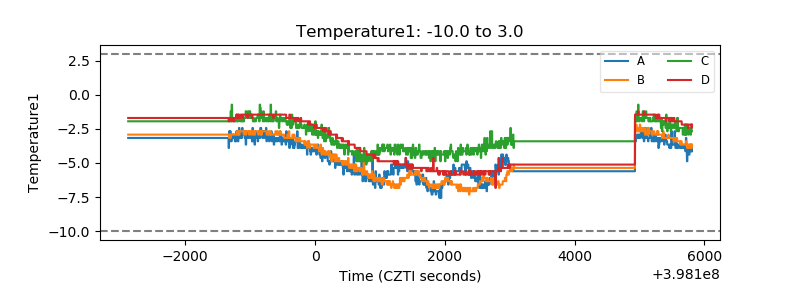 |
| Veto HV Monitor |  |
| Veto LLD | 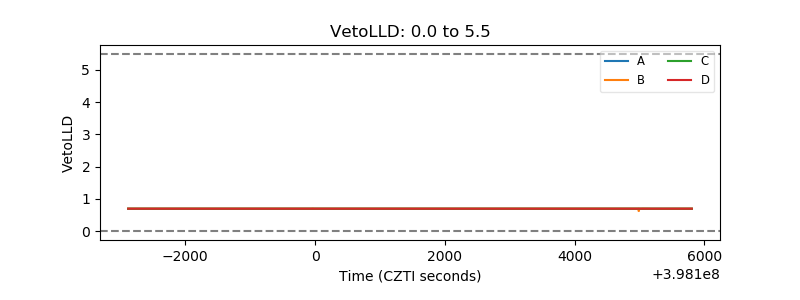 |
| Alpha Counter | 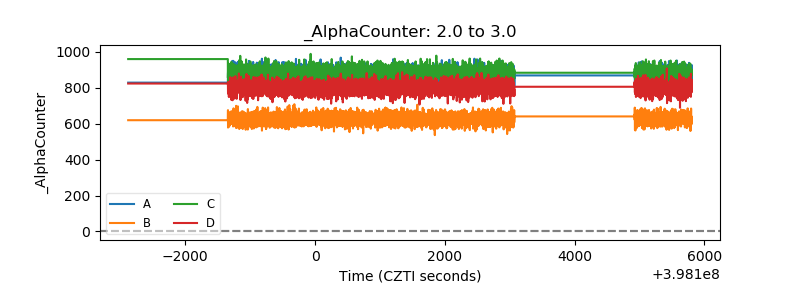 |
| _CPM_Rate | 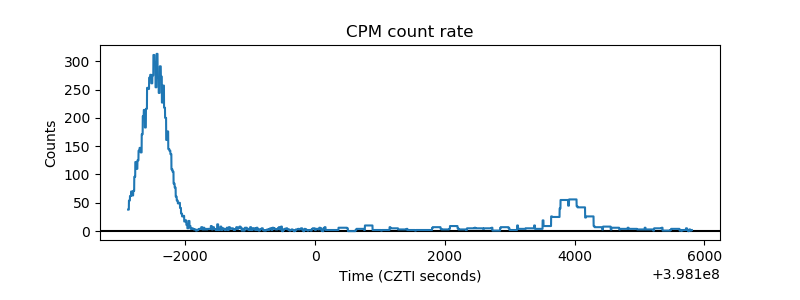 |
| CZT Counter | 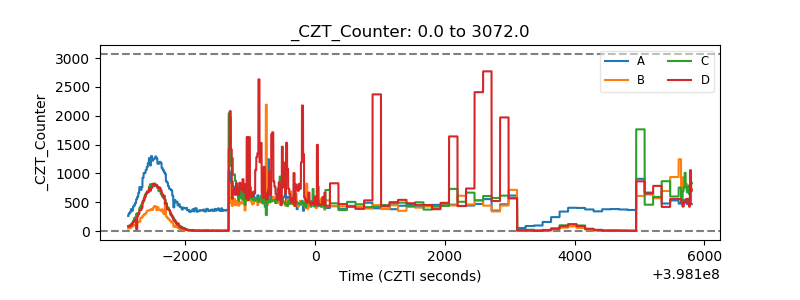 |
| +2.5 Volts monitor | 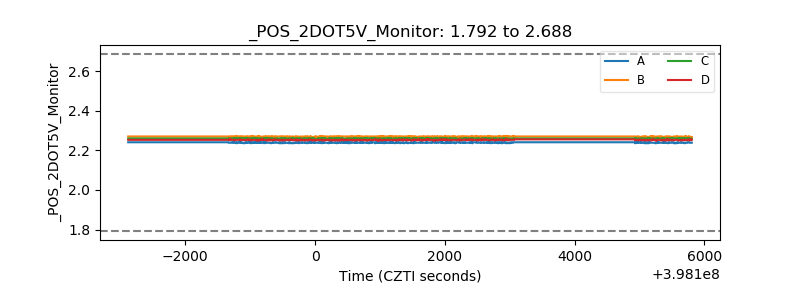 |
| +5 Volts monitor | 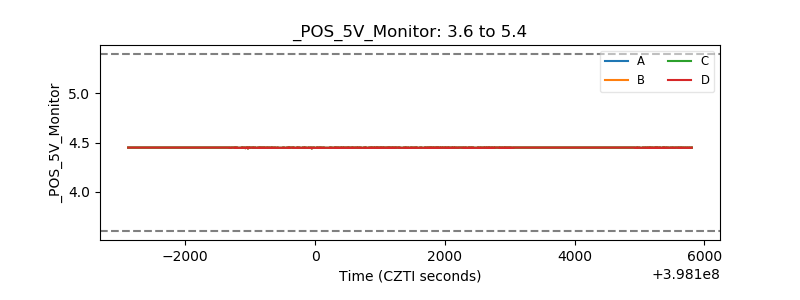 |
| _ROLL_ROT | 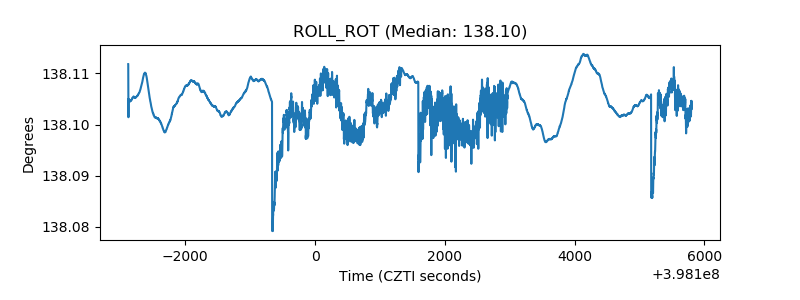 |
| _Roll_DEC | 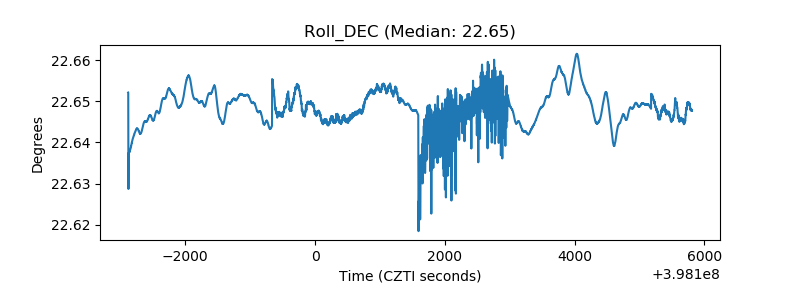 |
| _Roll_RA | 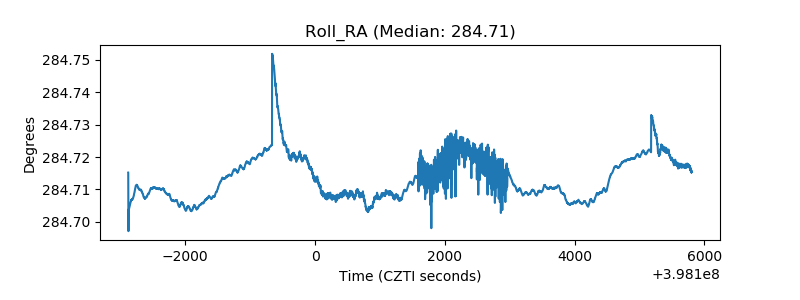 |
| Veto Counter | 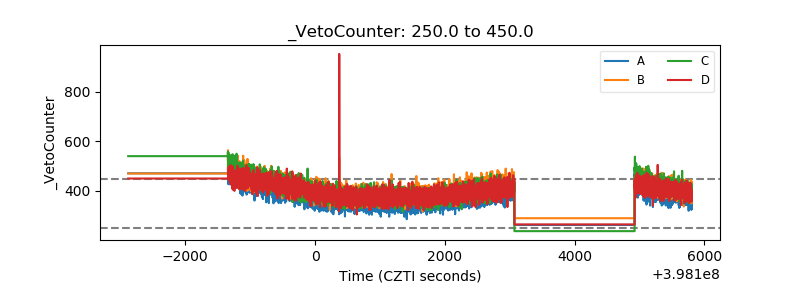 |