| Param | Original file | Final file |
|---|---|---|
| Filename | modeM0/AS1A11_079T01_9000005284_37179cztM0_level2.evt | modeM0/AS1A11_079T01_9000005284_37179cztM0_level2_quad_clean.evt |
| Size (bytes) | 460,661,760 | 73,512,000 |
| Size | 439.3 MB | 70.1 MB |
| Events in quadrant A | 3,110,097 | 462,504 |
| Events in quadrant B | 3,000,636 | 463,902 |
| Events in quadrant C | 3,046,839 | 461,106 |
| Events in quadrant D | 4,389,395 | 422,573 |
| Mode M9 | |||
|---|---|---|---|
| Quadrant | BADHDUFLAG | Total packets | Discarded packets |
| A | 0 | 25 | 0 |
| B | 0 | 25 | 0 |
| C | 0 | 25 | 0 |
| D | 0 | 25 | 0 |
| Mode SS | |||
|---|---|---|---|
| Quadrant | BADHDUFLAG | Total packets | Discarded packets |
| A | 0 | 120 | 0 |
| B | 0 | 120 | 0 |
| C | 0 | 120 | 0 |
| D | 0 | 120 | 0 |
| Mode M0 | |||
|---|---|---|---|
| Quadrant | BADHDUFLAG | Total packets | Discarded packets |
| A | 0 | 13146 | 3 |
| B | 0 | 12902 | 2 |
| C | 0 | 12787 | 2 |
| D | 0 | 17312 | 2 |
| Quadrant | Total seconds | Saturated seconds | Saturation percentage |
|---|---|---|---|
| A | 5954 | 57 | 0.957340% |
| B | 5954 | 63 | 1.058112% |
| C | 5954 | 43 | 0.722204% |
| D | 5954 | 430 | 7.222036% |
Noise dominated data is calculated using 1-second bins in cleaned event files. If a bin has >2000 counts, and if more than 50% of those come from <1% of pixels, then it is considered to be noise-dominated and hence unusable.
| Quadrant | # 1 sec bins | Bins with >0 counts | Bins with >2000 counts | High rate bins dominated by noise | Noise dominated (total time) | Noise dominated (detector-on time) | Marked lightcurve |
|---|---|---|---|---|---|---|---|
| A | 7236 | 5955 | 49 | 49 | 0.68% | 0.82% | 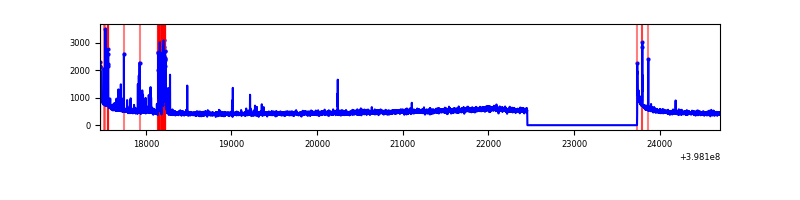 |
| B | 7236 | 5955 | 47 | 47 | 0.65% | 0.79% | 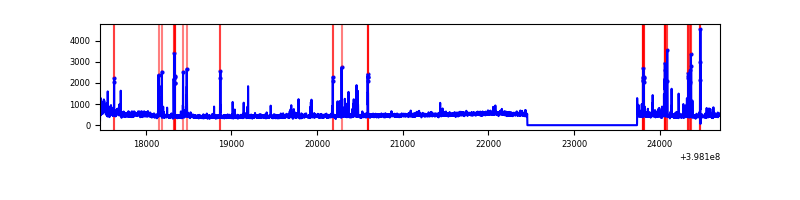 |
| C | 7236 | 5955 | 40 | 40 | 0.55% | 0.67% | 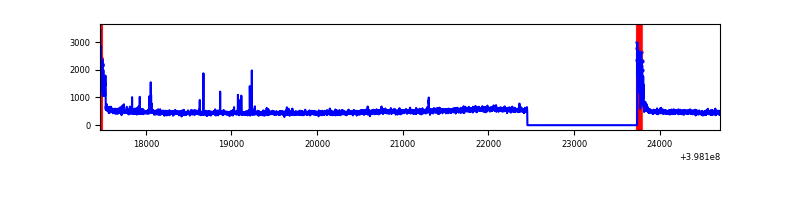 |
| D | 7236 | 5955 | 345 | 345 | 4.77% | 5.79% | 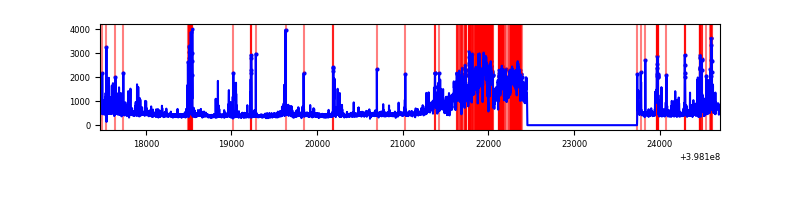 |
Top three noisy pixels from each quadrant. If the there are fewer than three noisy pixels in the level2.evt file, extra rows are filled as -1
| Pixel properties | Quadrant properties | ||||||
|---|---|---|---|---|---|---|---|
| Quadrant | DetID | PixID | Counts | Sigma | Mean | Median | Sigma |
| A | 10 | 83 | 274211 | 1990.68 | 673 | 660 | 137.4 |
| A | 9 | 143 | 167863 | 1216.76 | 673 | 660 | 137.4 |
| A | 15 | 237 | 34712 | 247.8 | 673 | 660 | 137.4 |
| B | 5 | 172 | 207620 | 1613.29 | 664 | 647 | 128.3 |
| B | 0 | 190 | 42335 | 324.94 | 664 | 647 | 128.3 |
| B | 4 | 81 | 22403 | 169.58 | 664 | 647 | 128.3 |
| C | 15 | 214 | 254352 | 1641.92 | 655 | 660 | 154.5 |
| C | 0 | 10 | 192989 | 1244.77 | 655 | 660 | 154.5 |
| C | 14 | 254 | 32358 | 205.15 | 655 | 660 | 154.5 |
| D | 10 | 253 | 1142515 | 7316.47 | 640 | 622 | 156.1 |
| D | 1 | 52 | 419477 | 2683.74 | 640 | 622 | 156.1 |
| D | 2 | 249 | 158301 | 1010.3 | 640 | 622 | 156.1 |
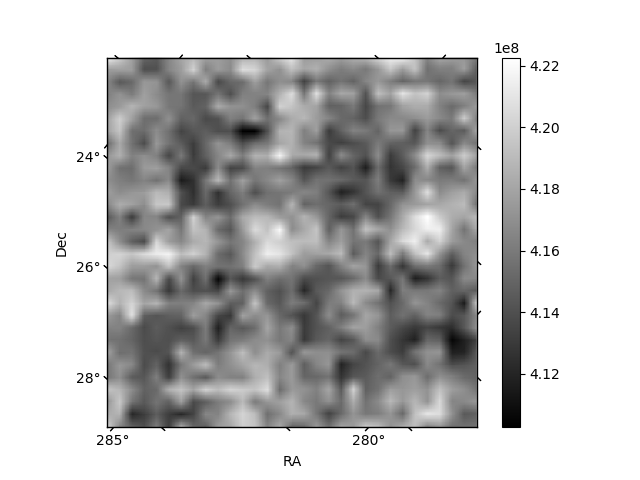
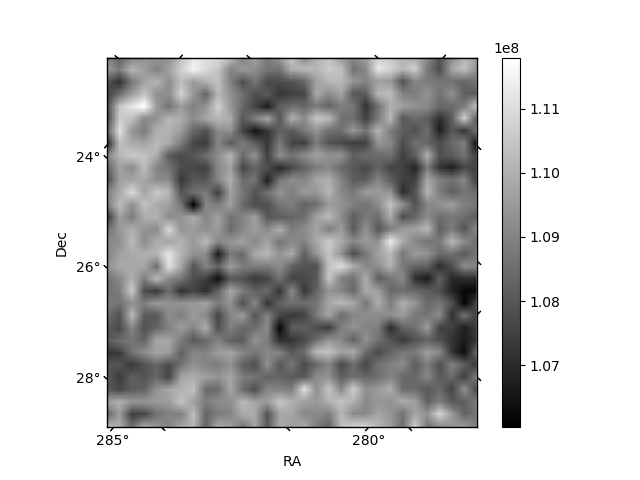
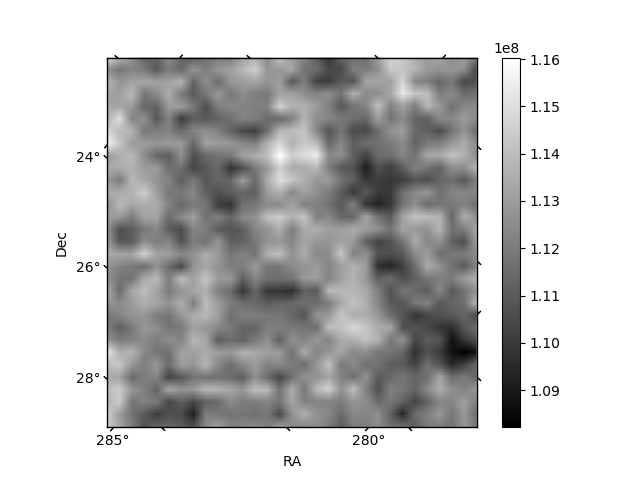
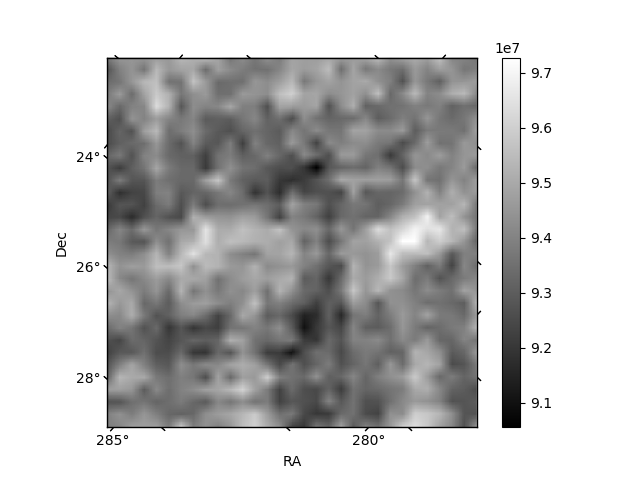
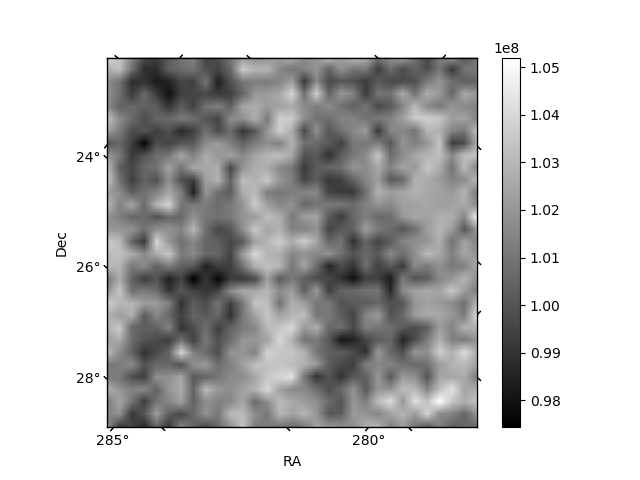
Histogram calculated using DETX and DETY for each event in the final _common_clean file
| Quadrant A | 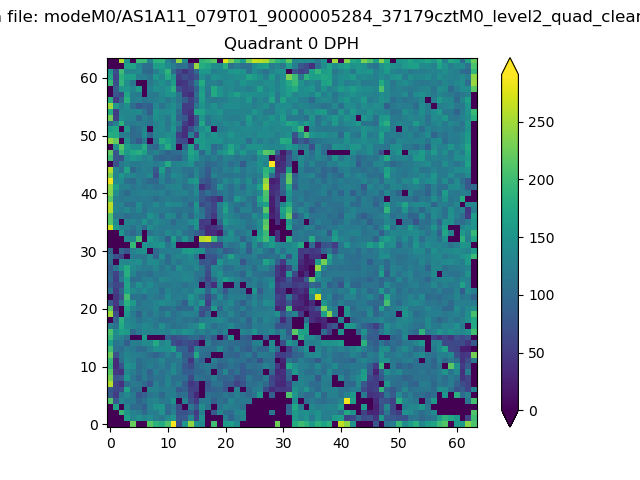 |
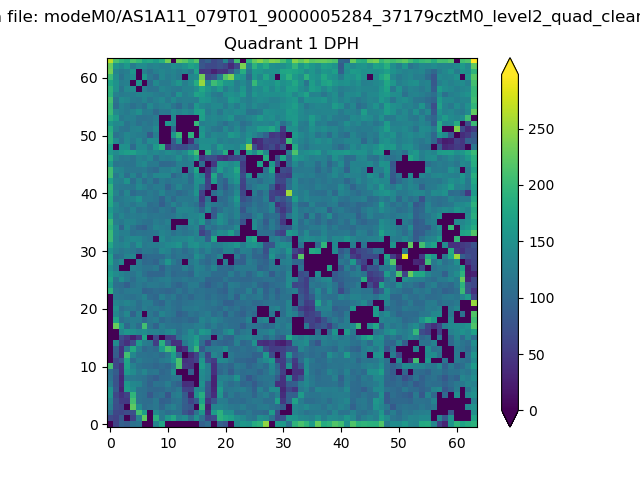 |
Quadrant B |
|---|---|---|---|
| Quadrant D | 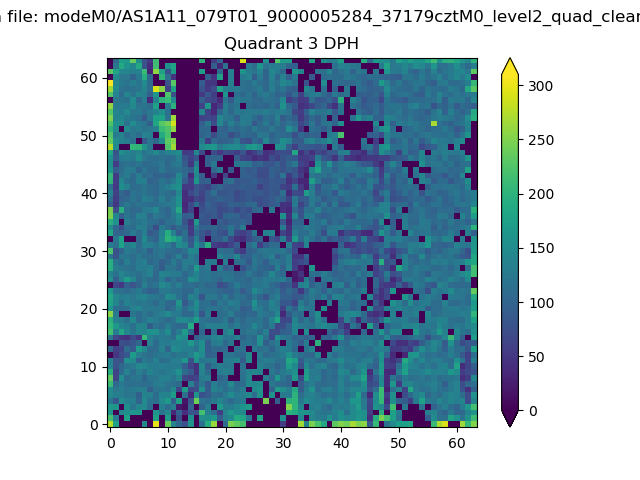 |
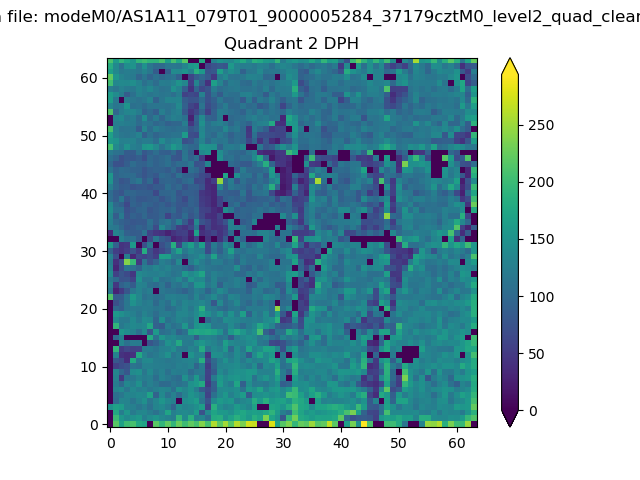 |
Quadrant C |
| Plot type | Count rate plots | Images |
|---|---|---|
| Comparison with Poisson distribution Blue bars denote a histogram of data divided into 1 sec bins. Red curve is a Poisson curve with rate = median count rate of data. |
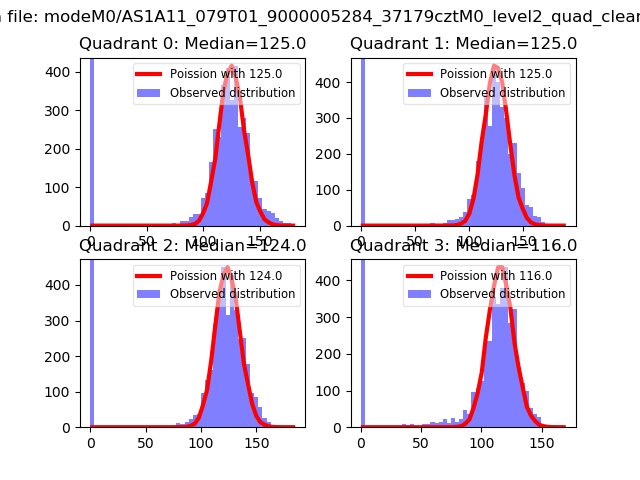 |
 |
| Quadrant-wise count rates Data is divided into 100 sec bins |
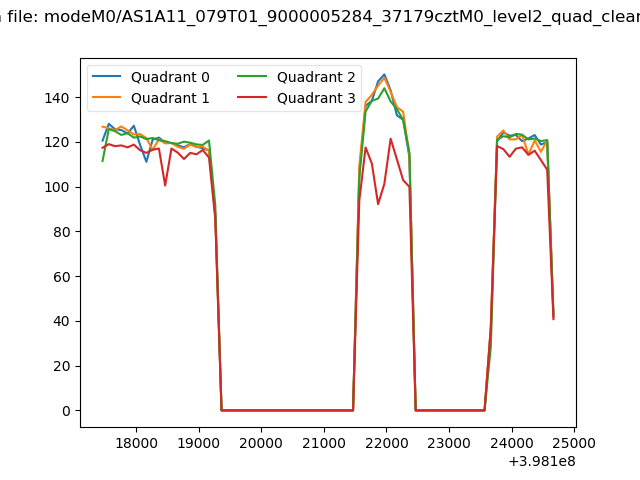 |
|
| Module-wise count rates for Quadrant A Data is divided into 100 sec bins |
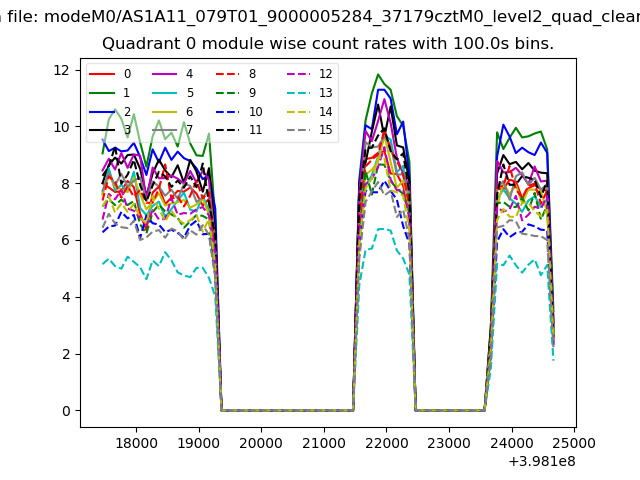 |
 |
| Module-wise count rates for Quadrant B Data is divided into 100 sec bins |
 |
 |
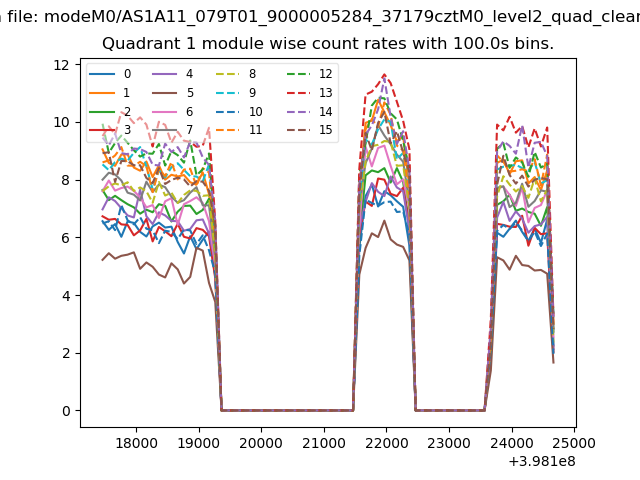
| Module-wise count rates for Quadrant C Data is divided into 100 sec bins |
 |
 |
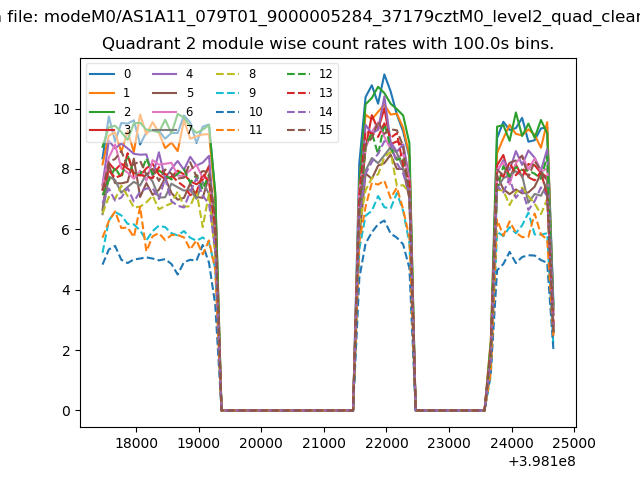
| Module-wise count rates for Quadrant D Data is divided into 100 sec bins |
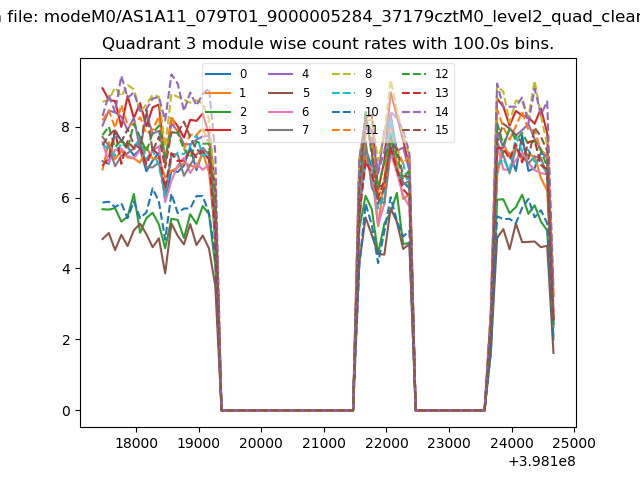 |
 |
| Parameter | Plot |
|---|---|
| CZT HV Monitor | 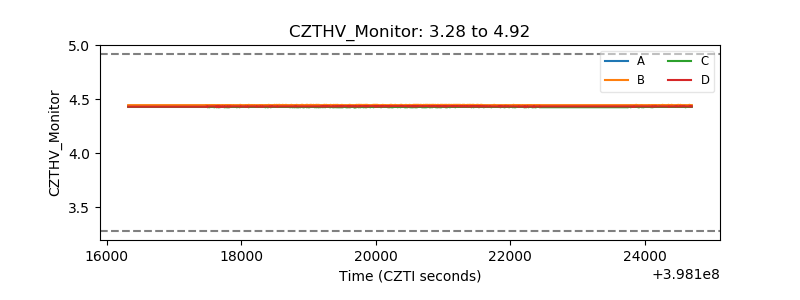 |
| D_VDD | 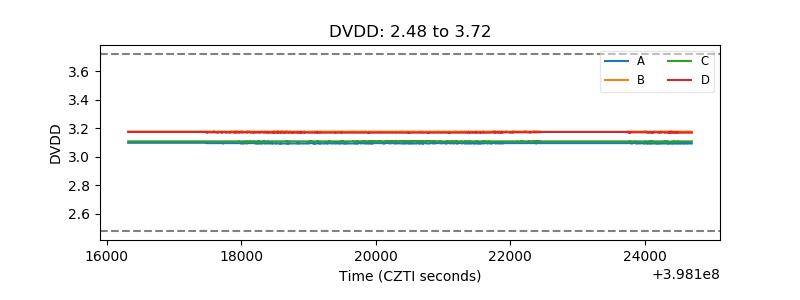 |
| Temperature 1 | 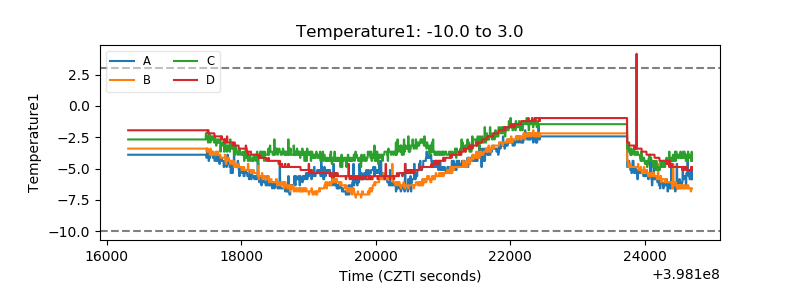 |
| Veto HV Monitor | 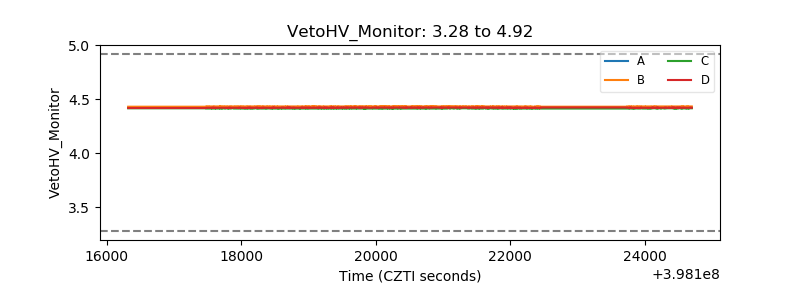 |
| Veto LLD | 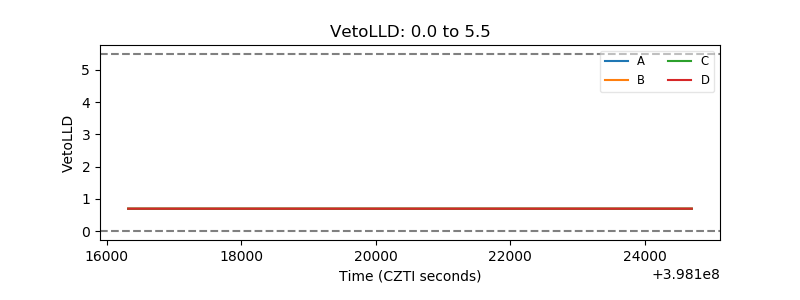 |
| Alpha Counter |  |
| _CPM_Rate | 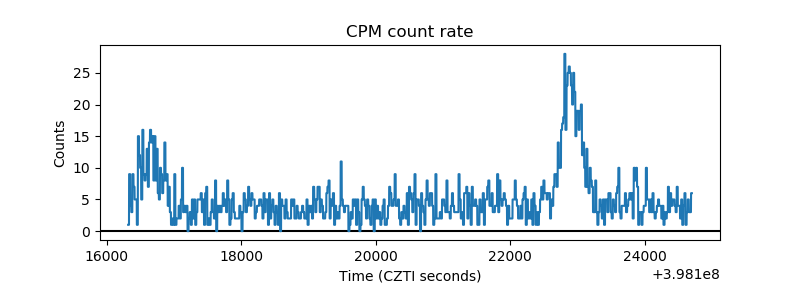 |
| CZT Counter | 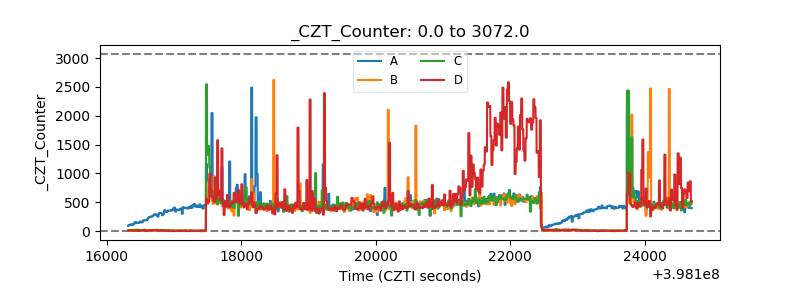 |
| +2.5 Volts monitor | 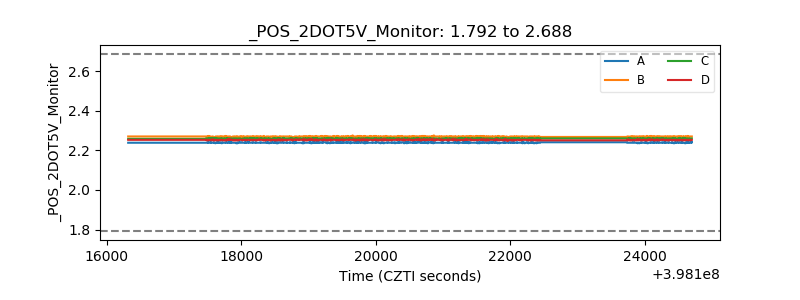 |
| +5 Volts monitor |  |
| _ROLL_ROT | 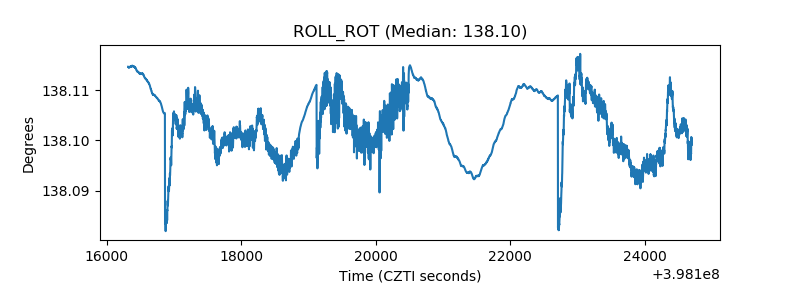 |
| _Roll_DEC | 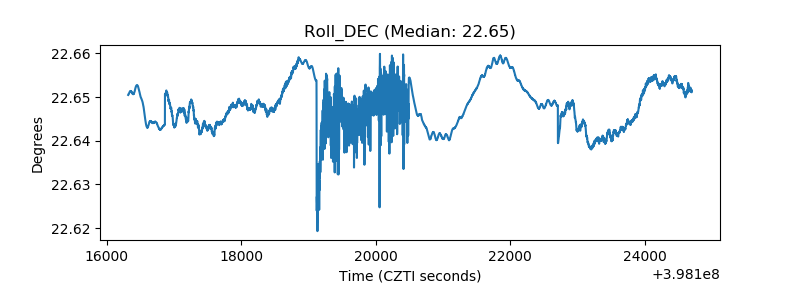 |
| _Roll_RA | 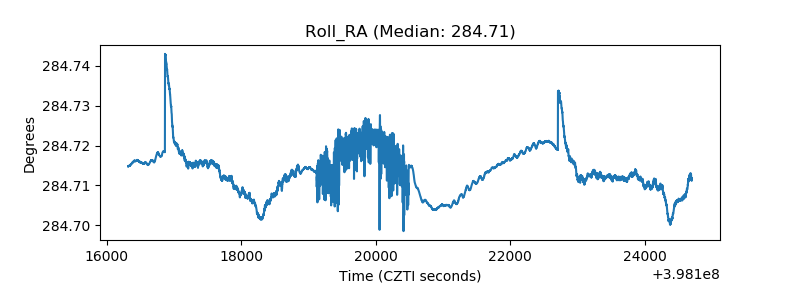 |
| Veto Counter | 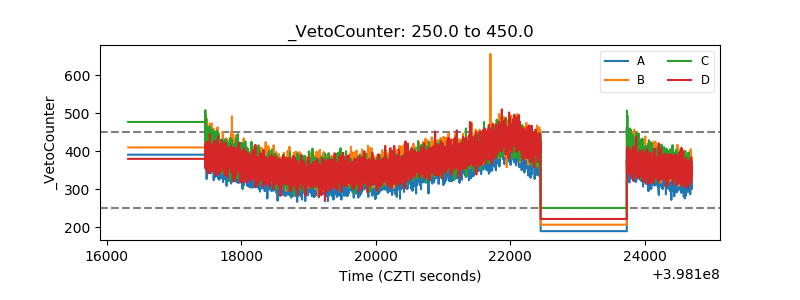 |