| Param | Original file | Final file |
|---|---|---|
| Filename | modeM0/AS1A11_079T01_9000005284_37181cztM0_level2.evt | modeM0/AS1A11_079T01_9000005284_37181cztM0_level2_quad_clean.evt |
| Size (bytes) | 878,431,680 | 120,395,520 |
| Size | 837.7 MB | 114.8 MB |
| Events in quadrant A | 5,369,843 | 740,855 |
| Events in quadrant B | 5,663,225 | 744,827 |
| Events in quadrant C | 5,836,421 | 741,631 |
| Events in quadrant D | 9,005,243 | 672,261 |
| Mode M9 | |||
|---|---|---|---|
| Quadrant | BADHDUFLAG | Total packets | Discarded packets |
| A | 0 | 39 | 0 |
| B | 0 | 39 | 0 |
| C | 0 | 39 | 0 |
| D | 0 | 39 | 0 |
| Mode SS | |||
|---|---|---|---|
| Quadrant | BADHDUFLAG | Total packets | Discarded packets |
| A | 0 | 220 | 0 |
| B | 0 | 220 | 0 |
| C | 0 | 220 | 0 |
| D | 0 | 220 | 0 |
| Mode M0 | |||
|---|---|---|---|
| Quadrant | BADHDUFLAG | Total packets | Discarded packets |
| A | 0 | 22867 | 4 |
| B | 0 | 24084 | 3 |
| C | 0 | 24023 | 3 |
| D | 0 | 34331 | 3 |
| Quadrant | Total seconds | Saturated seconds | Saturation percentage |
|---|---|---|---|
| A | 10776 | 57 | 0.528953% |
| B | 10776 | 182 | 1.688938% |
| C | 10776 | 176 | 1.633259% |
| D | 10776 | 887 | 8.231255% |
Noise dominated data is calculated using 1-second bins in cleaned event files. If a bin has >2000 counts, and if more than 50% of those come from <1% of pixels, then it is considered to be noise-dominated and hence unusable.
| Quadrant | # 1 sec bins | Bins with >0 counts | Bins with >2000 counts | High rate bins dominated by noise | Noise dominated (total time) | Noise dominated (detector-on time) | Marked lightcurve |
|---|---|---|---|---|---|---|---|
| A | 13552 | 10778 | 30 | 30 | 0.22% | 0.28% | 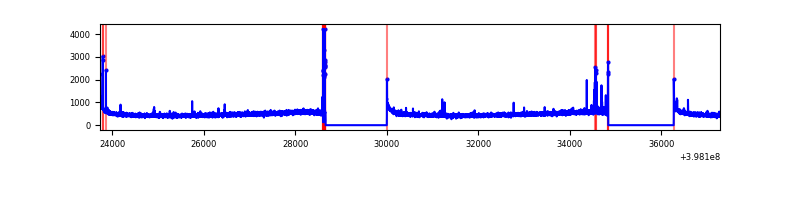 |
| B | 13552 | 10778 | 121 | 121 | 0.89% | 1.12% | 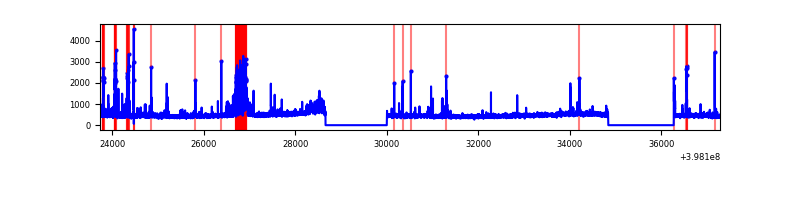 |
| C | 13552 | 10778 | 157 | 157 | 1.16% | 1.46% | 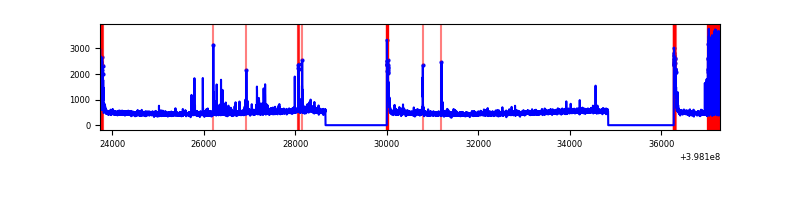 |
| D | 13552 | 10778 | 765 | 765 | 5.64% | 7.10% | 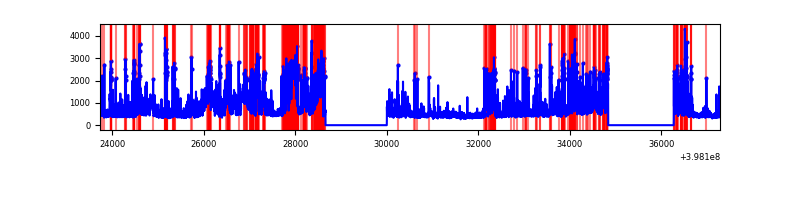 |
Top three noisy pixels from each quadrant. If the there are fewer than three noisy pixels in the level2.evt file, extra rows are filled as -1
| Pixel properties | Quadrant properties | ||||||
|---|---|---|---|---|---|---|---|
| Quadrant | DetID | PixID | Counts | Sigma | Mean | Median | Sigma |
| A | 10 | 83 | 453105 | 1826.48 | 1227 | 1201 | 247.4 |
| A | 15 | 237 | 86062 | 342.99 | 1227 | 1201 | 247.4 |
| A | 13 | 248 | 36715 | 143.54 | 1227 | 1201 | 247.4 |
| B | 5 | 184 | 410526 | 1746.24 | 1213 | 1178 | 234.4 |
| B | 5 | 172 | 212520 | 901.56 | 1213 | 1178 | 234.4 |
| B | 0 | 190 | 112719 | 475.82 | 1213 | 1178 | 234.4 |
| C | 15 | 214 | 456166 | 1637.34 | 1190 | 1201 | 277.9 |
| C | 1 | 23 | 302759 | 1085.26 | 1190 | 1201 | 277.9 |
| C | 0 | 10 | 266691 | 955.45 | 1190 | 1201 | 277.9 |
| D | 10 | 253 | 1994559 | 7069.89 | 1159 | 1127 | 282.0 |
| D | 1 | 52 | 1623653 | 5754.44 | 1159 | 1127 | 282.0 |
| D | 2 | 249 | 328675 | 1161.68 | 1159 | 1127 | 282.0 |
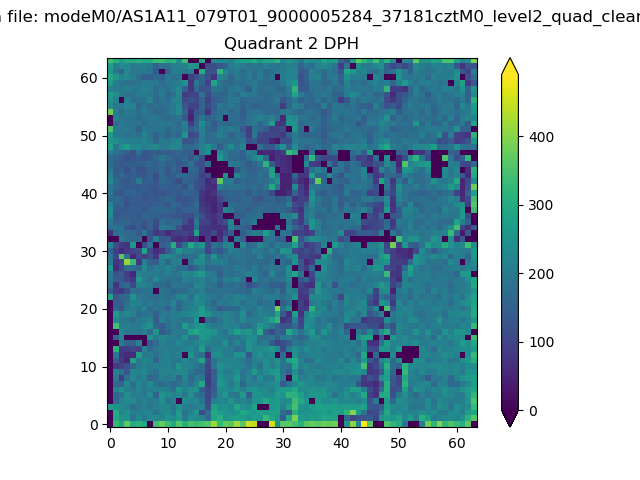
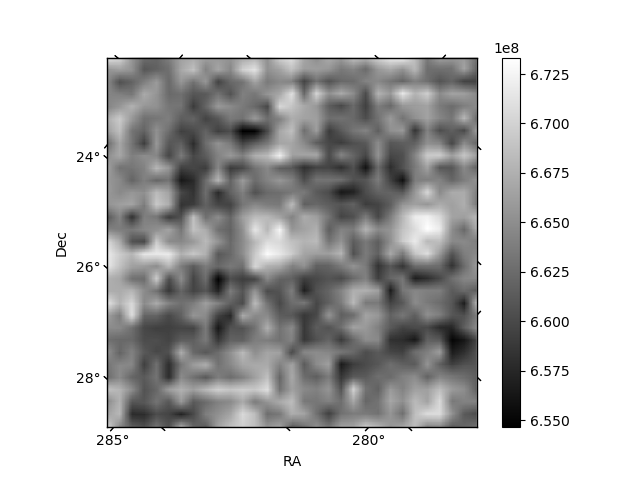
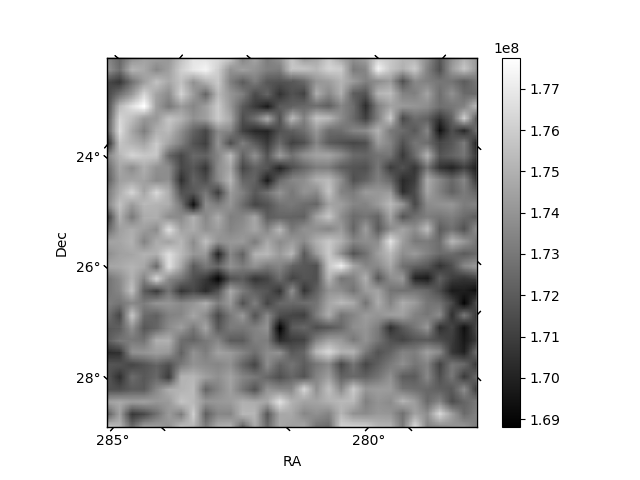
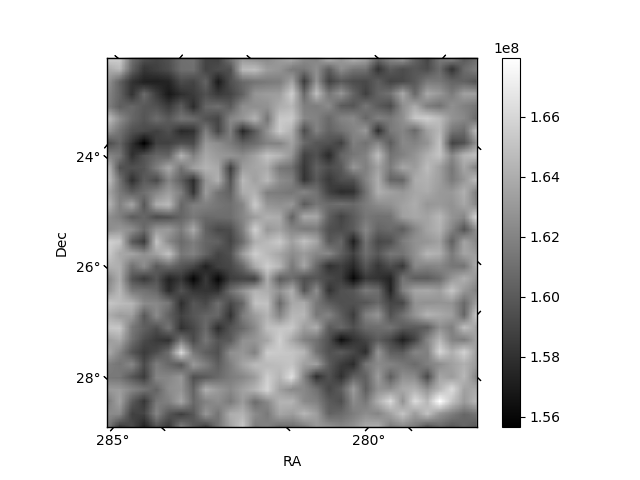
Histogram calculated using DETX and DETY for each event in the final _common_clean file
| Quadrant A | 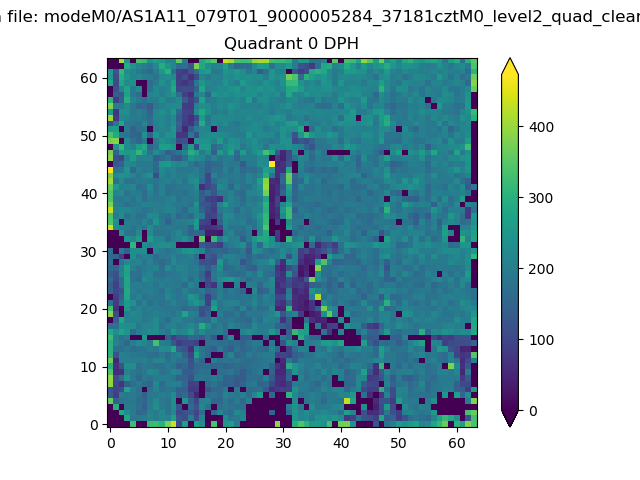 |
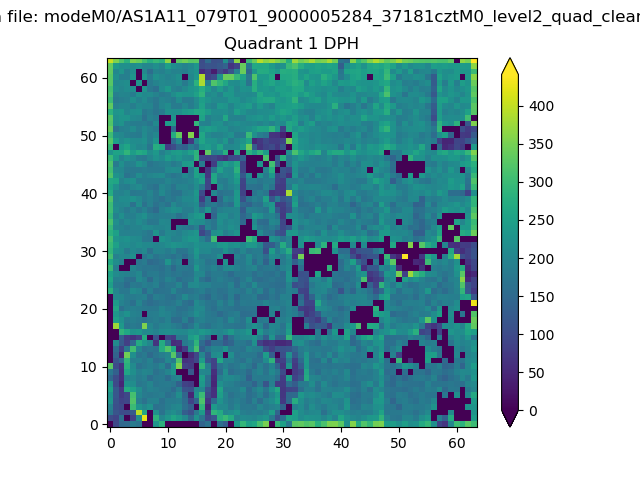 |
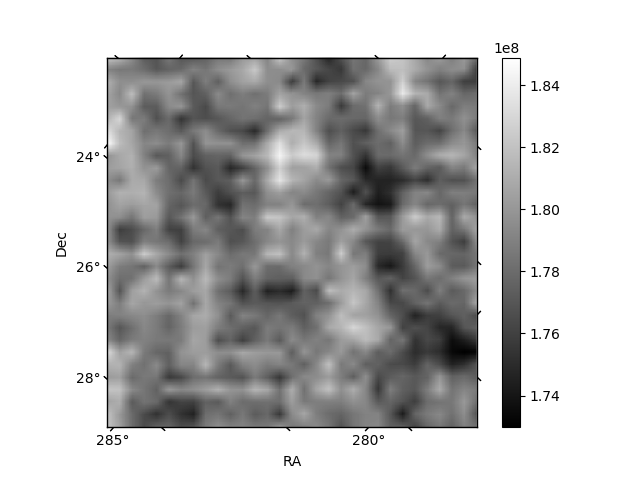
Quadrant B |
|---|---|---|---|
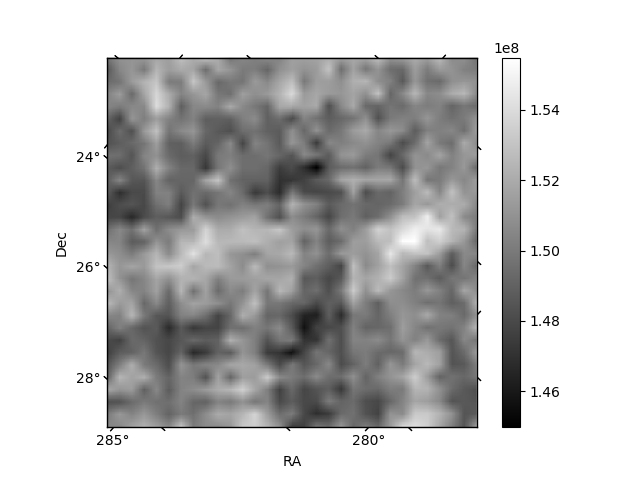
| Quadrant D | 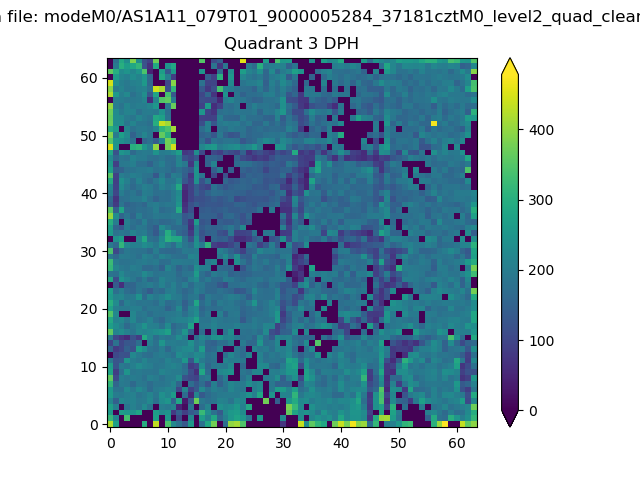 |
 |
Quadrant C |
| Plot type | Count rate plots | Images |
|---|---|---|
| Comparison with Poisson distribution Blue bars denote a histogram of data divided into 1 sec bins. Red curve is a Poisson curve with rate = median count rate of data. |
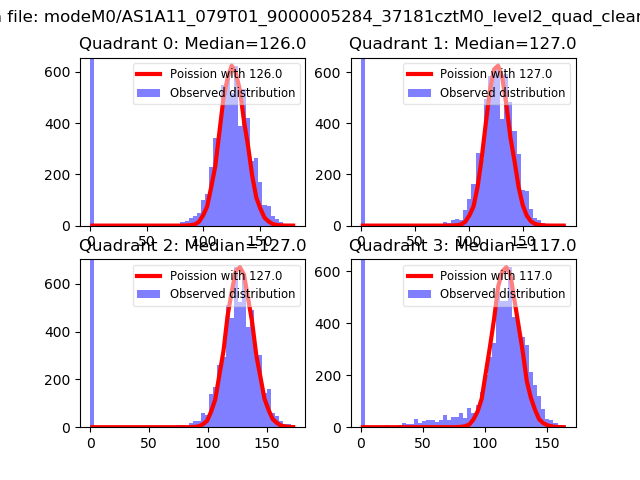 |
 |
| Quadrant-wise count rates Data is divided into 100 sec bins |
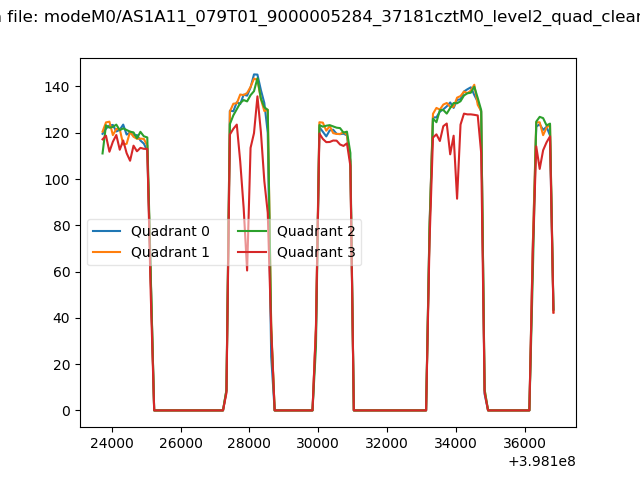 |
|
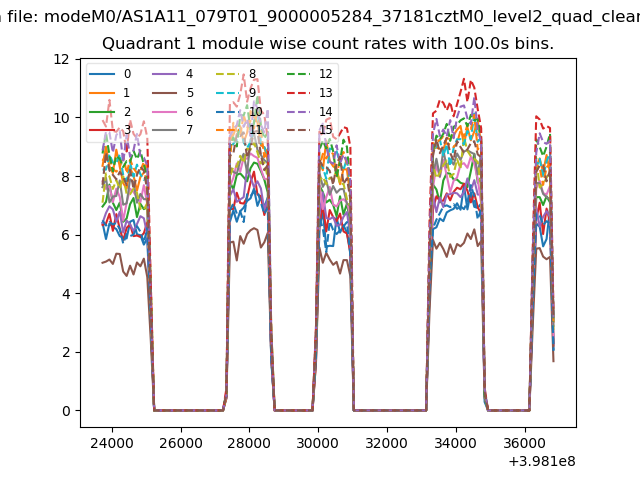
| Module-wise count rates for Quadrant A Data is divided into 100 sec bins |
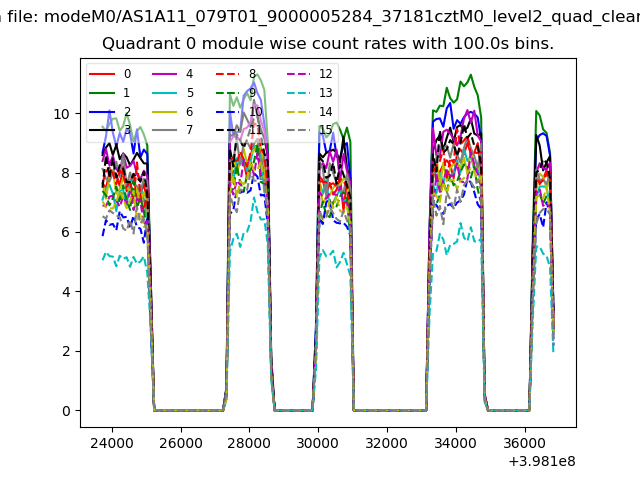 |
 |
| Module-wise count rates for Quadrant B Data is divided into 100 sec bins |
 |
 |
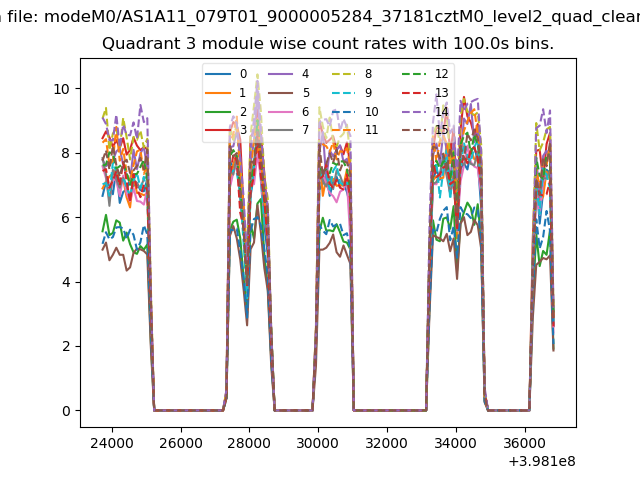
| Module-wise count rates for Quadrant C Data is divided into 100 sec bins |
 |
 |
| Module-wise count rates for Quadrant D Data is divided into 100 sec bins |
 |
 |
| Parameter | Plot |
|---|---|
| CZT HV Monitor | 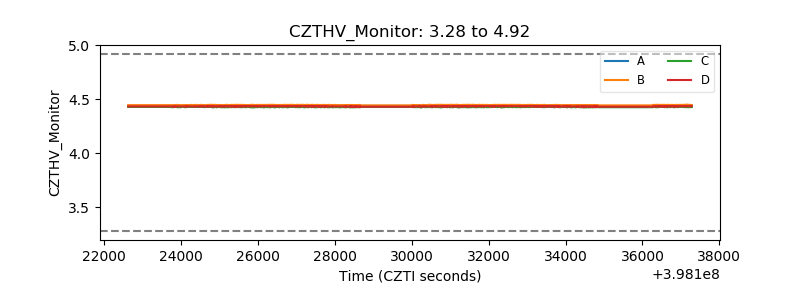 |
| D_VDD | 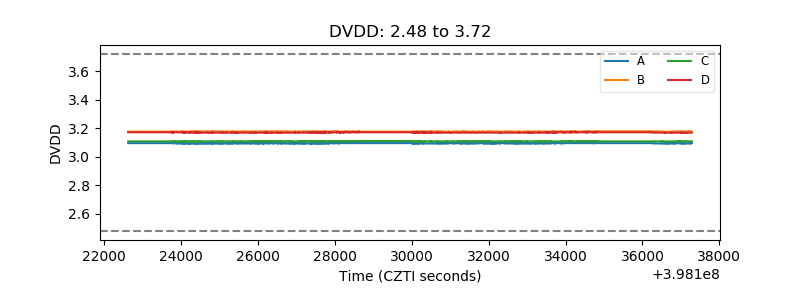 |
| Temperature 1 | 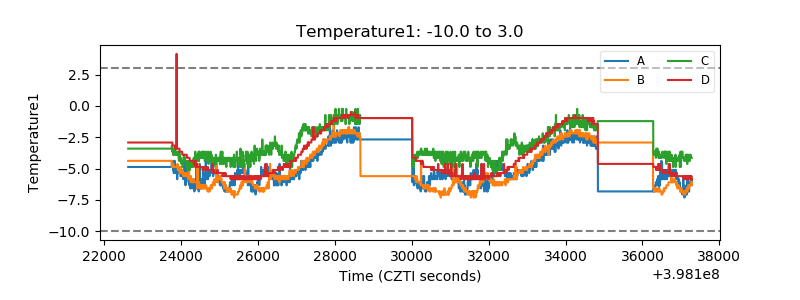 |
| Veto HV Monitor | 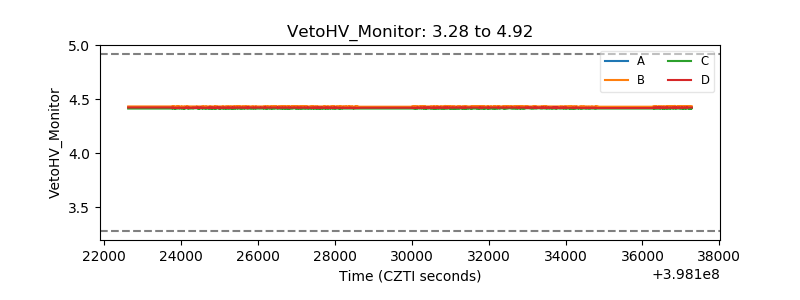 |
| Veto LLD | 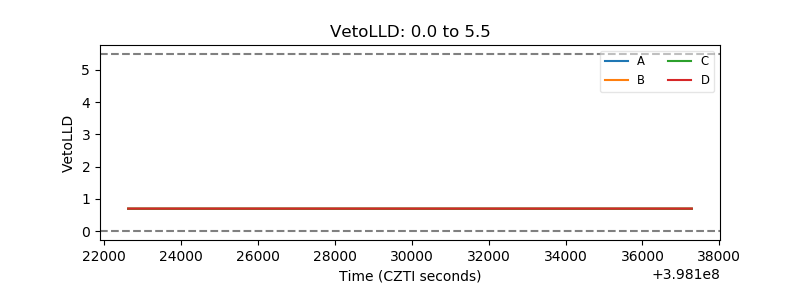 |
| Alpha Counter | 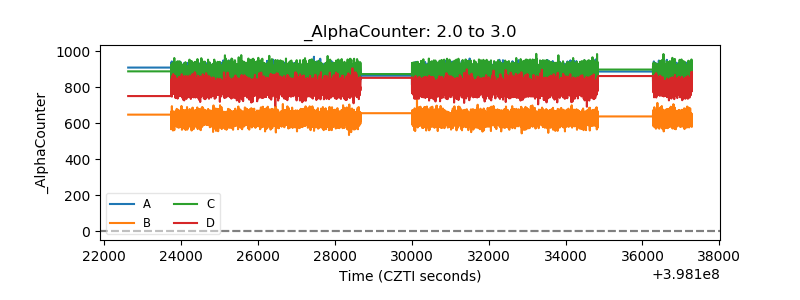 |
| _CPM_Rate | 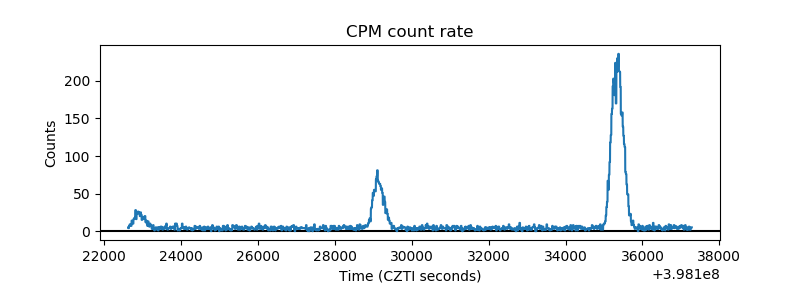 |
| CZT Counter | 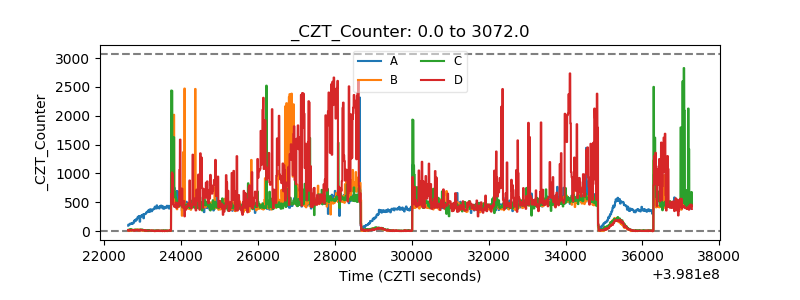 |
| +2.5 Volts monitor | 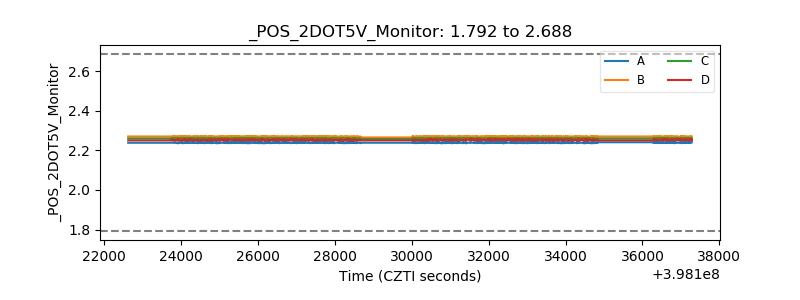 |
| +5 Volts monitor | 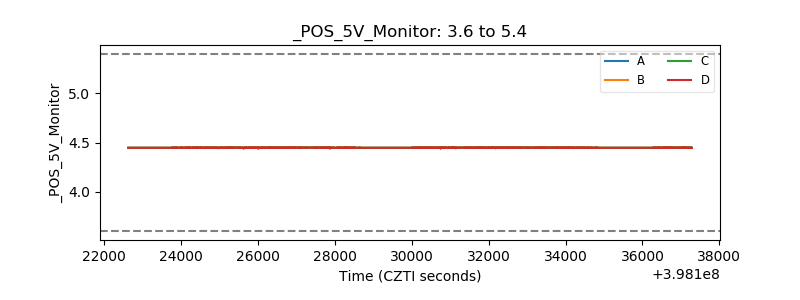 |
| _ROLL_ROT | 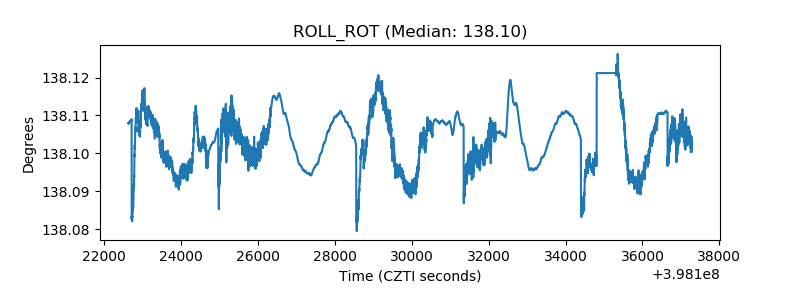 |
| _Roll_DEC | 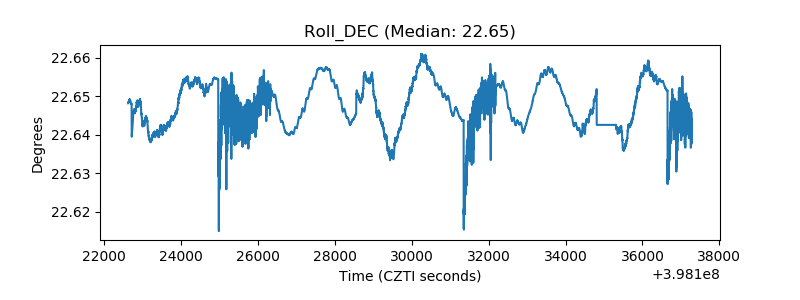 |
| _Roll_RA | 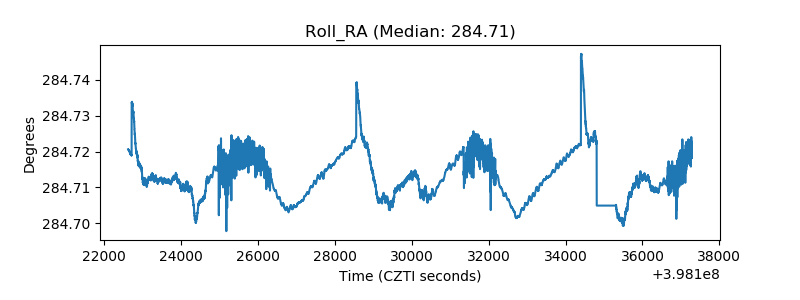 |
| Veto Counter | 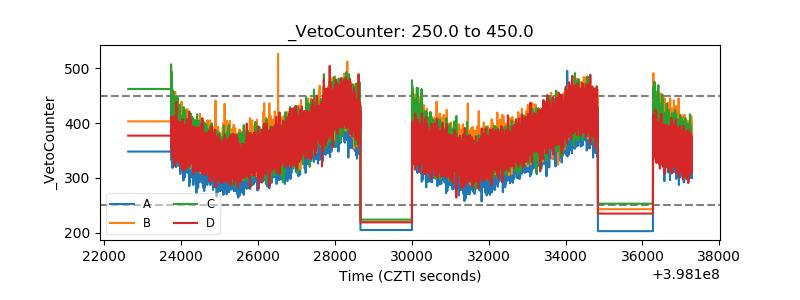 |