| Param | Original file | Final file |
|---|---|---|
| Filename | modeM0/AS1A11_079T01_9000005284_37185cztM0_level2.evt | modeM0/AS1A11_079T01_9000005284_37185cztM0_level2_quad_clean.evt |
| Size (bytes) | 391,746,240 | 54,685,440 |
| Size | 373.6 MB | 52.2 MB |
| Events in quadrant A | 2,754,352 | 326,743 |
| Events in quadrant B | 2,832,064 | 328,921 |
| Events in quadrant C | 2,975,330 | 322,121 |
| Events in quadrant D | 2,941,841 | 306,616 |
| Mode M9 | |||
|---|---|---|---|
| Quadrant | BADHDUFLAG | Total packets | Discarded packets |
| A | 0 | 25 | 0 |
| B | 0 | 25 | 0 |
| C | 0 | 25 | 0 |
| D | 0 | 26 | 0 |
| Mode SS | |||
|---|---|---|---|
| Quadrant | BADHDUFLAG | Total packets | Discarded packets |
| A | 0 | 110 | 0 |
| B | 0 | 110 | 0 |
| C | 0 | 110 | 0 |
| D | 0 | 110 | 0 |
| Mode M0 | |||
|---|---|---|---|
| Quadrant | BADHDUFLAG | Total packets | Discarded packets |
| A | 0 | 11268 | 3 |
| B | 0 | 11614 | 2 |
| C | 0 | 11798 | 2 |
| D | 0 | 12164 | 2 |
| Quadrant | Total seconds | Saturated seconds | Saturation percentage |
|---|---|---|---|
| A | 5293 | 17 | 0.321179% |
| B | 5293 | 61 | 1.152466% |
| C | 5293 | 89 | 1.681466% |
| D | 5293 | 37 | 0.699036% |
Noise dominated data is calculated using 1-second bins in cleaned event files. If a bin has >2000 counts, and if more than 50% of those come from <1% of pixels, then it is considered to be noise-dominated and hence unusable.
| Quadrant | # 1 sec bins | Bins with >0 counts | Bins with >2000 counts | High rate bins dominated by noise | Noise dominated (total time) | Noise dominated (detector-on time) | Marked lightcurve |
|---|---|---|---|---|---|---|---|
| A | 7116 | 5294 | 3 | 3 | 0.04% | 0.06% | 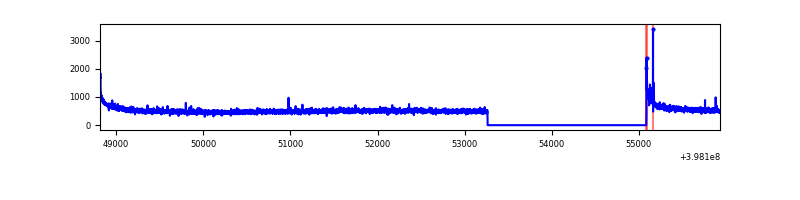 |
| B | 7116 | 5294 | 20 | 20 | 0.28% | 0.38% | 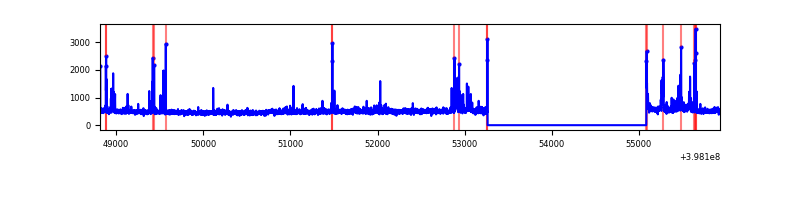 |
| C | 7116 | 5294 | 66 | 66 | 0.93% | 1.25% | 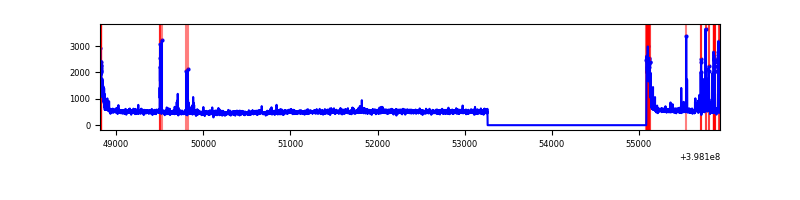 |
| D | 7116 | 5294 | 34 | 34 | 0.48% | 0.64% | 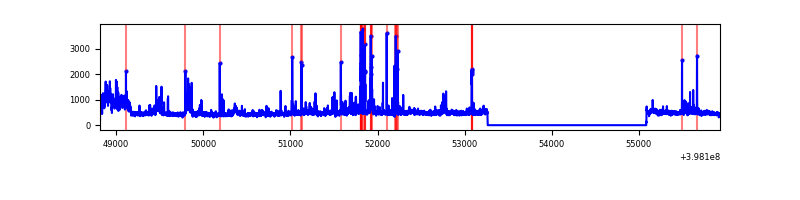 |
Top three noisy pixels from each quadrant. If the there are fewer than three noisy pixels in the level2.evt file, extra rows are filled as -1
| Pixel properties | Quadrant properties | ||||||
|---|---|---|---|---|---|---|---|
| Quadrant | DetID | PixID | Counts | Sigma | Mean | Median | Sigma |
| A | 10 | 83 | 258887 | 1978.09 | 642 | 629 | 130.6 |
| A | 9 | 143 | 11821 | 85.72 | 642 | 629 | 130.6 |
| A | 13 | 254 | 8325 | 58.95 | 642 | 629 | 130.6 |
| B | 5 | 172 | 178858 | 1475.84 | 632 | 617 | 120.8 |
| B | 5 | 184 | 54626 | 447.2 | 632 | 617 | 120.8 |
| B | 0 | 190 | 47700 | 389.85 | 632 | 617 | 120.8 |
| C | 15 | 214 | 228291 | 1587.22 | 617 | 624 | 143.4 |
| C | 0 | 10 | 145825 | 1012.3 | 617 | 624 | 143.4 |
| C | 14 | 254 | 125726 | 872.17 | 617 | 624 | 143.4 |
| D | 10 | 253 | 210323 | 1403.33 | 615 | 597 | 149.4 |
| D | 2 | 249 | 131577 | 876.42 | 615 | 597 | 149.4 |
| D | 13 | 171 | 49840 | 329.5 | 615 | 597 | 149.4 |
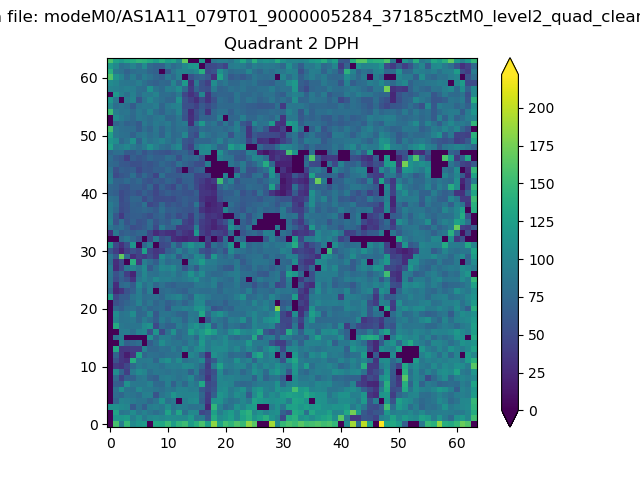
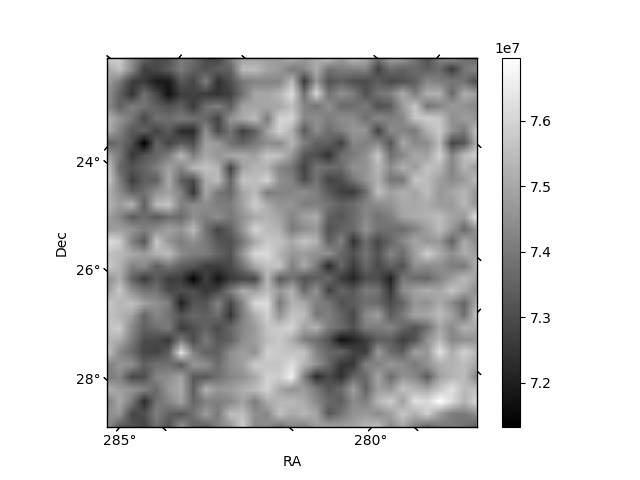
Histogram calculated using DETX and DETY for each event in the final _common_clean file
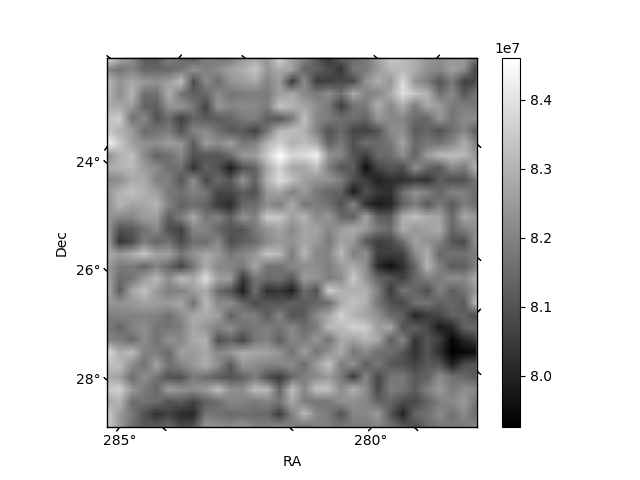
| Quadrant A | 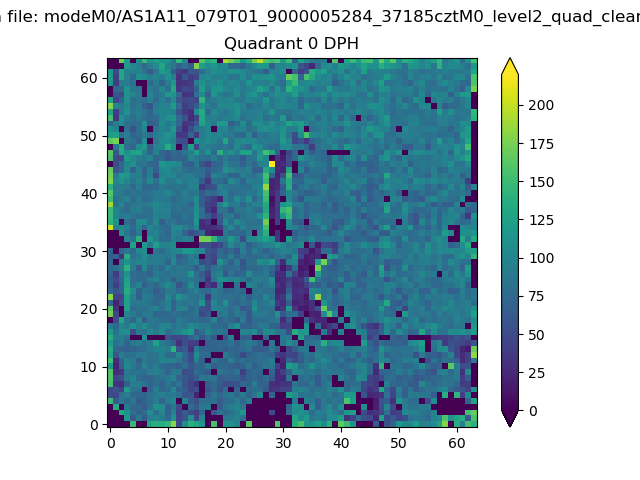 |
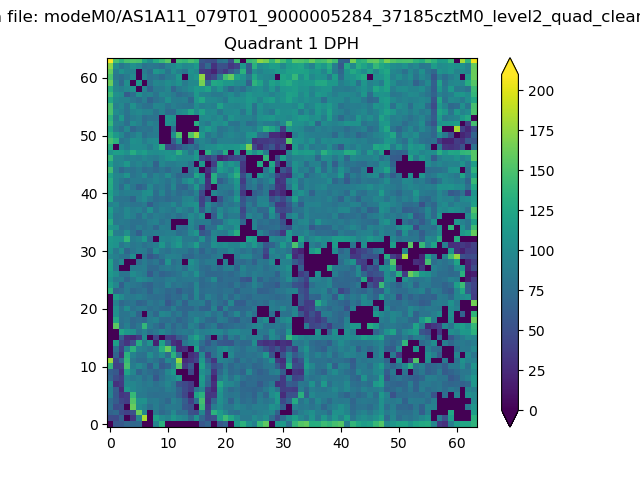 |
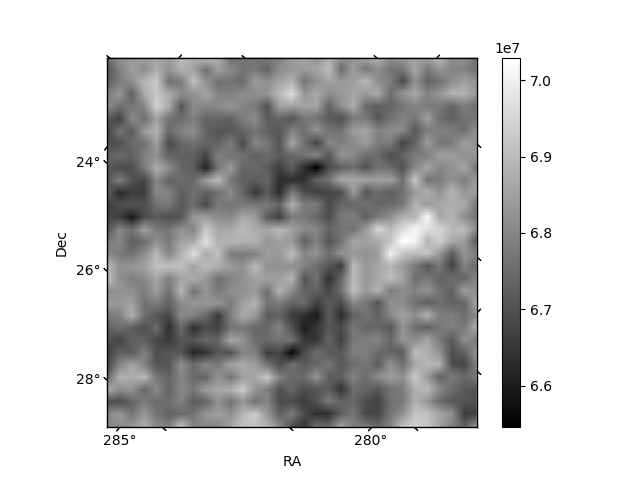
Quadrant B |
|---|---|---|---|
| Quadrant D | 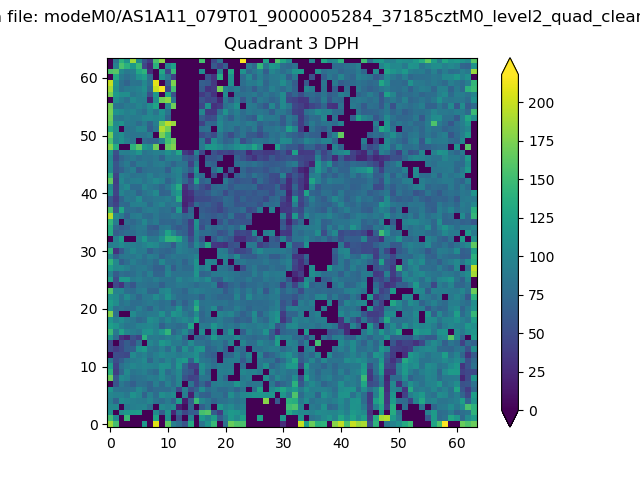 |
 |
Quadrant C |
| Plot type | Count rate plots | Images |
|---|---|---|
| Comparison with Poisson distribution Blue bars denote a histogram of data divided into 1 sec bins. Red curve is a Poisson curve with rate = median count rate of data. |
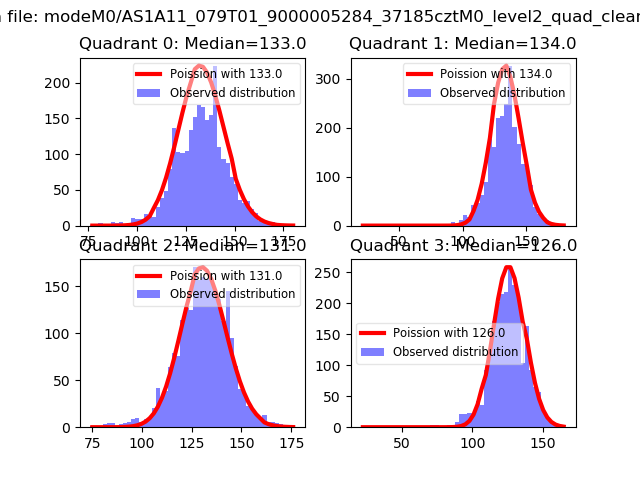 |
 |
| Quadrant-wise count rates Data is divided into 100 sec bins |
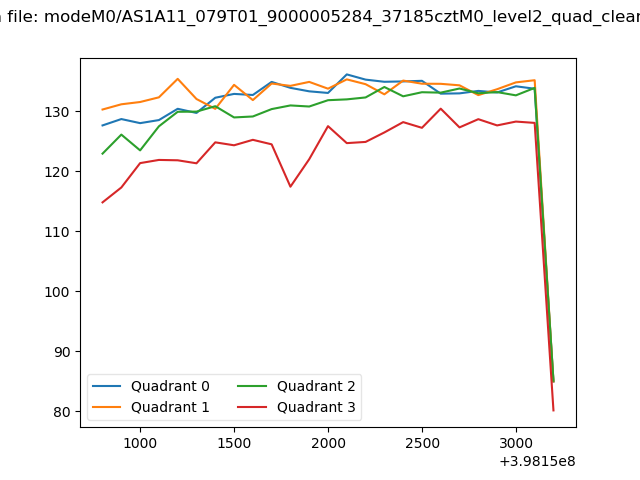 |
|
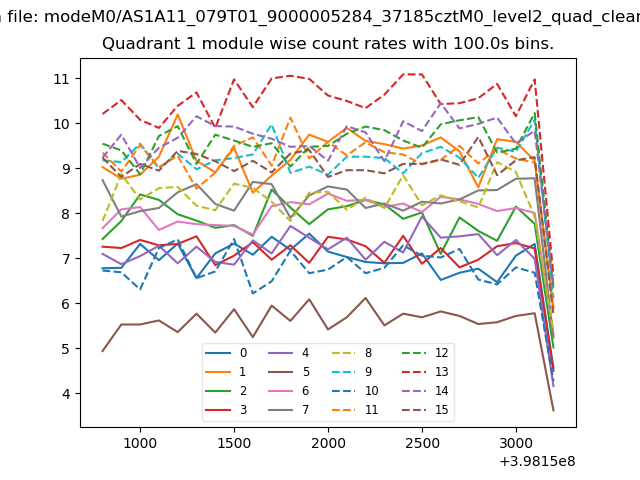
| Module-wise count rates for Quadrant A Data is divided into 100 sec bins |
 |
 |
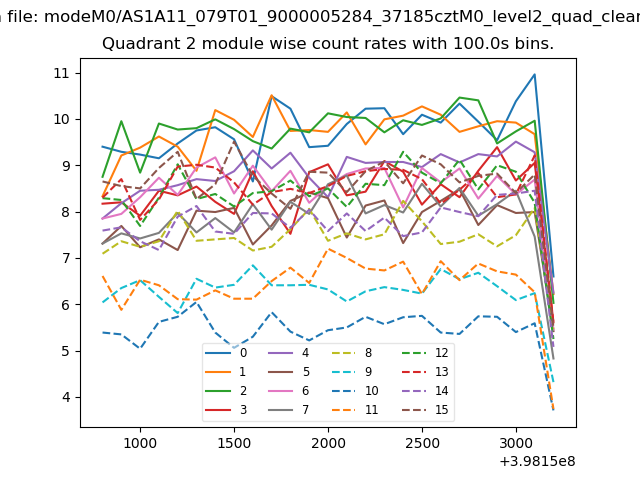
| Module-wise count rates for Quadrant B Data is divided into 100 sec bins |
 |
 |
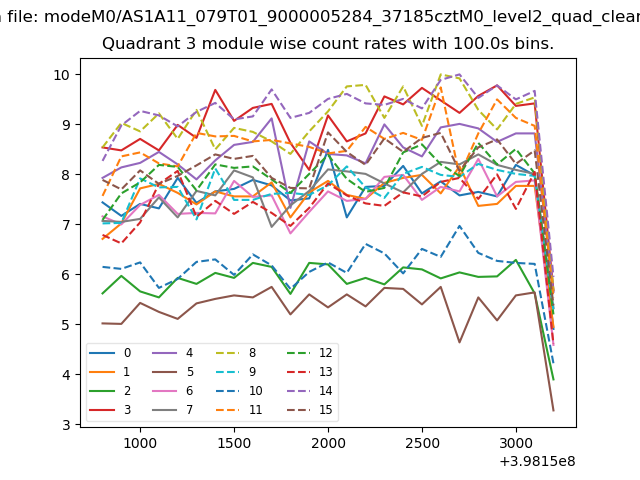
| Module-wise count rates for Quadrant C Data is divided into 100 sec bins |
 |
 |
| Module-wise count rates for Quadrant D Data is divided into 100 sec bins |
 |
 |
| Parameter | Plot |
|---|---|
| CZT HV Monitor | 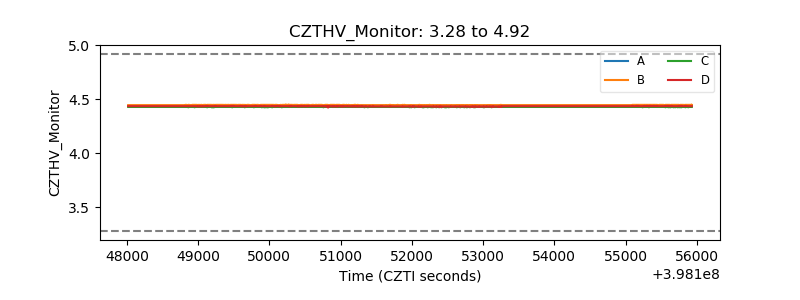 |
| D_VDD | 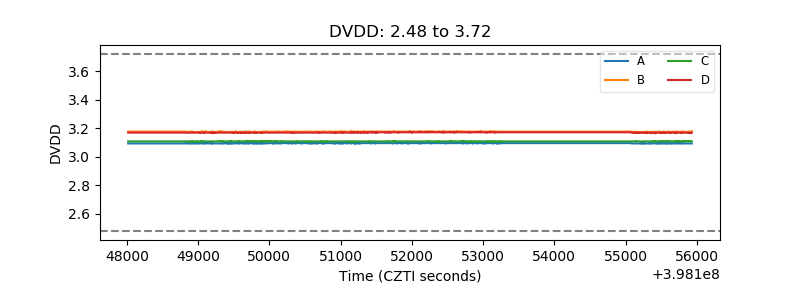 |
| Temperature 1 | 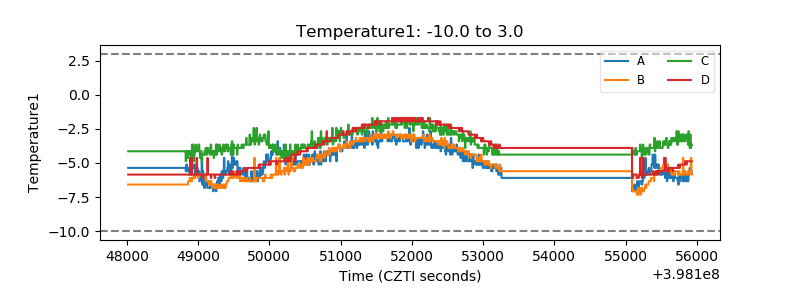 |
| Veto HV Monitor | 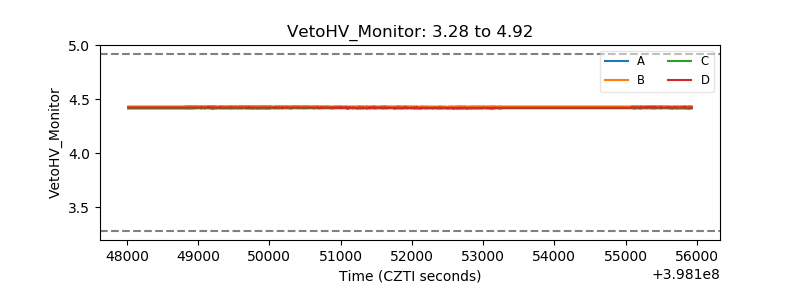 |
| Veto LLD | 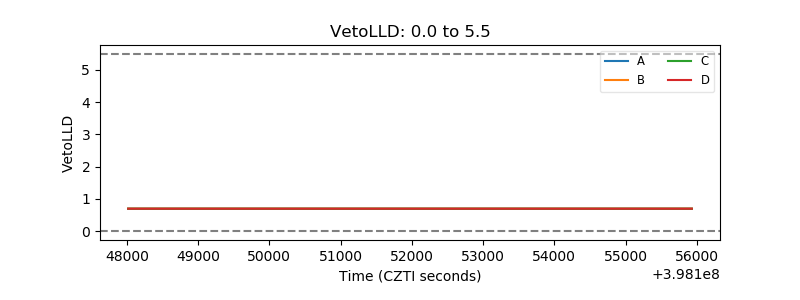 |
| Alpha Counter | 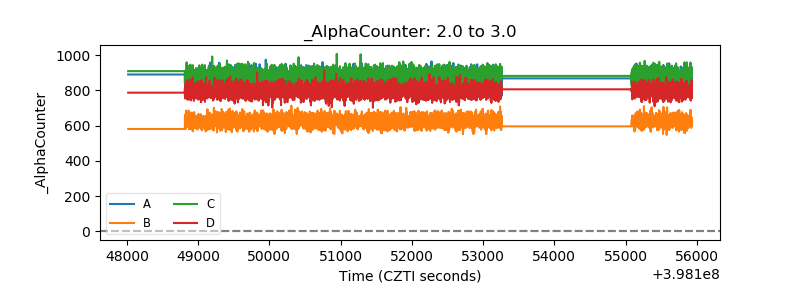 |
| _CPM_Rate | 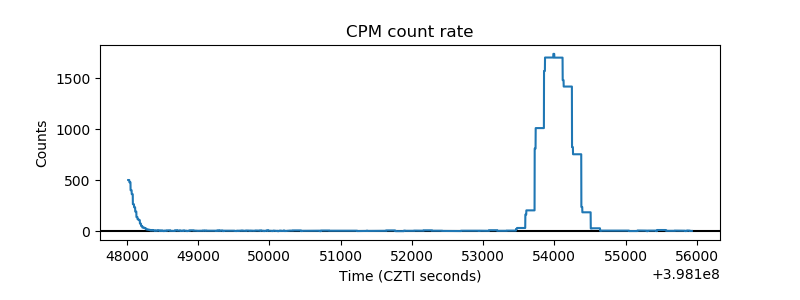 |
| CZT Counter | 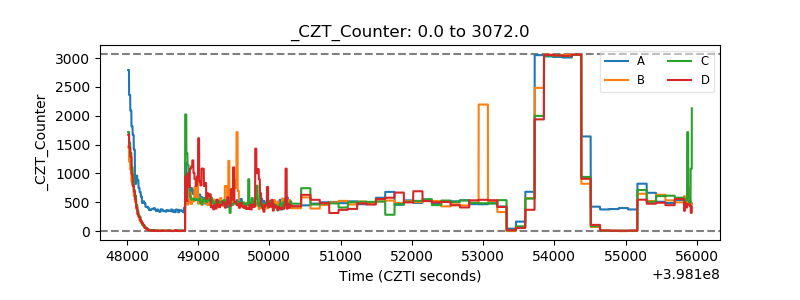 |
| +2.5 Volts monitor | 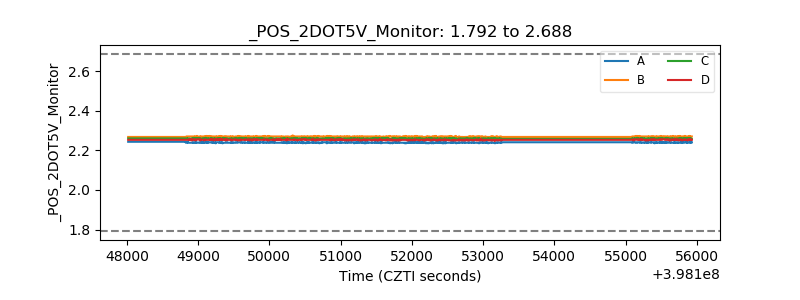 |
| +5 Volts monitor | 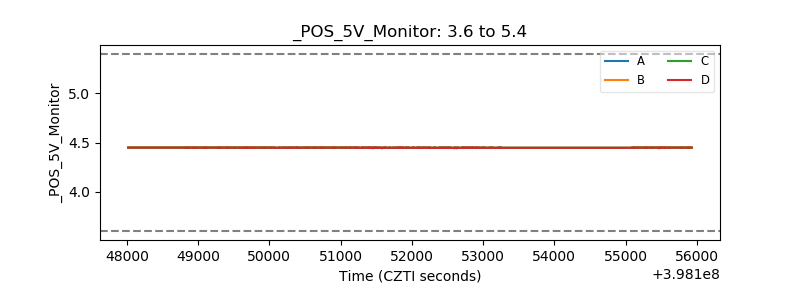 |
| _ROLL_ROT | 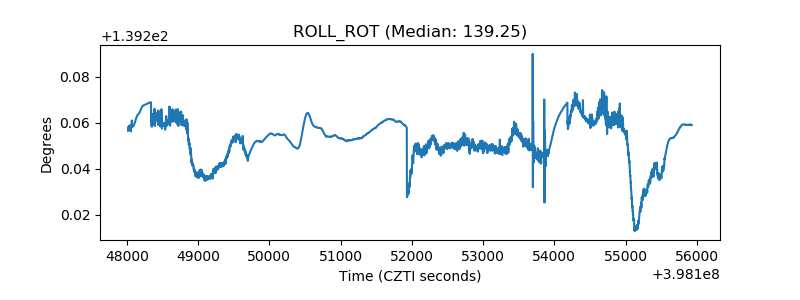 |
| _Roll_DEC | 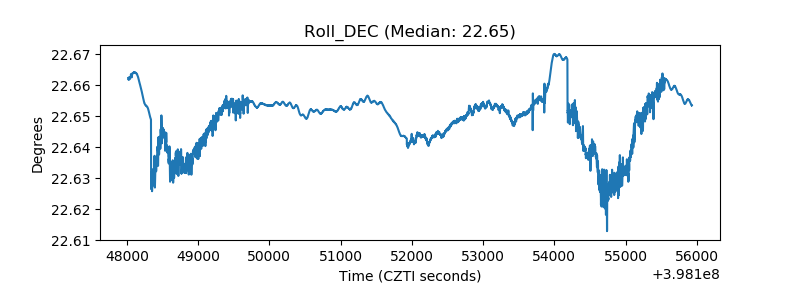 |
| _Roll_RA | 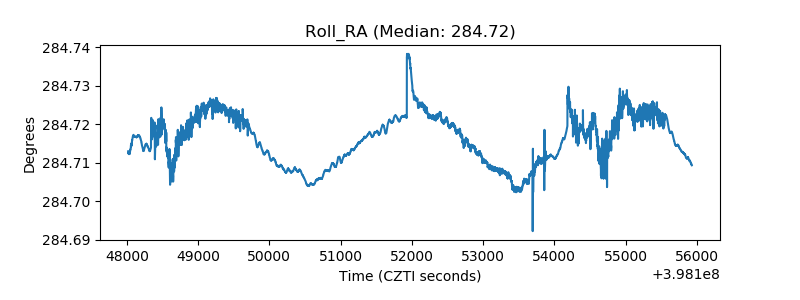 |
| Veto Counter | 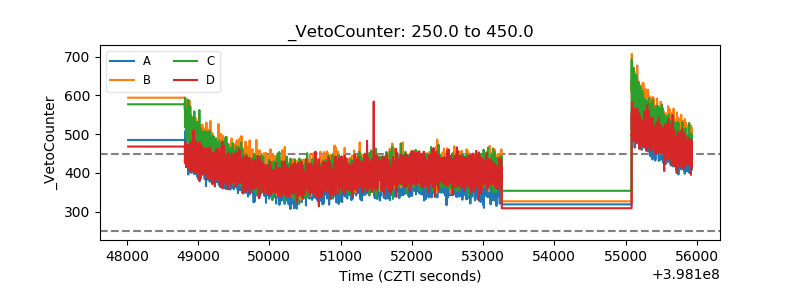 |