| Param | Original file | Final file |
|---|---|---|
| Filename | modeM0/AS1A11_079T01_9000005284_37186cztM0_level2.evt | modeM0/AS1A11_079T01_9000005284_37186cztM0_level2_quad_clean.evt |
| Size (bytes) | 440,732,160 | 63,512,640 |
| Size | 420.3 MB | 60.6 MB |
| Events in quadrant A | 2,959,906 | 397,280 |
| Events in quadrant B | 3,069,910 | 398,075 |
| Events in quadrant C | 3,221,650 | 388,688 |
| Events in quadrant D | 3,729,469 | 360,741 |
| Mode M9 | |||
|---|---|---|---|
| Quadrant | BADHDUFLAG | Total packets | Discarded packets |
| A | 0 | 38 | 0 |
| B | 0 | 38 | 0 |
| C | 0 | 38 | 0 |
| D | 0 | 38 | 0 |
| Mode SS | |||
|---|---|---|---|
| Quadrant | BADHDUFLAG | Total packets | Discarded packets |
| A | 0 | 112 | 0 |
| B | 0 | 112 | 0 |
| C | 0 | 112 | 0 |
| D | 0 | 112 | 0 |
| Mode M0 | |||
|---|---|---|---|
| Quadrant | BADHDUFLAG | Total packets | Discarded packets |
| A | 0 | 11862 | 3 |
| B | 0 | 12291 | 2 |
| C | 0 | 12522 | 2 |
| D | 0 | 14481 | 2 |
| Quadrant | Total seconds | Saturated seconds | Saturation percentage |
|---|---|---|---|
| A | 5400 | 18 | 0.333333% |
| B | 5400 | 108 | 2.000000% |
| C | 5400 | 122 | 2.259259% |
| D | 5400 | 204 | 3.777778% |
Noise dominated data is calculated using 1-second bins in cleaned event files. If a bin has >2000 counts, and if more than 50% of those come from <1% of pixels, then it is considered to be noise-dominated and hence unusable.
| Quadrant | # 1 sec bins | Bins with >0 counts | Bins with >2000 counts | High rate bins dominated by noise | Noise dominated (total time) | Noise dominated (detector-on time) | Marked lightcurve |
|---|---|---|---|---|---|---|---|
| A | 9166 | 5402 | 7 | 7 | 0.08% | 0.13% | 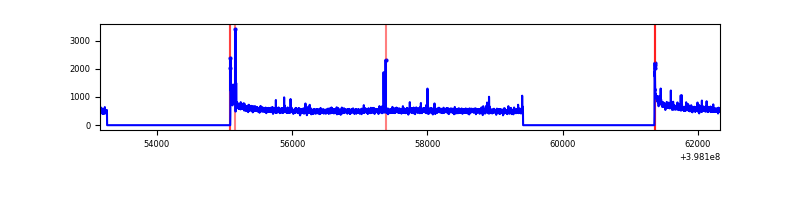 |
| B | 9166 | 5402 | 58 | 58 | 0.63% | 1.07% | 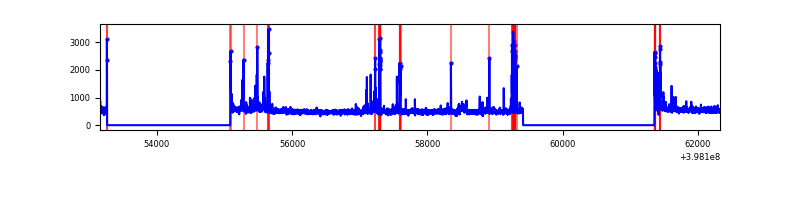 |
| C | 9166 | 5402 | 105 | 105 | 1.15% | 1.94% | 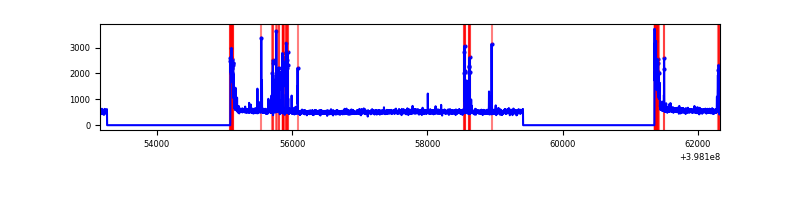 |
| D | 9166 | 5402 | 183 | 183 | 2.00% | 3.39% | 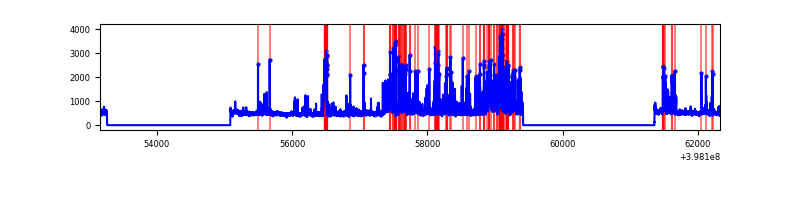 |
Top three noisy pixels from each quadrant. If the there are fewer than three noisy pixels in the level2.evt file, extra rows are filled as -1
| Pixel properties | Quadrant properties | ||||||
|---|---|---|---|---|---|---|---|
| Quadrant | DetID | PixID | Counts | Sigma | Mean | Median | Sigma |
| A | 10 | 83 | 258411 | 1893.82 | 688 | 677 | 136.1 |
| A | 9 | 143 | 21516 | 153.12 | 688 | 677 | 136.1 |
| A | 13 | 248 | 8811 | 59.77 | 688 | 677 | 136.1 |
| B | 5 | 172 | 232314 | 1809.29 | 674 | 658 | 128.0 |
| B | 5 | 184 | 71094 | 550.12 | 674 | 658 | 128.0 |
| B | 5 | 200 | 52098 | 401.76 | 674 | 658 | 128.0 |
| C | 15 | 214 | 231184 | 1515.26 | 653 | 657 | 152.1 |
| C | 0 | 10 | 201326 | 1319.0 | 653 | 657 | 152.1 |
| C | 14 | 254 | 167753 | 1098.32 | 653 | 657 | 152.1 |
| D | 1 | 52 | 842180 | 5374.82 | 650 | 634 | 156.6 |
| D | 13 | 171 | 100457 | 637.55 | 650 | 634 | 156.6 |
| D | 2 | 249 | 96192 | 610.31 | 650 | 634 | 156.6 |
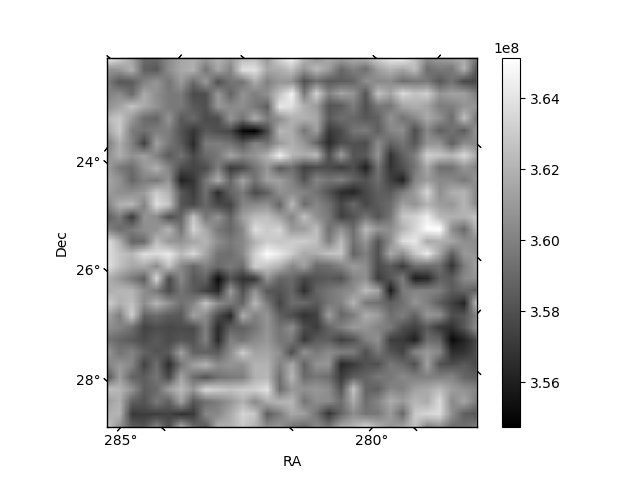
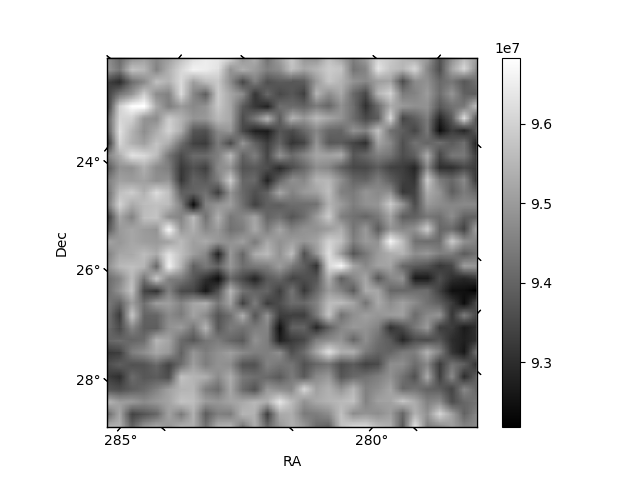
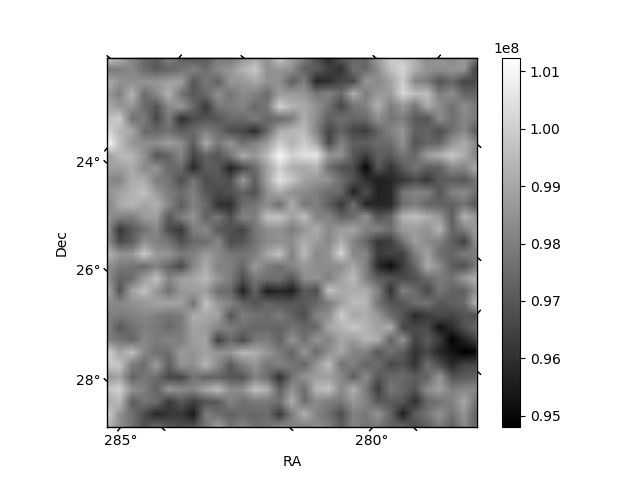
Histogram calculated using DETX and DETY for each event in the final _common_clean file
| Quadrant A | 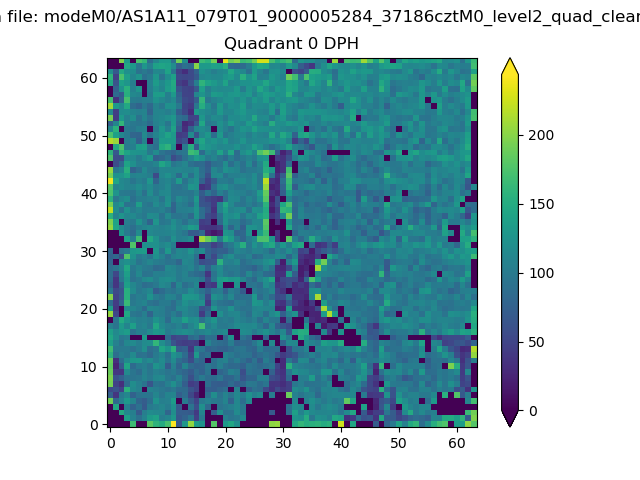 |
 |
Quadrant B |
|---|---|---|---|
| Quadrant D | 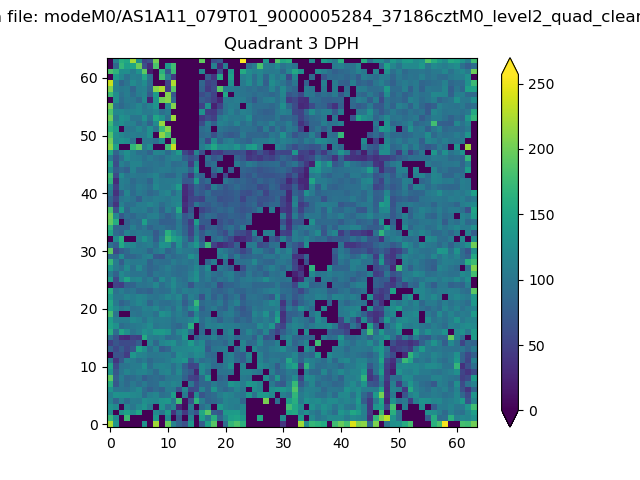 |
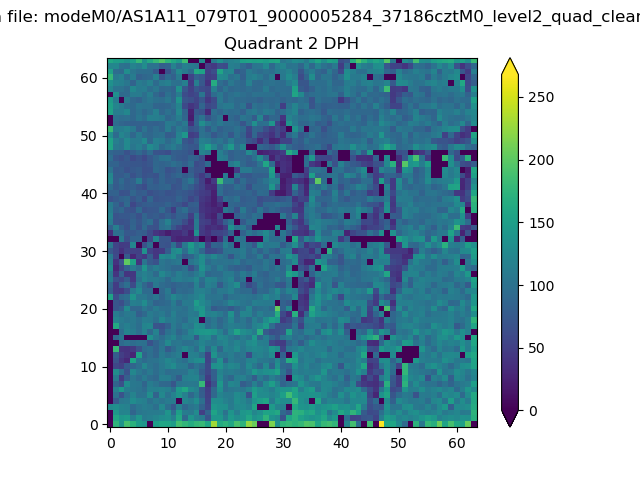 |
Quadrant C |
| Plot type | Count rate plots | Images |
|---|---|---|
| Comparison with Poisson distribution Blue bars denote a histogram of data divided into 1 sec bins. Red curve is a Poisson curve with rate = median count rate of data. |
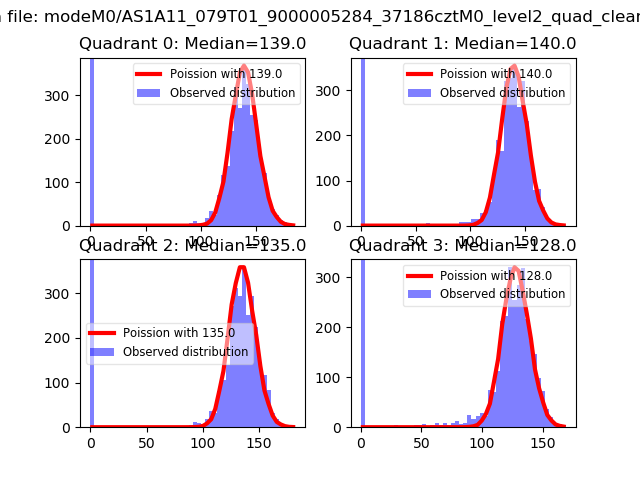 |
 |
| Quadrant-wise count rates Data is divided into 100 sec bins |
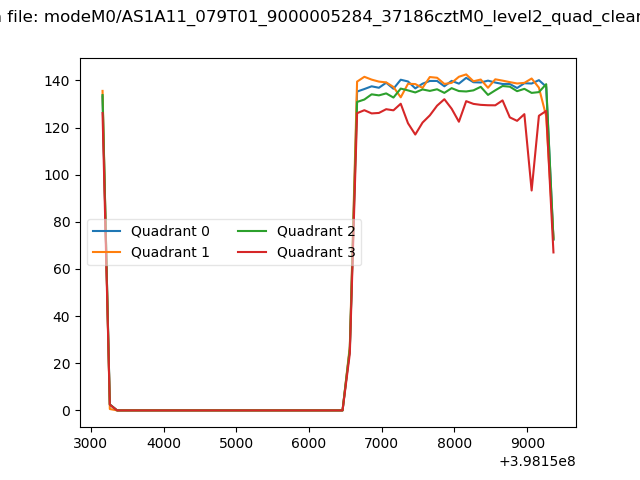 |
|
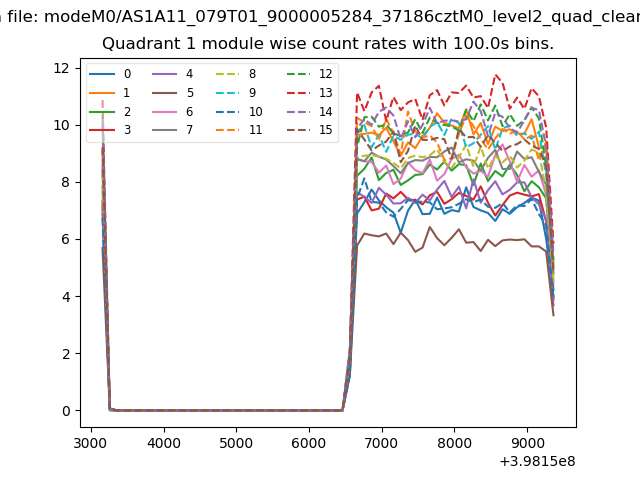
| Module-wise count rates for Quadrant A Data is divided into 100 sec bins |
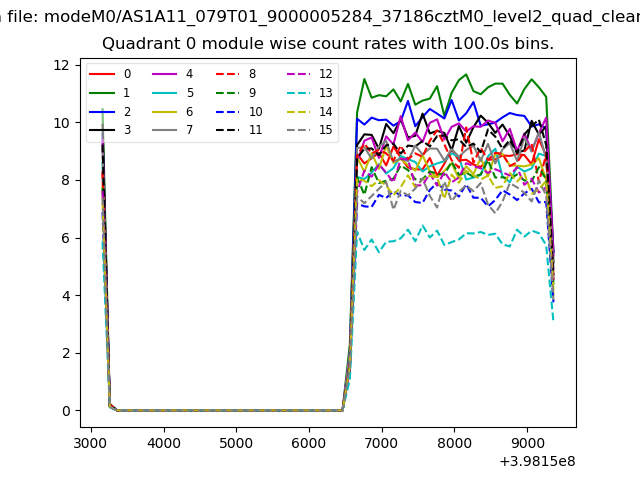 |
 |
| Module-wise count rates for Quadrant B Data is divided into 100 sec bins |
 |
 |
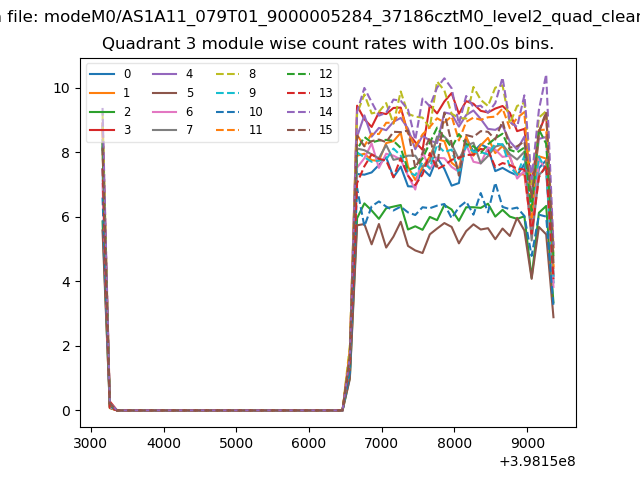
| Module-wise count rates for Quadrant C Data is divided into 100 sec bins |
 |
 |
| Module-wise count rates for Quadrant D Data is divided into 100 sec bins |
 |
 |
| Parameter | Plot |
|---|---|
| CZT HV Monitor | 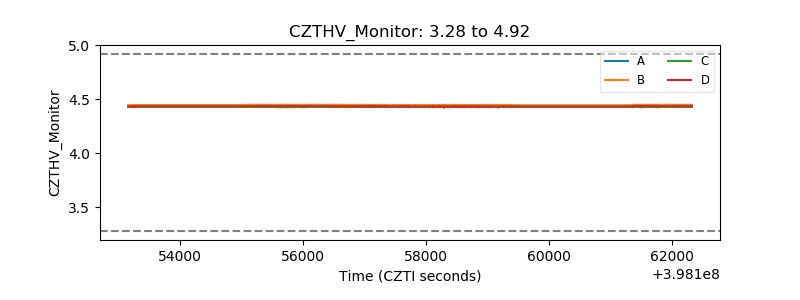 |
| D_VDD | 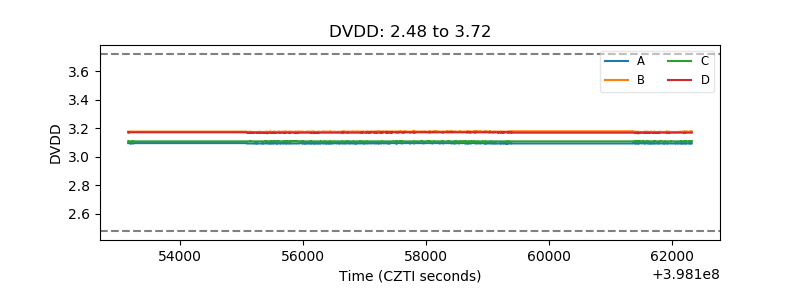 |
| Temperature 1 | 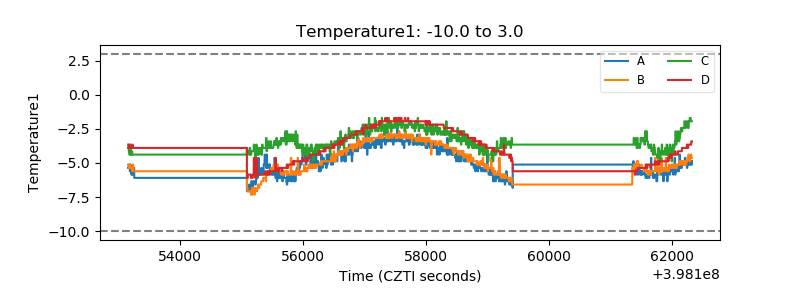 |
| Veto HV Monitor | 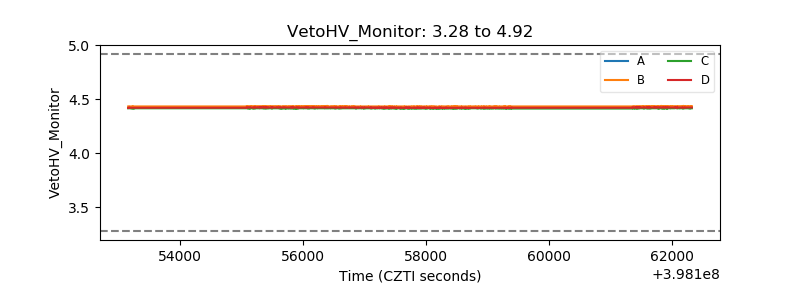 |
| Veto LLD | 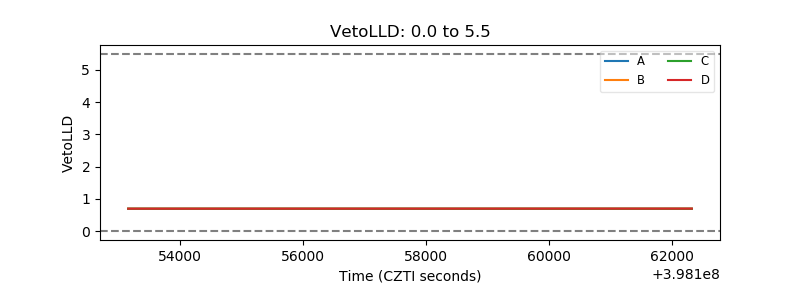 |
| Alpha Counter |  |
| _CPM_Rate | 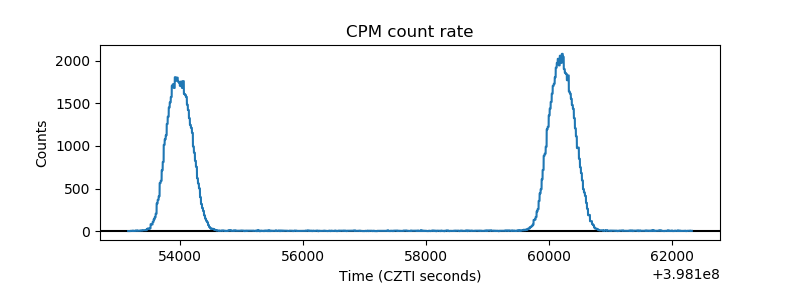 |
| CZT Counter | 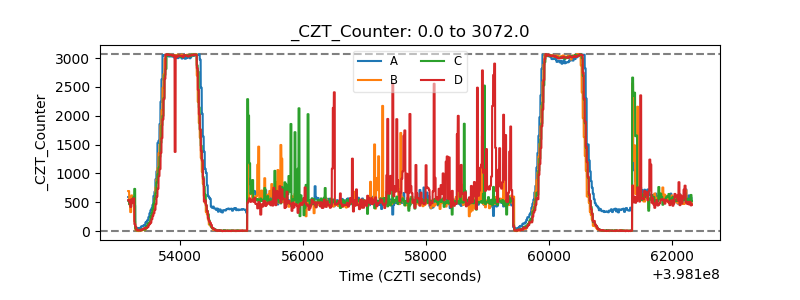 |
| +2.5 Volts monitor | 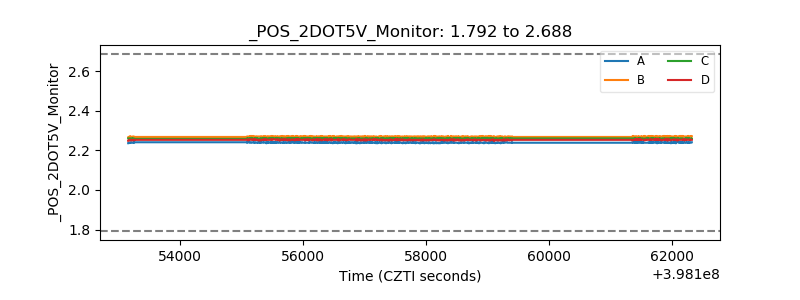 |
| +5 Volts monitor |  |
| _ROLL_ROT | 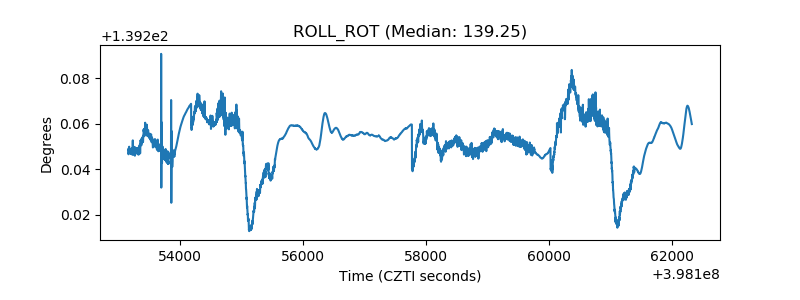 |
| _Roll_DEC | 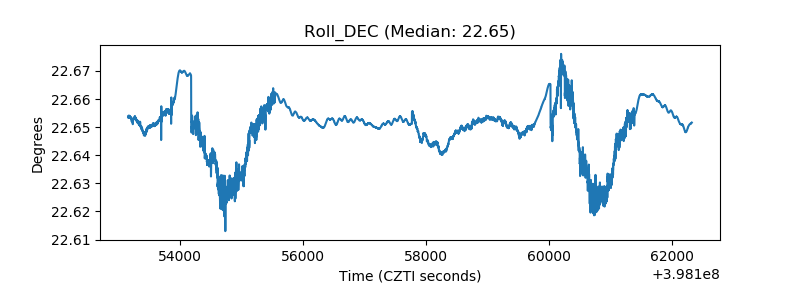 |
| _Roll_RA |  |
| Veto Counter | 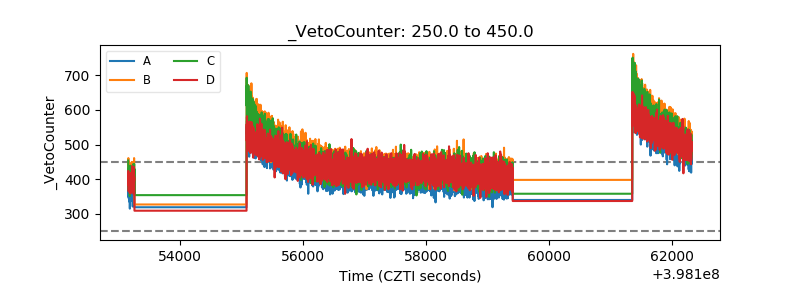 |