| Param | Original file | Final file |
|---|---|---|
| Filename | modeM0/AS1A11_079T01_9000005284_37187cztM0_level2.evt | modeM0/AS1A11_079T01_9000005284_37187cztM0_level2_quad_clean.evt |
| Size (bytes) | 442,137,600 | 70,620,480 |
| Size | 421.7 MB | 67.3 MB |
| Events in quadrant A | 2,846,672 | 463,606 |
| Events in quadrant B | 2,899,051 | 464,433 |
| Events in quadrant C | 3,983,131 | 439,280 |
| Events in quadrant D | 3,320,846 | 419,232 |
| Mode M9 | |||
|---|---|---|---|
| Quadrant | BADHDUFLAG | Total packets | Discarded packets |
| A | 0 | 35 | 0 |
| B | 0 | 35 | 0 |
| C | 0 | 35 | 0 |
| D | 0 | 36 | 0 |
| Mode SS | |||
|---|---|---|---|
| Quadrant | BADHDUFLAG | Total packets | Discarded packets |
| A | 0 | 102 | 0 |
| B | 0 | 102 | 0 |
| C | 0 | 102 | 0 |
| D | 0 | 102 | 0 |
| Mode M0 | |||
|---|---|---|---|
| Quadrant | BADHDUFLAG | Total packets | Discarded packets |
| A | 0 | 11363 | 3 |
| B | 0 | 11562 | 2 |
| C | 0 | 15200 | 2 |
| D | 0 | 12899 | 2 |
| Quadrant | Total seconds | Saturated seconds | Saturation percentage |
|---|---|---|---|
| A | 5018 | 16 | 0.318852% |
| B | 5018 | 54 | 1.076126% |
| C | 5018 | 236 | 4.703069% |
| D | 5018 | 208 | 4.145078% |
Noise dominated data is calculated using 1-second bins in cleaned event files. If a bin has >2000 counts, and if more than 50% of those come from <1% of pixels, then it is considered to be noise-dominated and hence unusable.
| Quadrant | # 1 sec bins | Bins with >0 counts | Bins with >2000 counts | High rate bins dominated by noise | Noise dominated (total time) | Noise dominated (detector-on time) | Marked lightcurve |
|---|---|---|---|---|---|---|---|
| A | 7080 | 5019 | 9 | 9 | 0.13% | 0.18% | 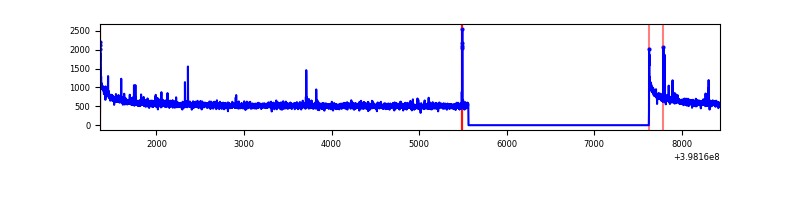 |
| B | 7080 | 5019 | 24 | 24 | 0.34% | 0.48% | 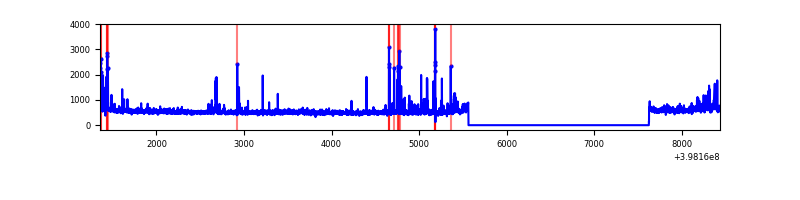 |
| C | 7080 | 5019 | 264 | 264 | 3.73% | 5.26% | 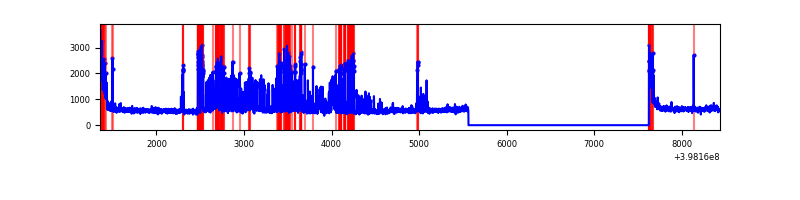 |
| D | 7080 | 5019 | 151 | 151 | 2.13% | 3.01% | 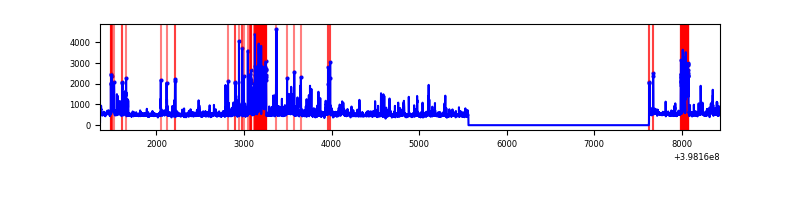 |
Top three noisy pixels from each quadrant. If the there are fewer than three noisy pixels in the level2.evt file, extra rows are filled as -1
| Pixel properties | Quadrant properties | ||||||
|---|---|---|---|---|---|---|---|
| Quadrant | DetID | PixID | Counts | Sigma | Mean | Median | Sigma |
| A | 10 | 83 | 249591 | 1891.23 | 661 | 653 | 131.6 |
| A | 9 | 143 | 32301 | 240.44 | 661 | 653 | 131.6 |
| A | 13 | 254 | 7589 | 52.69 | 661 | 653 | 131.6 |
| B | 5 | 172 | 215445 | 1750.53 | 648 | 633 | 122.7 |
| B | 0 | 213 | 71963 | 581.28 | 648 | 633 | 122.7 |
| B | 0 | 190 | 28546 | 227.47 | 648 | 633 | 122.7 |
| C | 10 | 49 | 1093130 | 7693.13 | 619 | 624 | 142.0 |
| C | 15 | 214 | 214867 | 1508.64 | 619 | 624 | 142.0 |
| C | 0 | 10 | 177755 | 1247.31 | 619 | 624 | 142.0 |
| D | 2 | 249 | 352087 | 2322.03 | 622 | 606 | 151.4 |
| D | 1 | 52 | 219224 | 1444.28 | 622 | 606 | 151.4 |
| D | 10 | 118 | 155962 | 1026.34 | 622 | 606 | 151.4 |
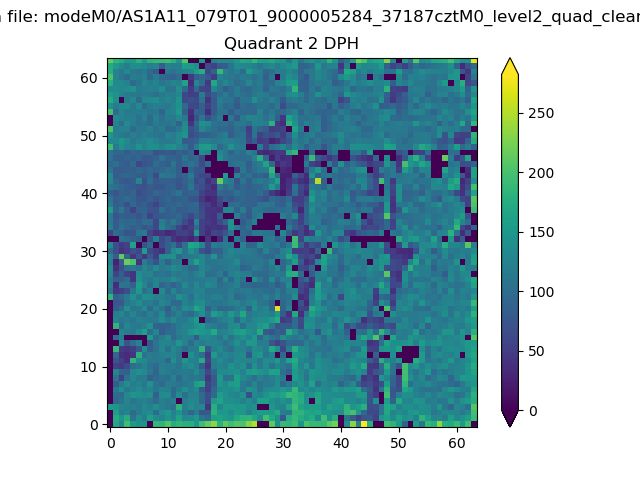
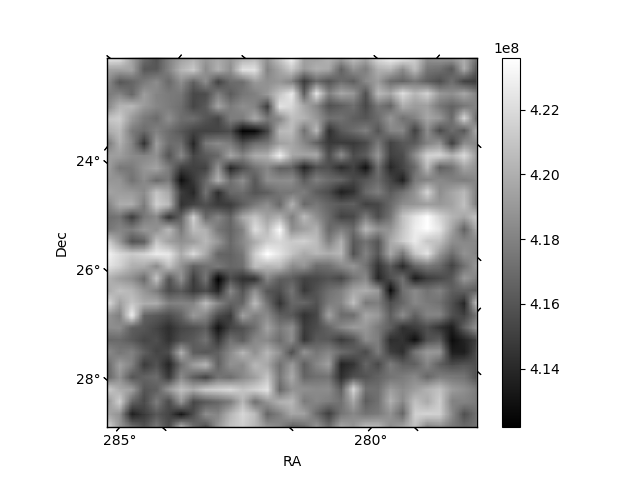
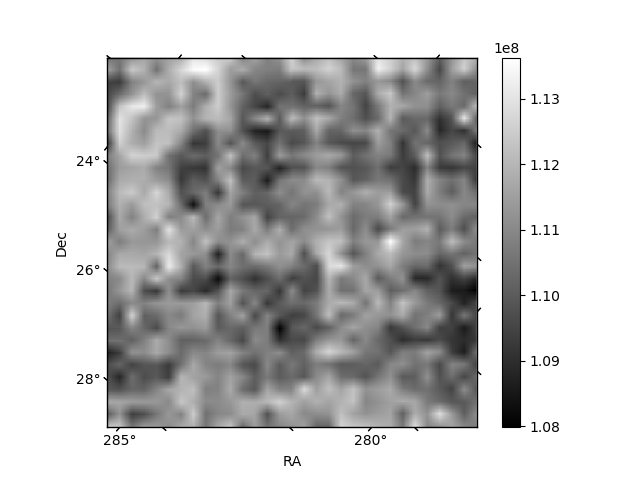
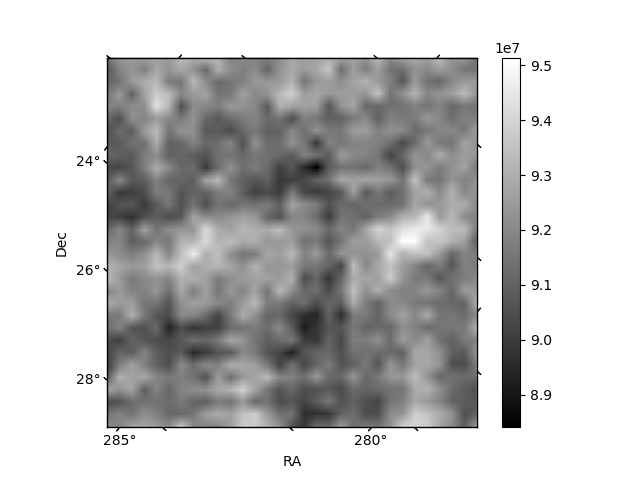
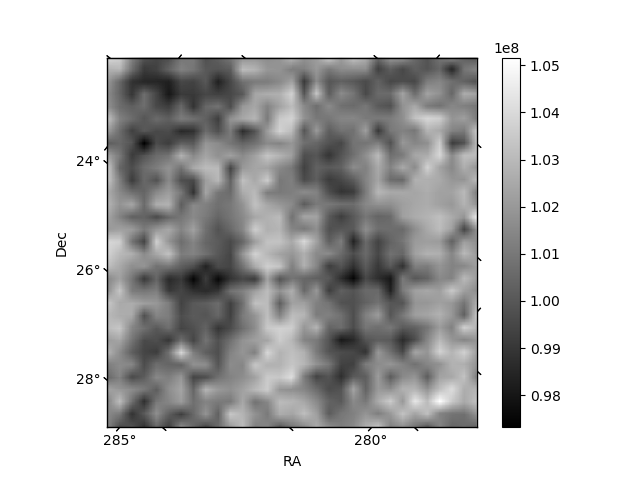
Histogram calculated using DETX and DETY for each event in the final _common_clean file
| Quadrant A | 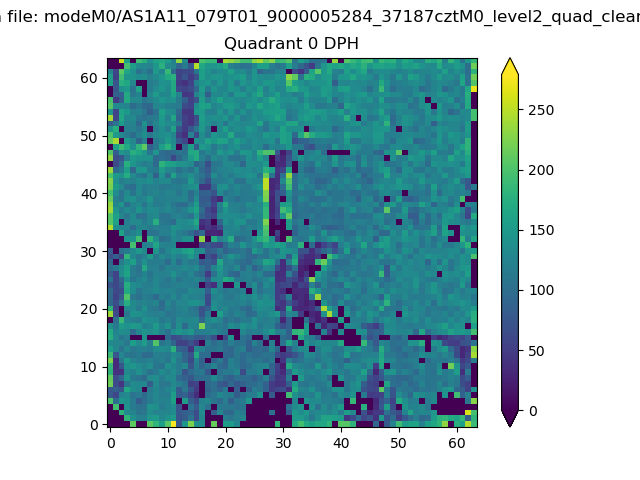 |
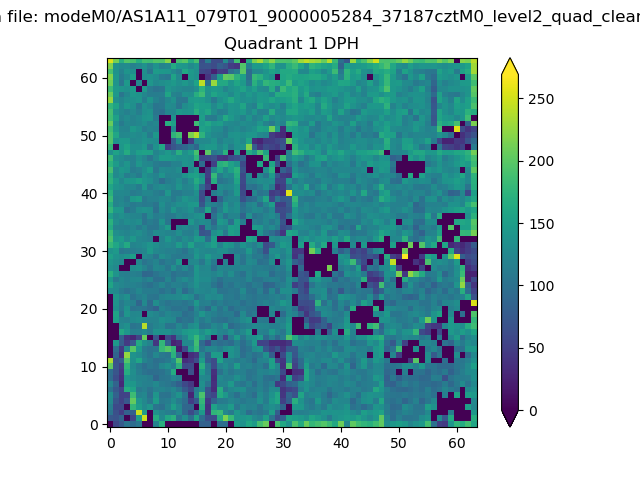 |
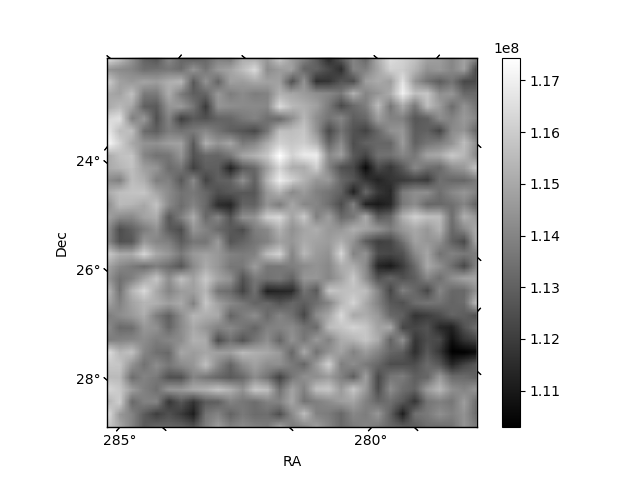
Quadrant B |
|---|---|---|---|
| Quadrant D | 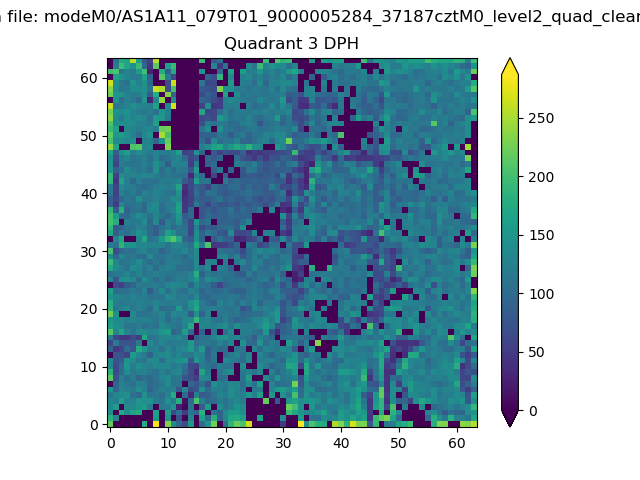 |
 |
Quadrant C |
| Plot type | Count rate plots | Images |
|---|---|---|
| Comparison with Poisson distribution Blue bars denote a histogram of data divided into 1 sec bins. Red curve is a Poisson curve with rate = median count rate of data. |
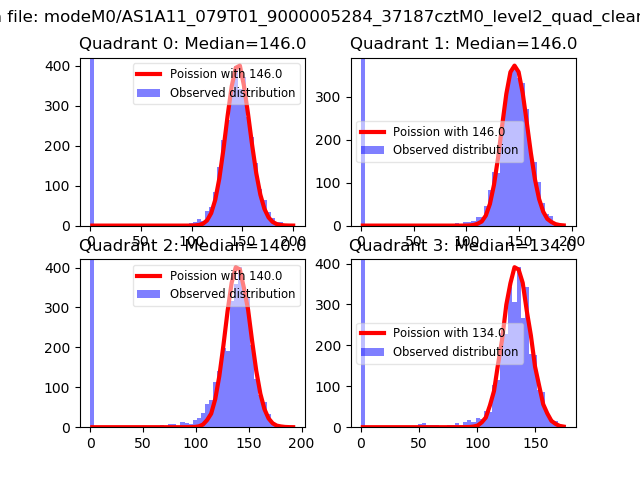 |
 |
| Quadrant-wise count rates Data is divided into 100 sec bins |
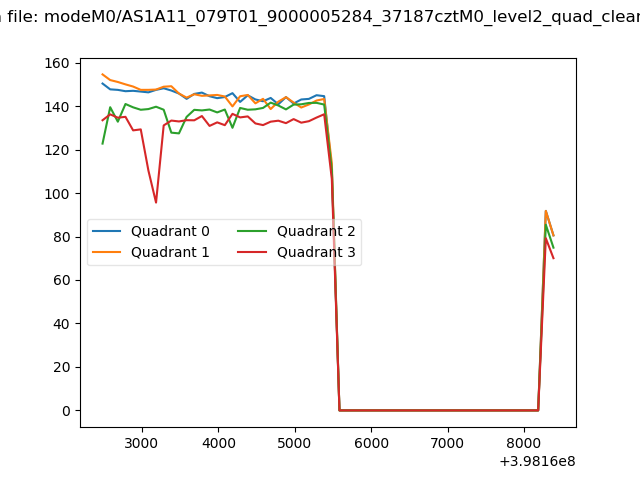 |
|
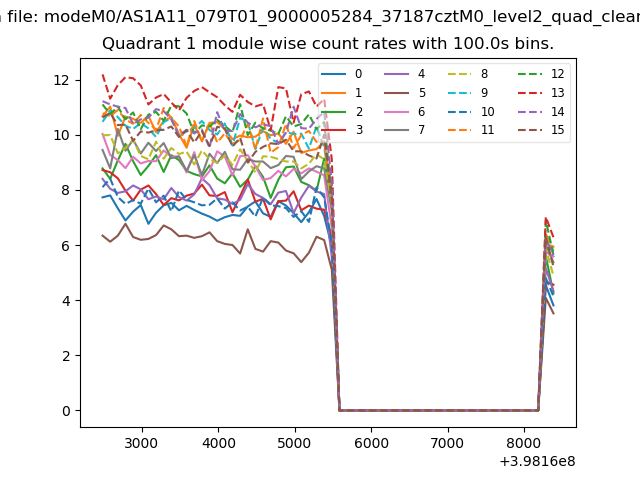
| Module-wise count rates for Quadrant A Data is divided into 100 sec bins |
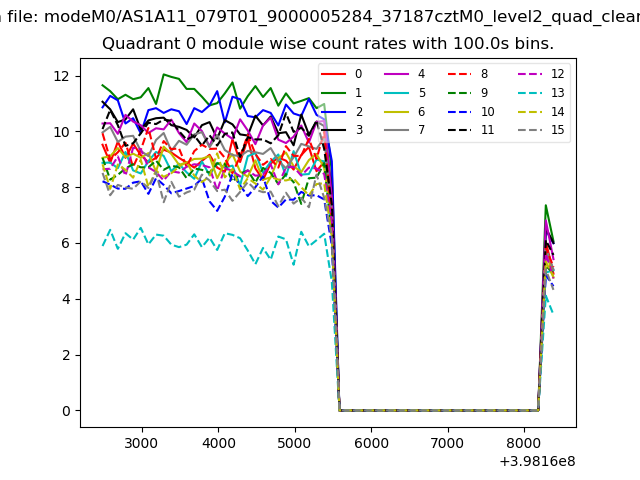 |
 |
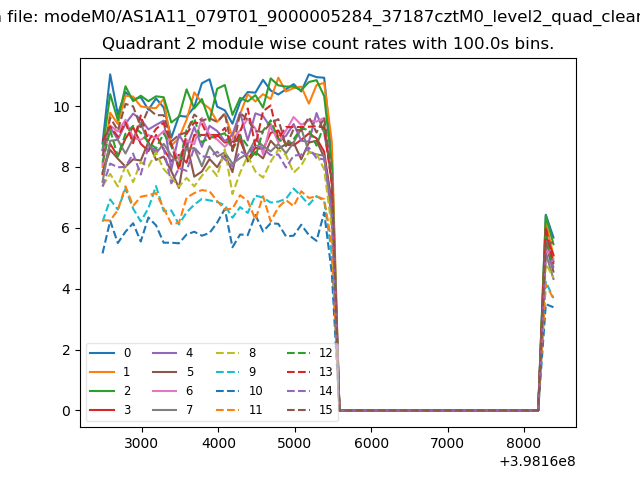
| Module-wise count rates for Quadrant B Data is divided into 100 sec bins |
 |
 |
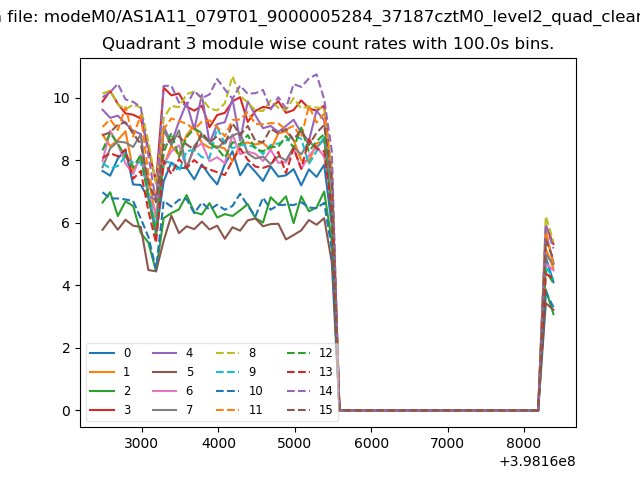
| Module-wise count rates for Quadrant C Data is divided into 100 sec bins |
 |
 |
| Module-wise count rates for Quadrant D Data is divided into 100 sec bins |
 |
 |
| Parameter | Plot |
|---|---|
| CZT HV Monitor | 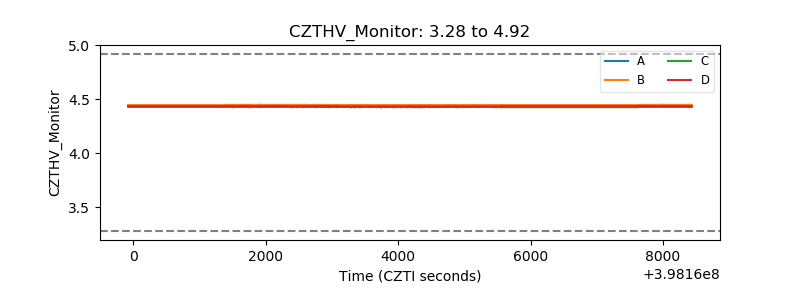 |
| D_VDD | 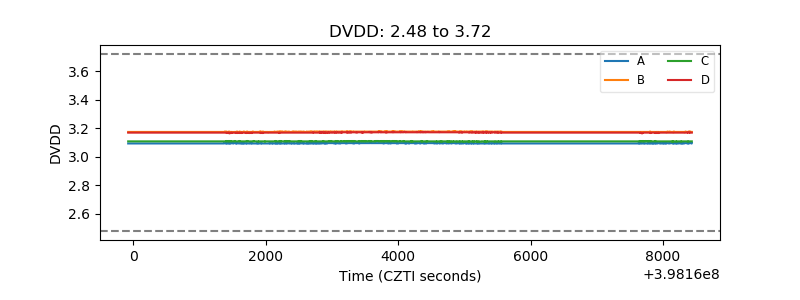 |
| Temperature 1 | 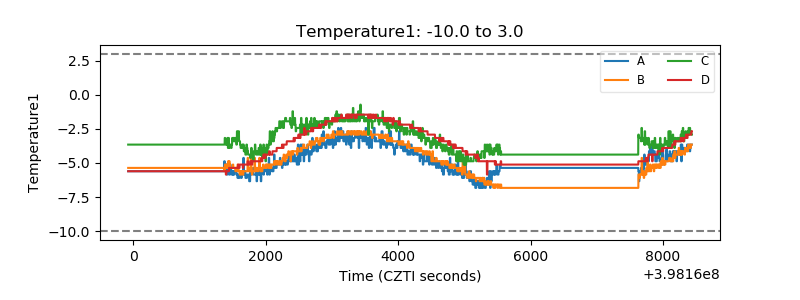 |
| Veto HV Monitor | 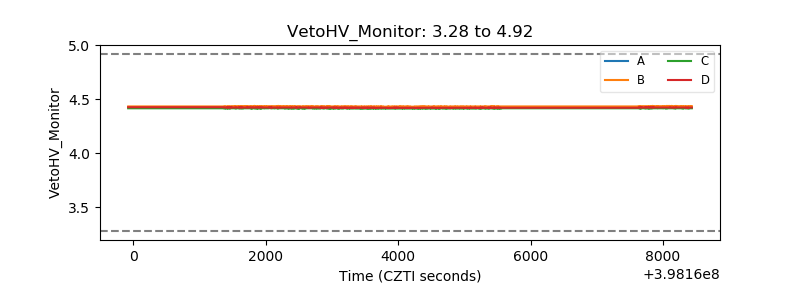 |
| Veto LLD | 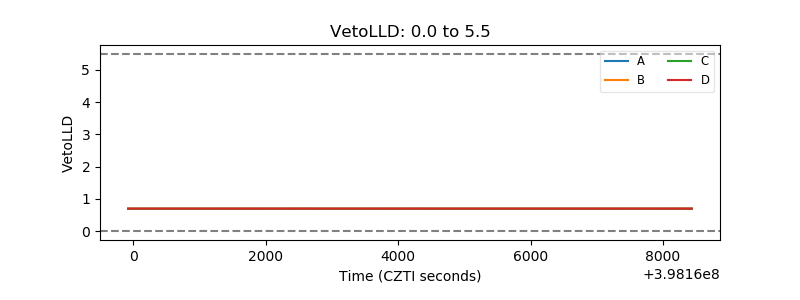 |
| Alpha Counter | 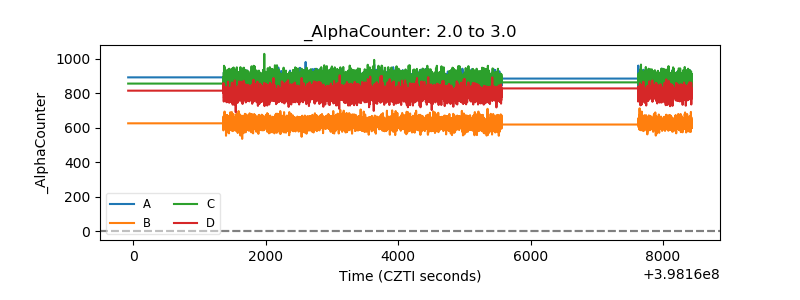 |
| _CPM_Rate | 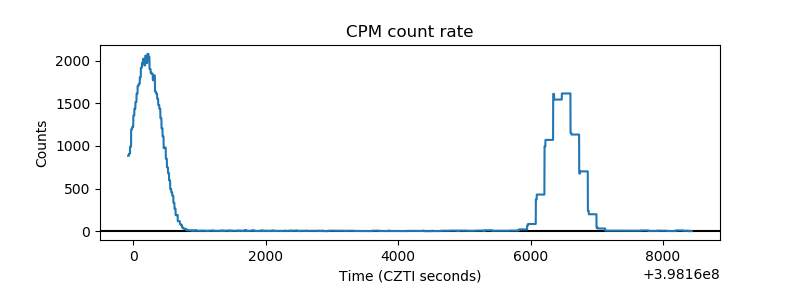 |
| CZT Counter | 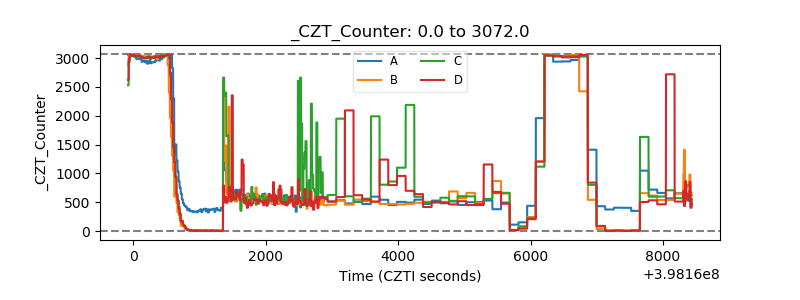 |
| +2.5 Volts monitor | 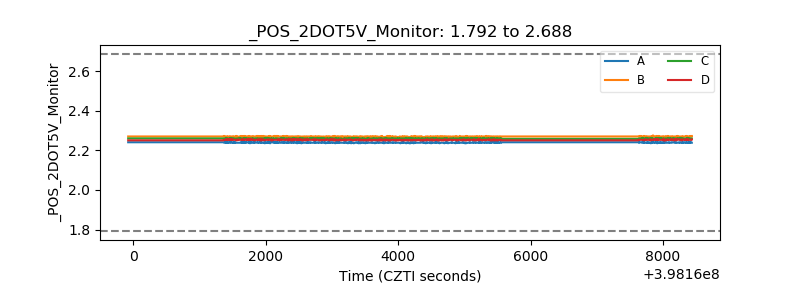 |
| +5 Volts monitor | 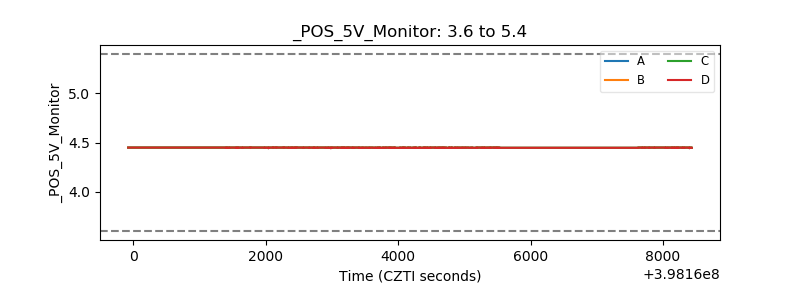 |
| _ROLL_ROT | 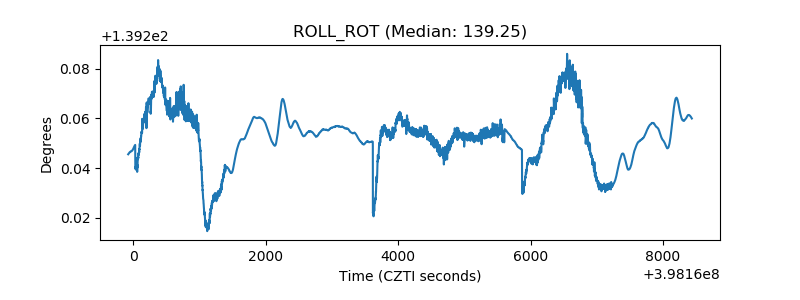 |
| _Roll_DEC | 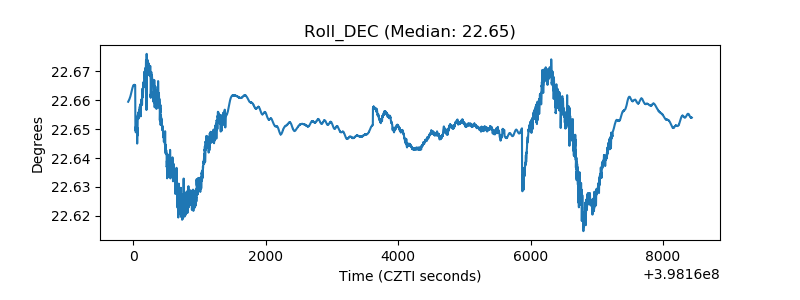 |
| _Roll_RA | 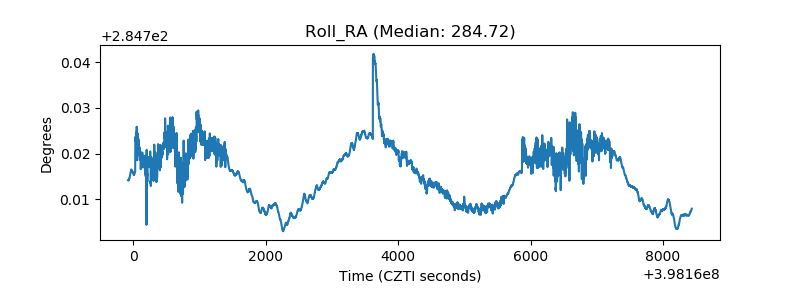 |
| Veto Counter | 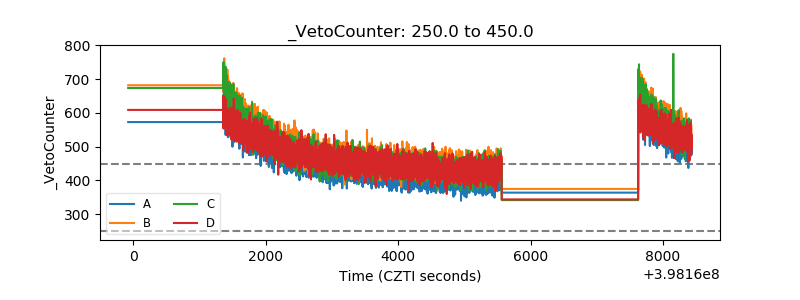 |