| Param | Original file | Final file |
|---|---|---|
| Filename | modeM0/AS1A11_079T01_9000005284_37188cztM0_level2.evt | modeM0/AS1A11_079T01_9000005284_37188cztM0_level2_quad_clean.evt |
| Size (bytes) | 486,861,120 | 84,381,120 |
| Size | 464.3 MB | 80.5 MB |
| Events in quadrant A | 2,769,531 | 579,567 |
| Events in quadrant B | 3,111,240 | 571,803 |
| Events in quadrant C | 5,330,743 | 528,984 |
| Events in quadrant D | 3,201,738 | 532,043 |
| Mode M9 | |||
|---|---|---|---|
| Quadrant | BADHDUFLAG | Total packets | Discarded packets |
| A | 0 | 33 | 0 |
| B | 0 | 33 | 0 |
| C | 0 | 33 | 0 |
| D | 0 | 34 | 0 |
| Mode SS | |||
|---|---|---|---|
| Quadrant | BADHDUFLAG | Total packets | Discarded packets |
| A | 0 | 100 | 0 |
| B | 0 | 100 | 0 |
| C | 0 | 100 | 0 |
| D | 0 | 100 | 0 |
| Mode M0 | |||
|---|---|---|---|
| Quadrant | BADHDUFLAG | Total packets | Discarded packets |
| A | 0 | 11103 | 3 |
| B | 0 | 12209 | 2 |
| C | 0 | 19089 | 2 |
| D | 0 | 12549 | 2 |
| Quadrant | Total seconds | Saturated seconds | Saturation percentage |
|---|---|---|---|
| A | 4884 | 21 | 0.429975% |
| B | 4884 | 141 | 2.886978% |
| C | 4884 | 896 | 18.345618% |
| D | 4884 | 156 | 3.194103% |
Noise dominated data is calculated using 1-second bins in cleaned event files. If a bin has >2000 counts, and if more than 50% of those come from <1% of pixels, then it is considered to be noise-dominated and hence unusable.
| Quadrant | # 1 sec bins | Bins with >0 counts | Bins with >2000 counts | High rate bins dominated by noise | Noise dominated (total time) | Noise dominated (detector-on time) | Marked lightcurve |
|---|---|---|---|---|---|---|---|
| A | 7007 | 4885 | 4 | 4 | 0.06% | 0.08% | 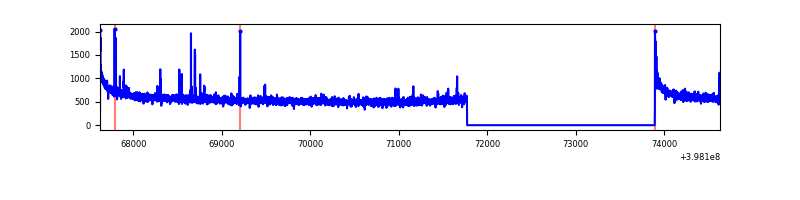 |
| B | 7007 | 4885 | 86 | 86 | 1.23% | 1.76% | 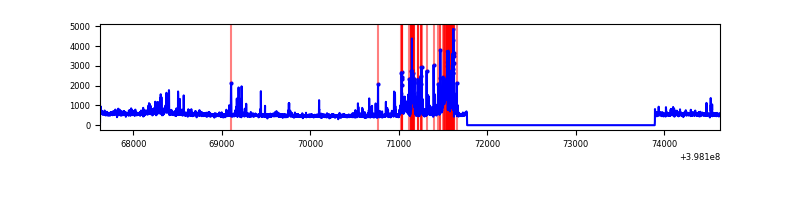 |
| C | 7007 | 4885 | 979 | 979 | 13.97% | 20.04% | 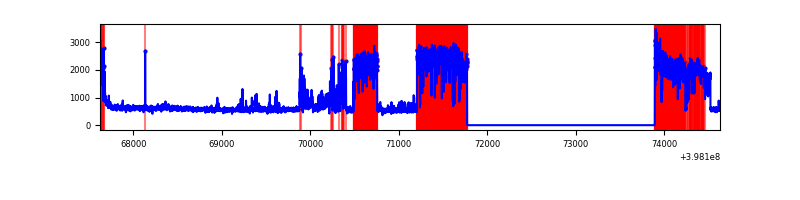 |
| D | 7007 | 4885 | 123 | 123 | 1.76% | 2.52% | 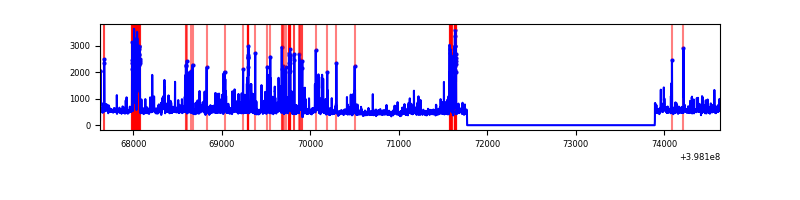 |
Top three noisy pixels from each quadrant. If the there are fewer than three noisy pixels in the level2.evt file, extra rows are filled as -1
| Pixel properties | Quadrant properties | ||||||
|---|---|---|---|---|---|---|---|
| Quadrant | DetID | PixID | Counts | Sigma | Mean | Median | Sigma |
| A | 10 | 83 | 248561 | 1939.5 | 641 | 632 | 127.8 |
| A | 9 | 143 | 31776 | 243.63 | 641 | 632 | 127.8 |
| A | 13 | 6 | 8072 | 58.2 | 641 | 632 | 127.8 |
| B | 5 | 184 | 421232 | 3566.98 | 619 | 605 | 117.9 |
| B | 5 | 172 | 127652 | 1077.38 | 619 | 605 | 117.9 |
| B | 0 | 213 | 73626 | 619.23 | 619 | 605 | 117.9 |
| C | 10 | 49 | 2380098 | 17662.69 | 586 | 592 | 134.7 |
| C | 14 | 254 | 223467 | 1654.37 | 586 | 592 | 134.7 |
| C | 15 | 214 | 202919 | 1501.84 | 586 | 592 | 134.7 |
| D | 1 | 52 | 262408 | 1775.16 | 609 | 596 | 147.5 |
| D | 2 | 249 | 180253 | 1218.13 | 609 | 596 | 147.5 |
| D | 10 | 118 | 159518 | 1077.54 | 609 | 596 | 147.5 |
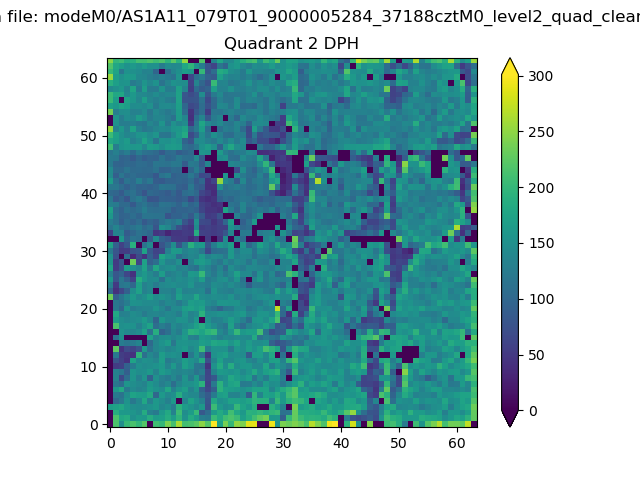
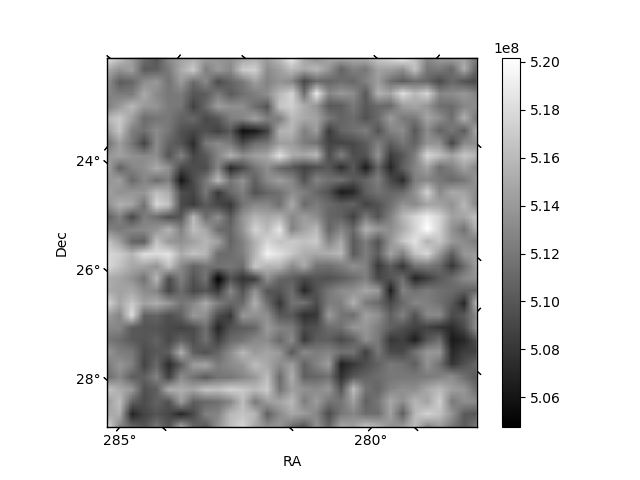
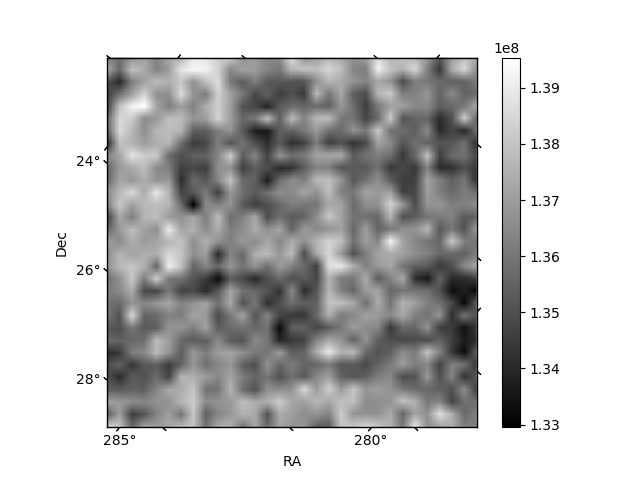
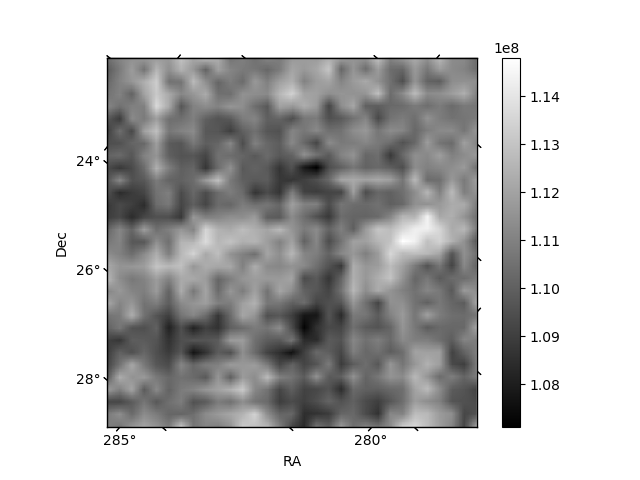
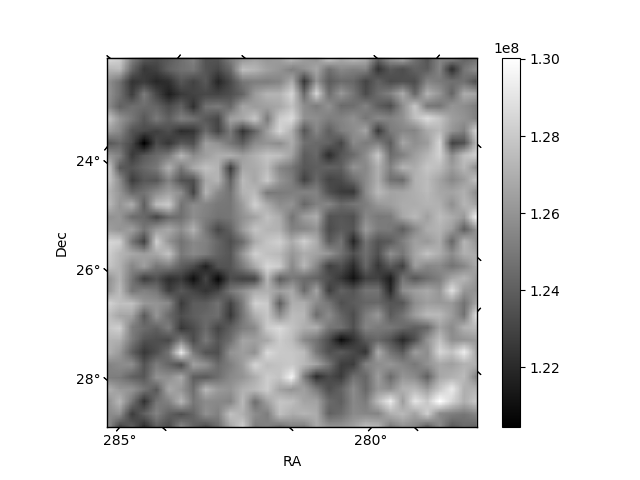
Histogram calculated using DETX and DETY for each event in the final _common_clean file
| Quadrant A | 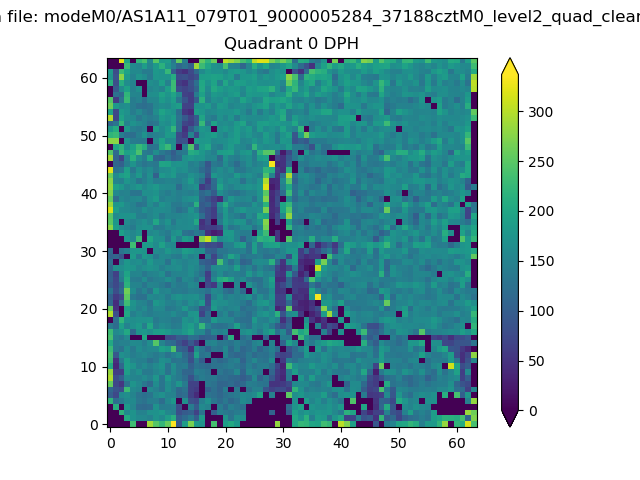 |
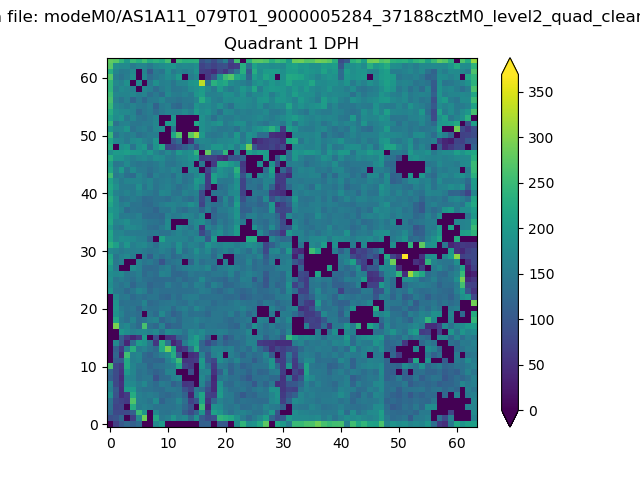 |
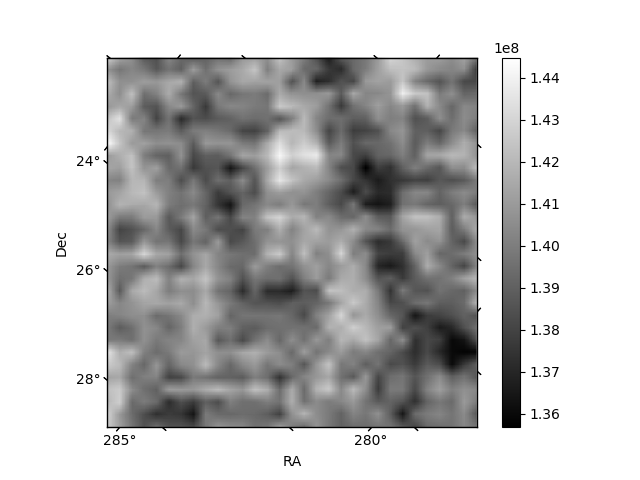
Quadrant B |
|---|---|---|---|
| Quadrant D | 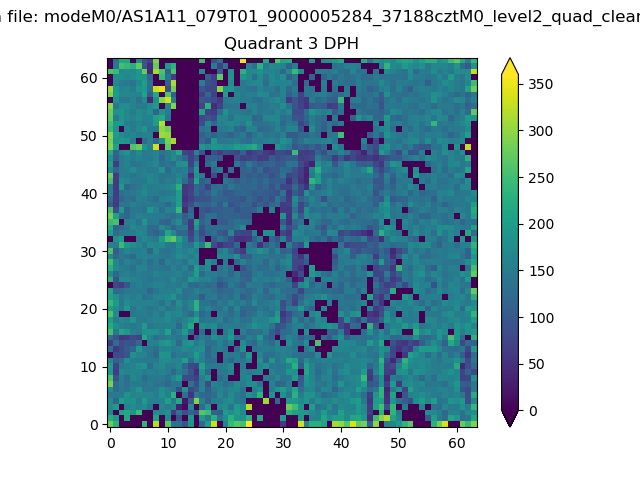 |
 |
Quadrant C |
| Plot type | Count rate plots | Images |
|---|---|---|
| Comparison with Poisson distribution Blue bars denote a histogram of data divided into 1 sec bins. Red curve is a Poisson curve with rate = median count rate of data. |
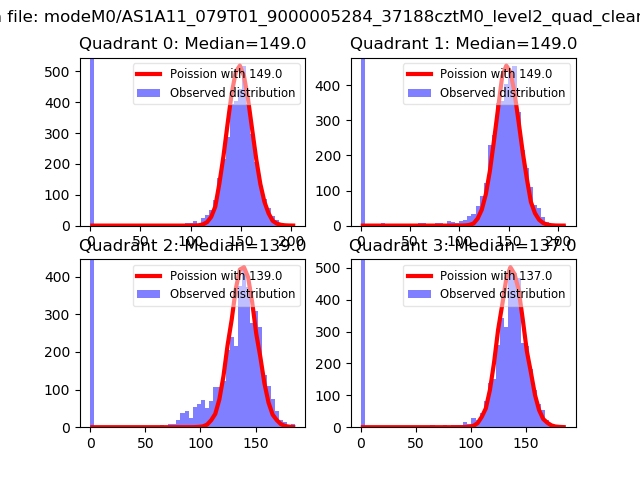 |
 |
| Quadrant-wise count rates Data is divided into 100 sec bins |
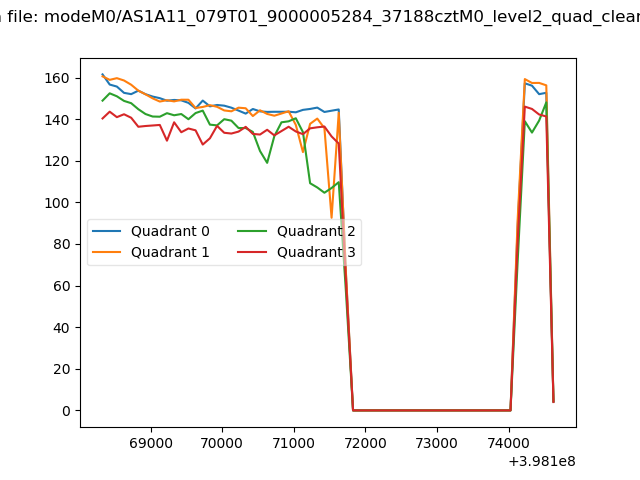 |
|
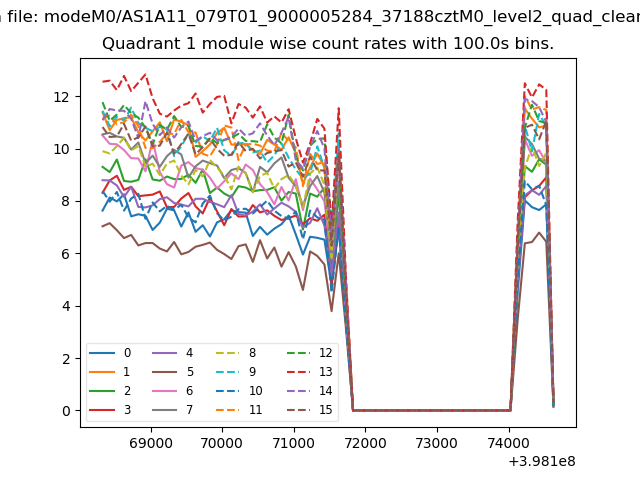
| Module-wise count rates for Quadrant A Data is divided into 100 sec bins |
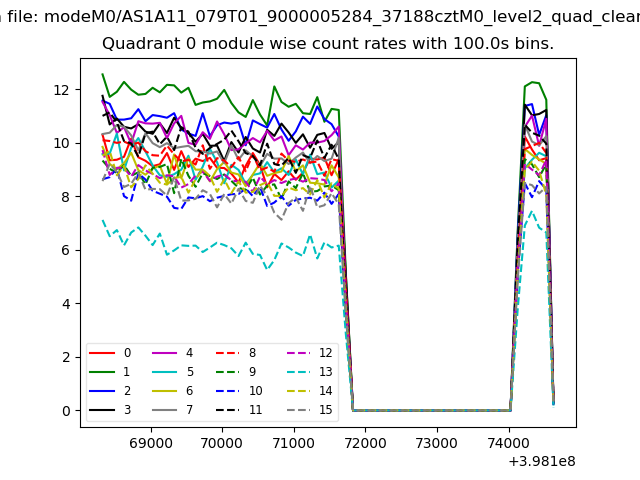 |
 |
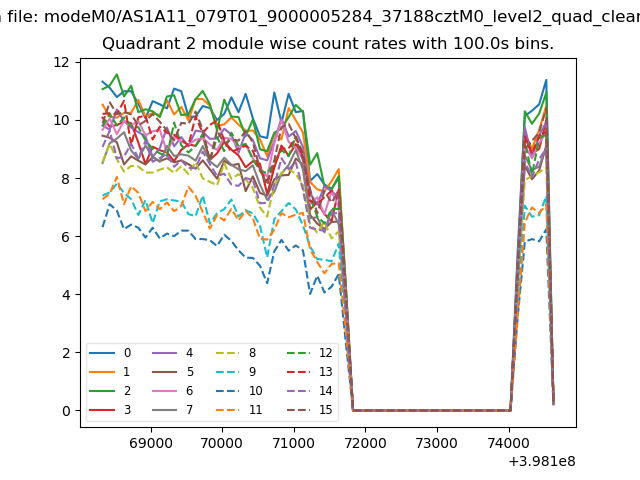
| Module-wise count rates for Quadrant B Data is divided into 100 sec bins |
 |
 |
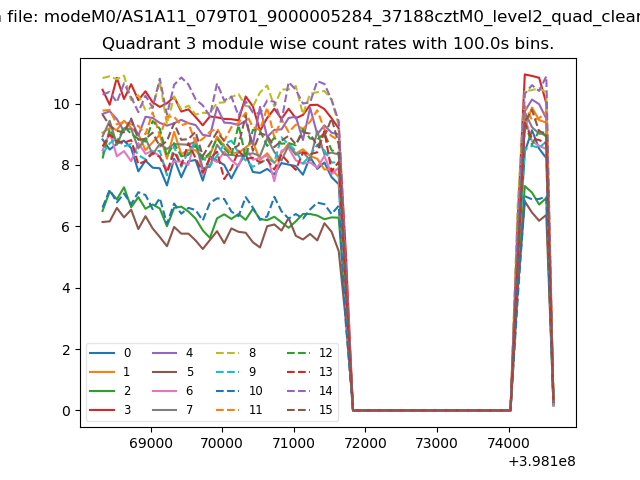
| Module-wise count rates for Quadrant C Data is divided into 100 sec bins |
 |
 |
| Module-wise count rates for Quadrant D Data is divided into 100 sec bins |
 |
 |
| Parameter | Plot |
|---|---|
| CZT HV Monitor | 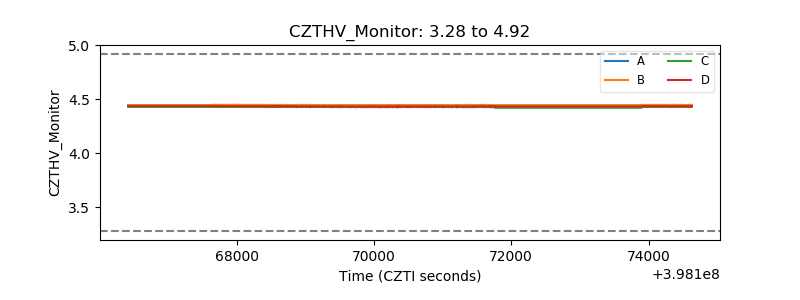 |
| D_VDD | 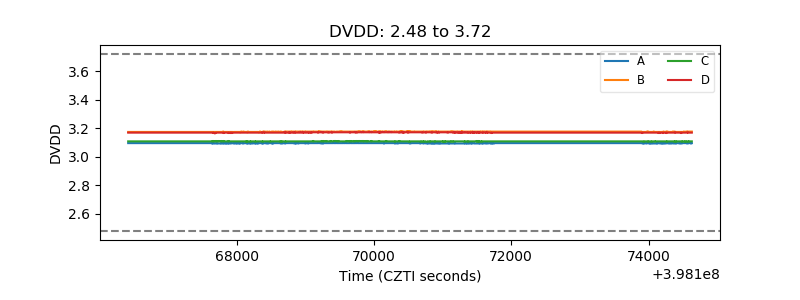 |
| Temperature 1 | 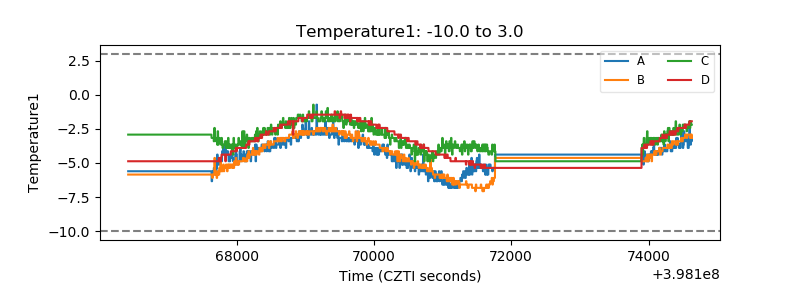 |
| Veto HV Monitor |  |
| Veto LLD | 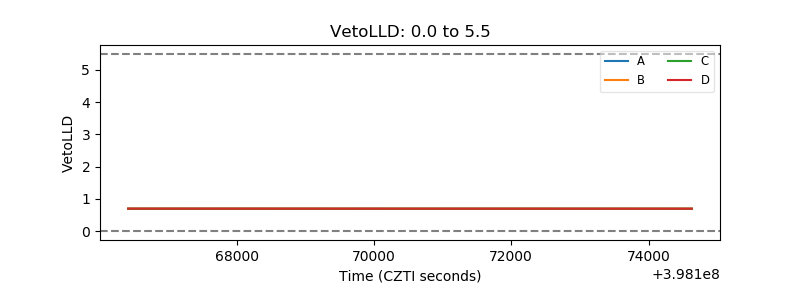 |
| Alpha Counter | 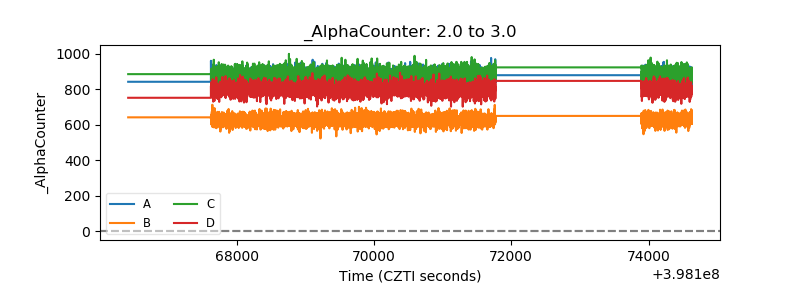 |
| _CPM_Rate | 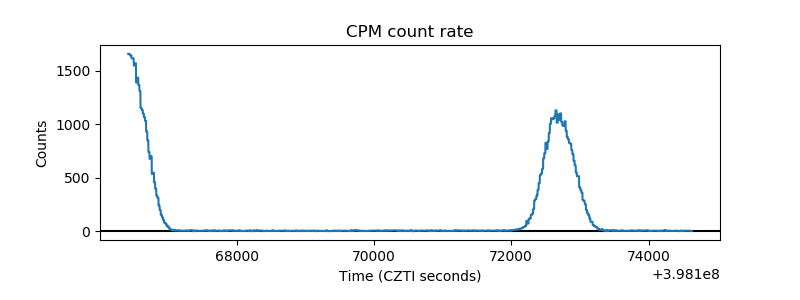 |
| CZT Counter | 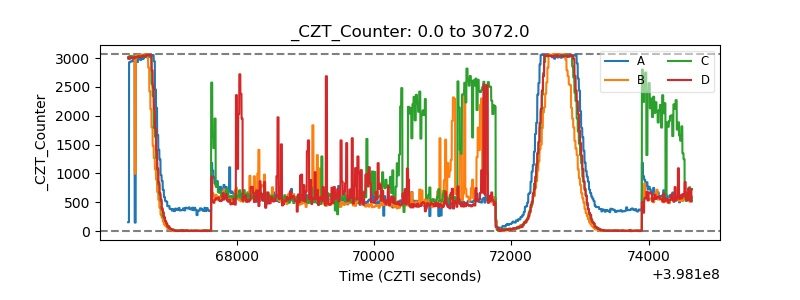 |
| +2.5 Volts monitor | 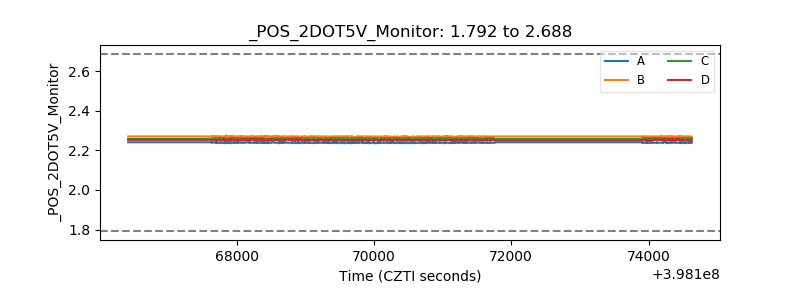 |
| +5 Volts monitor | 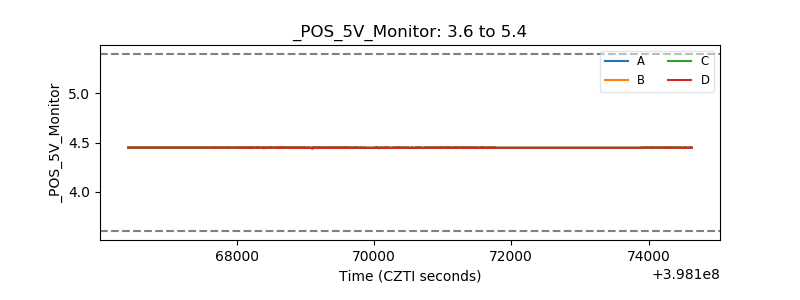 |
| _ROLL_ROT | 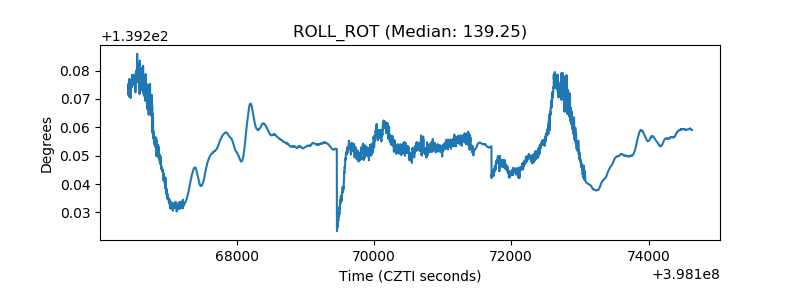 |
| _Roll_DEC | 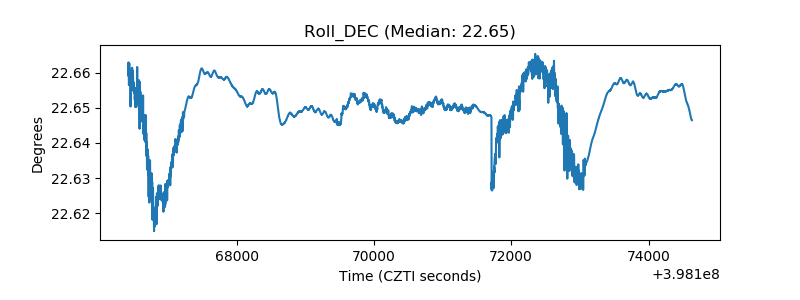 |
| _Roll_RA | 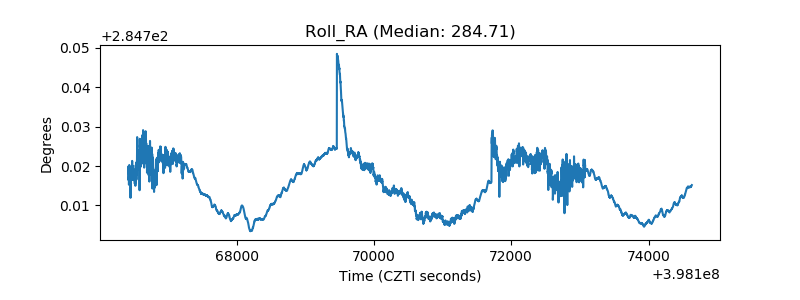 |
| Veto Counter | 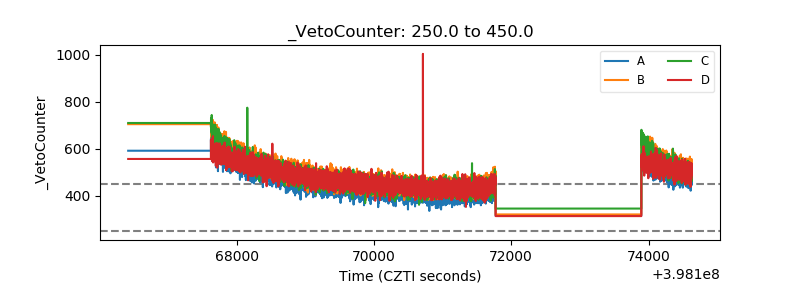 |