| Param | Original file | Final file |
|---|---|---|
| Filename | modeM0/AS1A11_079T01_9000005284_37189cztM0_level2.evt | modeM0/AS1A11_079T01_9000005284_37189cztM0_level2_quad_clean.evt |
| Size (bytes) | 453,274,560 | 96,431,040 |
| Size | 432.3 MB | 92.0 MB |
| Events in quadrant A | 2,803,645 | 661,644 |
| Events in quadrant B | 2,883,964 | 657,715 |
| Events in quadrant C | 4,546,325 | 629,096 |
| Events in quadrant D | 3,145,181 | 612,213 |
| Mode M9 | |||
|---|---|---|---|
| Quadrant | BADHDUFLAG | Total packets | Discarded packets |
| A | 0 | 43 | 0 |
| B | 0 | 43 | 0 |
| C | 0 | 43 | 0 |
| D | 0 | 43 | 0 |
| Mode SS | |||
|---|---|---|---|
| Quadrant | BADHDUFLAG | Total packets | Discarded packets |
| A | 0 | 106 | 0 |
| B | 0 | 106 | 0 |
| C | 0 | 106 | 0 |
| D | 0 | 106 | 0 |
| Mode M0 | |||
|---|---|---|---|
| Quadrant | BADHDUFLAG | Total packets | Discarded packets |
| A | 0 | 11374 | 3 |
| B | 0 | 11590 | 2 |
| C | 0 | 16631 | 2 |
| D | 0 | 12585 | 2 |
| Quadrant | Total seconds | Saturated seconds | Saturation percentage |
|---|---|---|---|
| A | 5136 | 20 | 0.389408% |
| B | 5136 | 65 | 1.265576% |
| C | 5136 | 488 | 9.501558% |
| D | 5136 | 108 | 2.102804% |
Noise dominated data is calculated using 1-second bins in cleaned event files. If a bin has >2000 counts, and if more than 50% of those come from <1% of pixels, then it is considered to be noise-dominated and hence unusable.
| Quadrant | # 1 sec bins | Bins with >0 counts | Bins with >2000 counts | High rate bins dominated by noise | Noise dominated (total time) | Noise dominated (detector-on time) | Marked lightcurve |
|---|---|---|---|---|---|---|---|
| A | 9413 | 5138 | 5 | 5 | 0.05% | 0.10% | 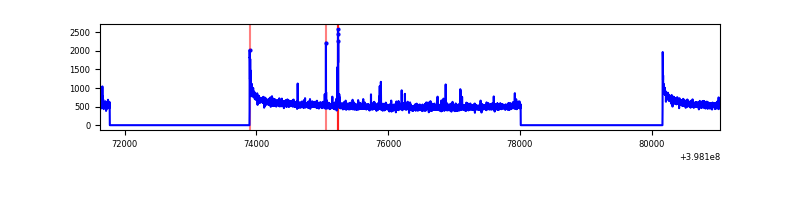 |
| B | 9413 | 5138 | 43 | 43 | 0.46% | 0.84% | 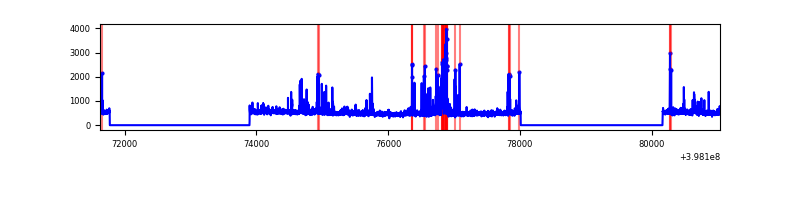 |
| C | 9413 | 5138 | 507 | 507 | 5.39% | 9.87% | 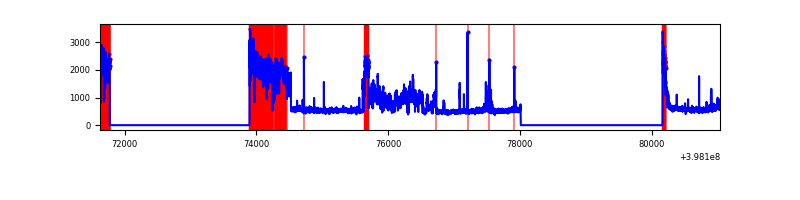 |
| D | 9413 | 5138 | 90 | 90 | 0.96% | 1.75% | 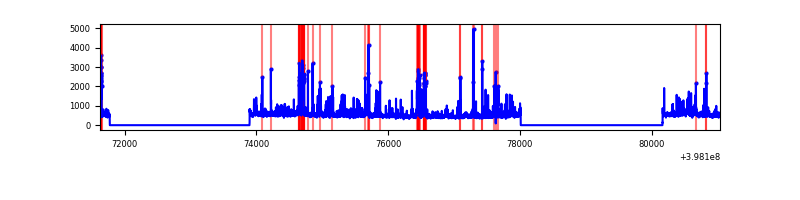 |
Top three noisy pixels from each quadrant. If the there are fewer than three noisy pixels in the level2.evt file, extra rows are filled as -1
| Pixel properties | Quadrant properties | ||||||
|---|---|---|---|---|---|---|---|
| Quadrant | DetID | PixID | Counts | Sigma | Mean | Median | Sigma |
| A | 10 | 83 | 256915 | 1971.33 | 647 | 637 | 130.0 |
| A | 9 | 143 | 38038 | 287.69 | 647 | 637 | 130.0 |
| A | 13 | 254 | 8479 | 60.32 | 647 | 637 | 130.0 |
| B | 5 | 172 | 221829 | 1842.27 | 631 | 617 | 120.1 |
| B | 5 | 184 | 119768 | 992.3 | 631 | 617 | 120.1 |
| B | 0 | 155 | 32550 | 265.94 | 631 | 617 | 120.1 |
| C | 10 | 49 | 1668174 | 11910.09 | 606 | 610 | 140.0 |
| C | 15 | 214 | 215562 | 1535.23 | 606 | 610 | 140.0 |
| C | 0 | 10 | 193211 | 1375.6 | 606 | 610 | 140.0 |
| D | 2 | 249 | 202928 | 1339.25 | 623 | 608 | 151.1 |
| D | 13 | 249 | 199550 | 1316.89 | 623 | 608 | 151.1 |
| D | 2 | 153 | 105945 | 697.28 | 623 | 608 | 151.1 |
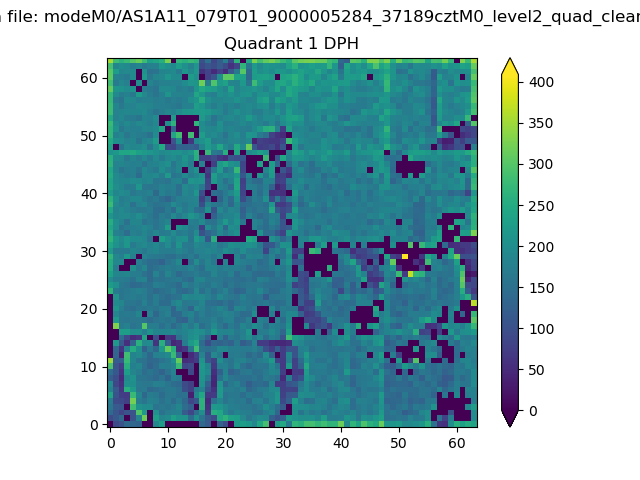
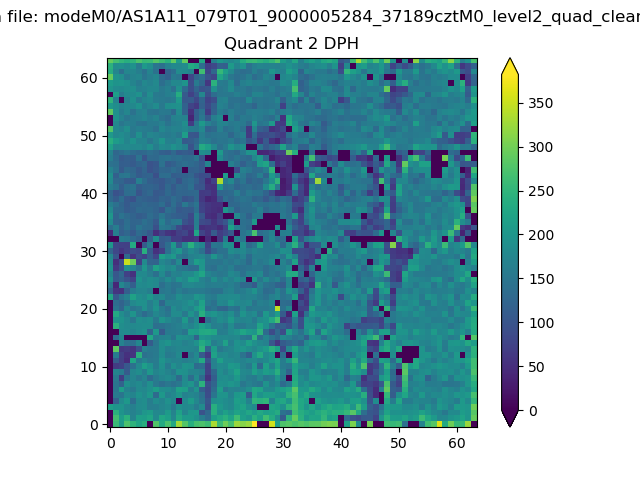
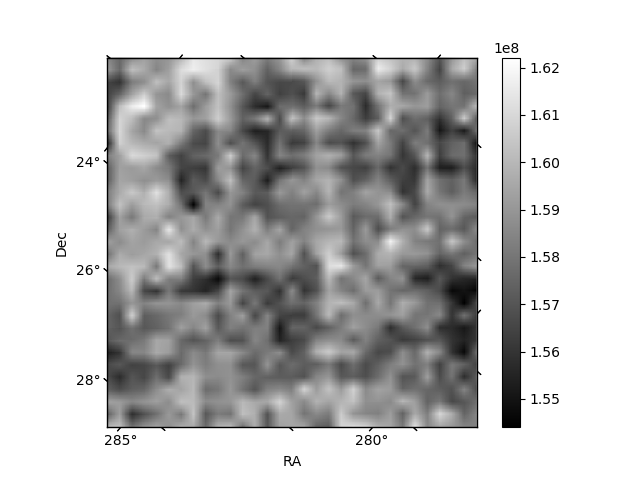
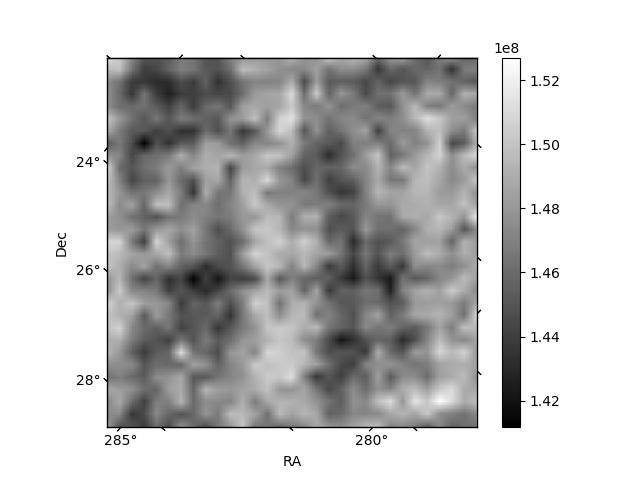
Histogram calculated using DETX and DETY for each event in the final _common_clean file
| Quadrant A |  |
 |
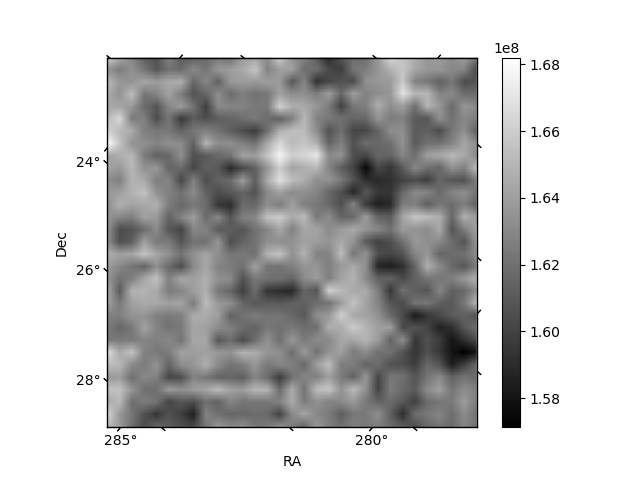
Quadrant B |
|---|---|---|---|
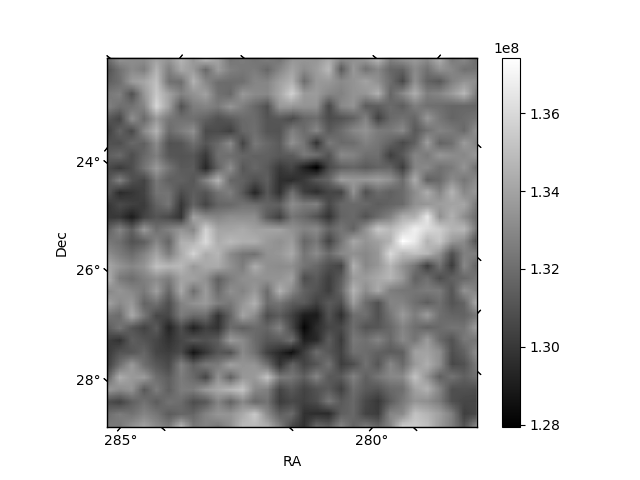
| Quadrant D |  |
 |
Quadrant C |
| Plot type | Count rate plots | Images |
|---|---|---|
| Comparison with Poisson distribution Blue bars denote a histogram of data divided into 1 sec bins. Red curve is a Poisson curve with rate = median count rate of data. |
 |
 |
| Quadrant-wise count rates Data is divided into 100 sec bins |
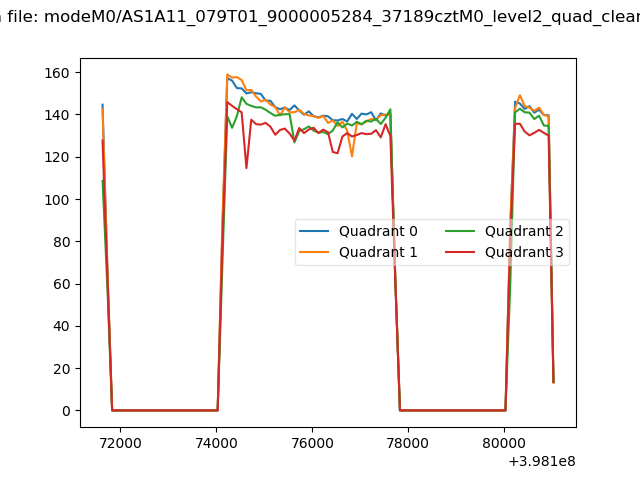 |
|
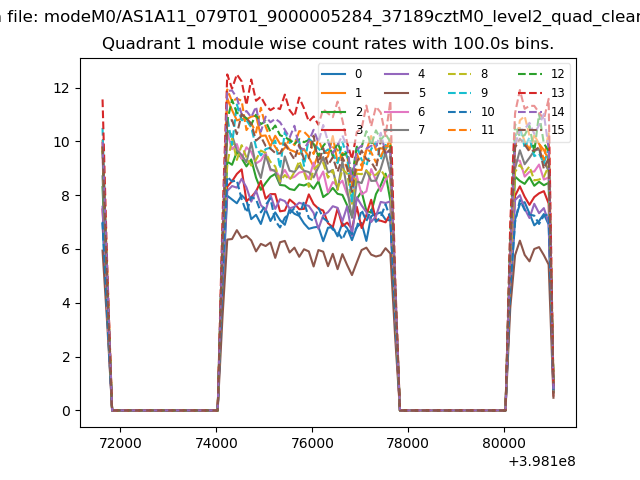
| Module-wise count rates for Quadrant A Data is divided into 100 sec bins |
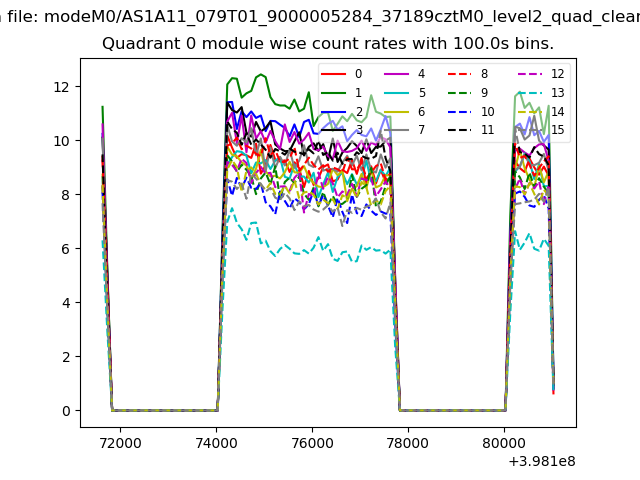 |
 |
| Module-wise count rates for Quadrant B Data is divided into 100 sec bins |
 |
 |
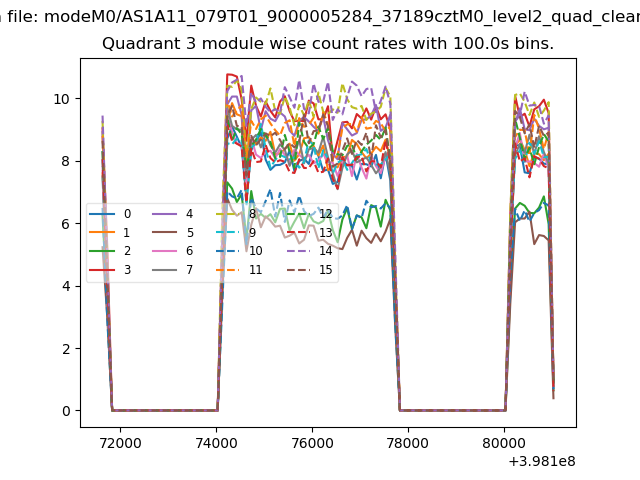
| Module-wise count rates for Quadrant C Data is divided into 100 sec bins |
 |
 |
| Module-wise count rates for Quadrant D Data is divided into 100 sec bins |
 |
 |
| Parameter | Plot |
|---|---|
| CZT HV Monitor | 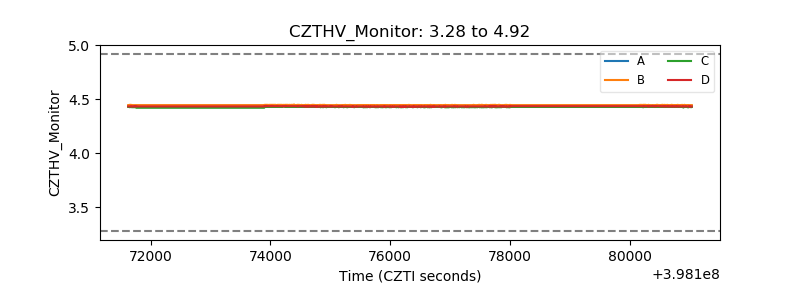 |
| D_VDD | 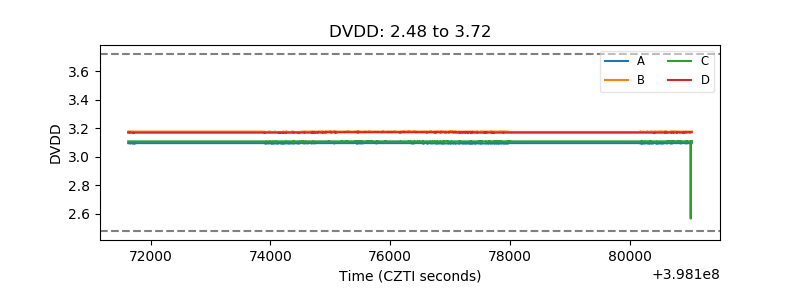 |
| Temperature 1 | 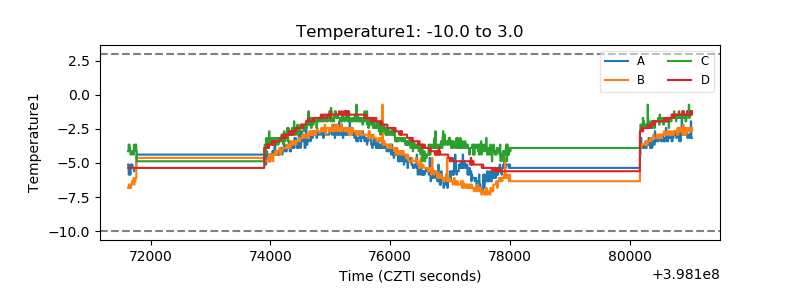 |
| Veto HV Monitor | 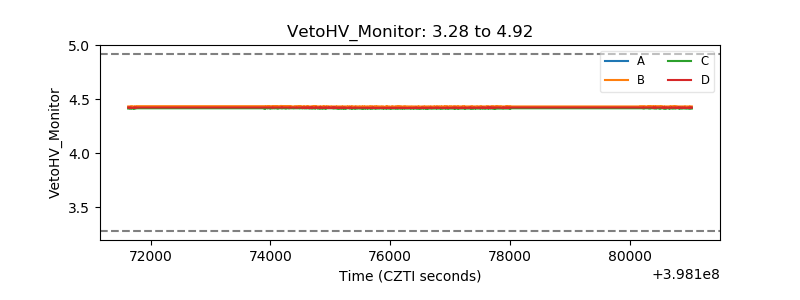 |
| Veto LLD | 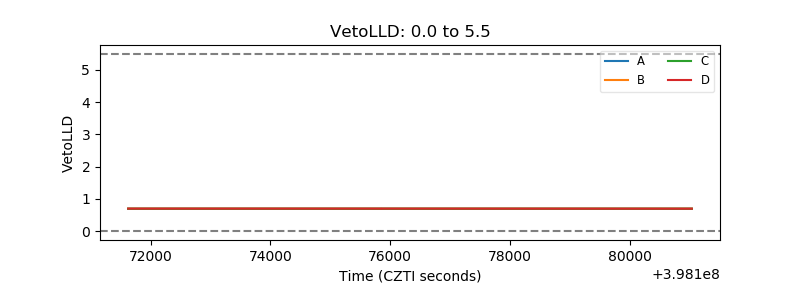 |
| Alpha Counter | 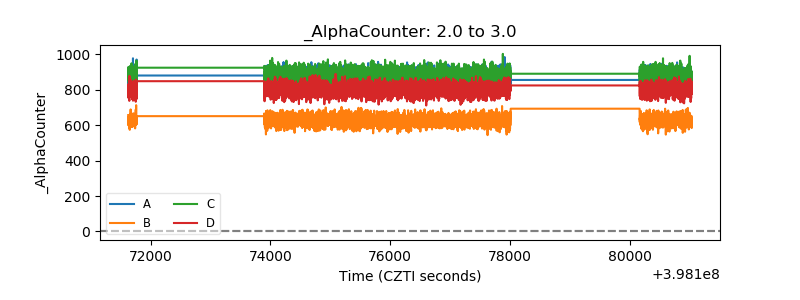 |
| _CPM_Rate | 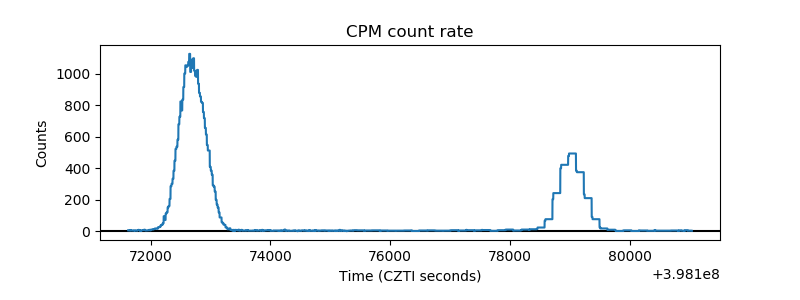 |
| CZT Counter |  |
| +2.5 Volts monitor | 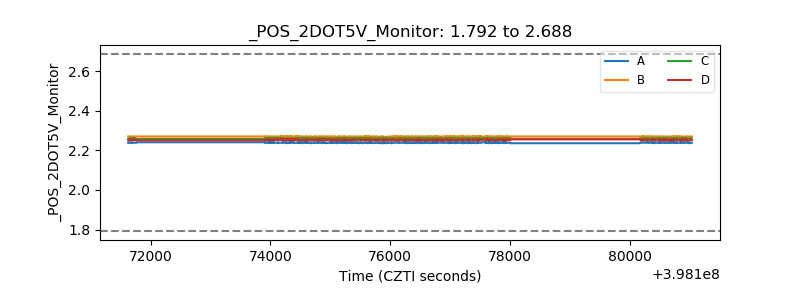 |
| +5 Volts monitor |  |
| _ROLL_ROT | 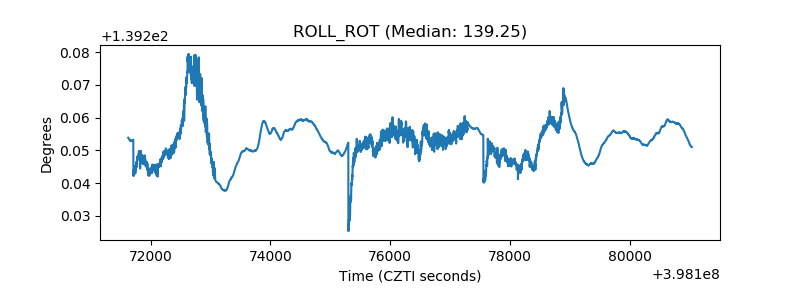 |
| _Roll_DEC | 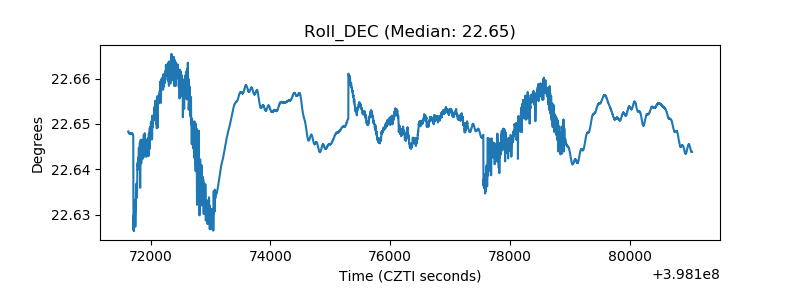 |
| _Roll_RA |  |
| Veto Counter | 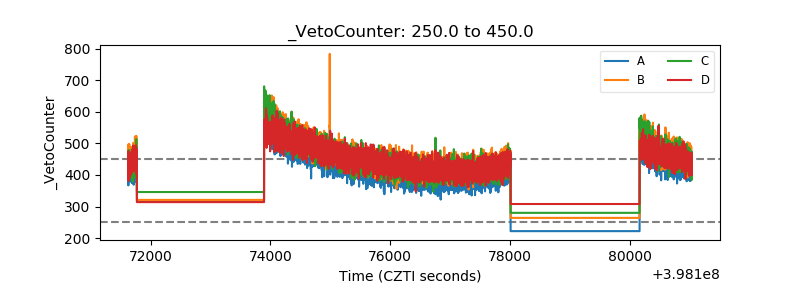 |