| Param | Original file | Final file |
|---|---|---|
| Filename | modeM0/AS1A11_079T01_9000005284_37190cztM0_level2.evt | modeM0/AS1A11_079T01_9000005284_37190cztM0_level2_quad_clean.evt |
| Size (bytes) | 422,000,640 | 88,470,720 |
| Size | 402.5 MB | 84.4 MB |
| Events in quadrant A | 2,708,830 | 597,289 |
| Events in quadrant B | 2,788,001 | 593,071 |
| Events in quadrant C | 3,539,006 | 574,431 |
| Events in quadrant D | 3,387,208 | 546,070 |
| Mode M9 | |||
|---|---|---|---|
| Quadrant | BADHDUFLAG | Total packets | Discarded packets |
| A | 0 | 33 | 0 |
| B | 0 | 33 | 0 |
| C | 0 | 33 | 0 |
| D | 0 | 34 | 0 |
| Mode SS | |||
|---|---|---|---|
| Quadrant | BADHDUFLAG | Total packets | Discarded packets |
| A | 0 | 108 | 0 |
| B | 0 | 108 | 0 |
| C | 0 | 108 | 0 |
| D | 0 | 108 | 0 |
| Mode M0 | |||
|---|---|---|---|
| Quadrant | BADHDUFLAG | Total packets | Discarded packets |
| A | 0 | 11310 | 3 |
| B | 0 | 11512 | 2 |
| C | 0 | 13557 | 2 |
| D | 0 | 13403 | 2 |
| Quadrant | Total seconds | Saturated seconds | Saturation percentage |
|---|---|---|---|
| A | 5254 | 11 | 0.209364% |
| B | 5254 | 77 | 1.465550% |
| C | 5254 | 196 | 3.730491% |
| D | 5254 | 246 | 4.682147% |
Noise dominated data is calculated using 1-second bins in cleaned event files. If a bin has >2000 counts, and if more than 50% of those come from <1% of pixels, then it is considered to be noise-dominated and hence unusable.
| Quadrant | # 1 sec bins | Bins with >0 counts | Bins with >2000 counts | High rate bins dominated by noise | Noise dominated (total time) | Noise dominated (detector-on time) | Marked lightcurve |
|---|---|---|---|---|---|---|---|
| A | 7257 | 5255 | 1 | 1 | 0.01% | 0.02% | 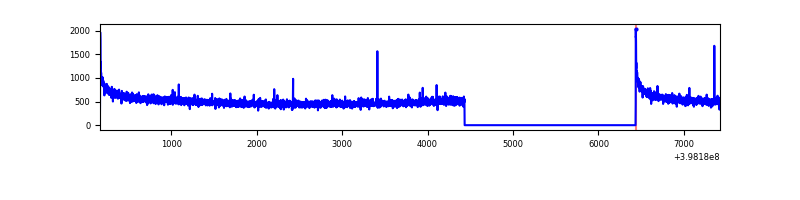 |
| B | 7257 | 5255 | 54 | 54 | 0.74% | 1.03% | 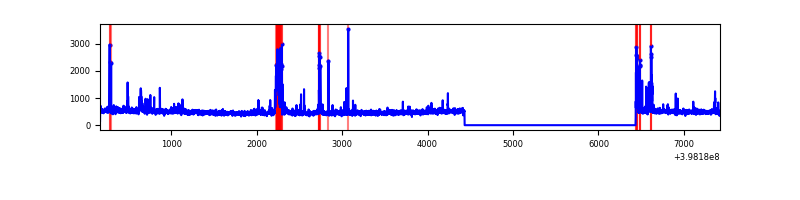 |
| C | 7257 | 5255 | 208 | 208 | 2.87% | 3.96% | 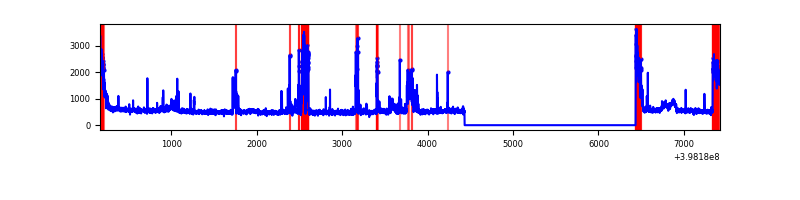 |
| D | 7257 | 5255 | 219 | 219 | 3.02% | 4.17% | 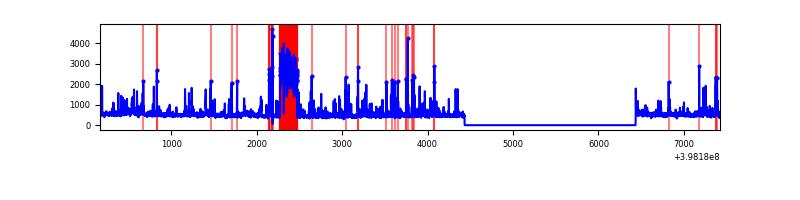 |
Top three noisy pixels from each quadrant. If the there are fewer than three noisy pixels in the level2.evt file, extra rows are filled as -1
| Pixel properties | Quadrant properties | ||||||
|---|---|---|---|---|---|---|---|
| Quadrant | DetID | PixID | Counts | Sigma | Mean | Median | Sigma |
| A | 10 | 83 | 261591 | 2062.82 | 628 | 616 | 126.5 |
| A | 13 | 254 | 8699 | 63.89 | 628 | 616 | 126.5 |
| A | 13 | 6 | 7401 | 53.63 | 628 | 616 | 126.5 |
| B | 5 | 172 | 162841 | 1373.65 | 614 | 598 | 118.1 |
| B | 0 | 229 | 132635 | 1117.91 | 614 | 598 | 118.1 |
| B | 0 | 190 | 40194 | 335.25 | 614 | 598 | 118.1 |
| C | 0 | 207 | 360790 | 2576.52 | 601 | 605 | 139.8 |
| C | 0 | 10 | 231232 | 1649.75 | 601 | 605 | 139.8 |
| C | 10 | 49 | 228282 | 1628.65 | 601 | 605 | 139.8 |
| D | 2 | 249 | 595937 | 4062.51 | 598 | 582 | 146.5 |
| D | 13 | 249 | 168675 | 1147.01 | 598 | 582 | 146.5 |
| D | 1 | 52 | 154491 | 1050.23 | 598 | 582 | 146.5 |
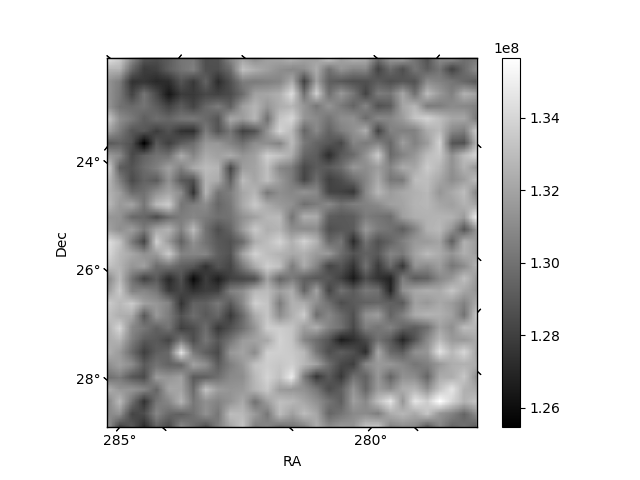
Histogram calculated using DETX and DETY for each event in the final _common_clean file
| Quadrant A | 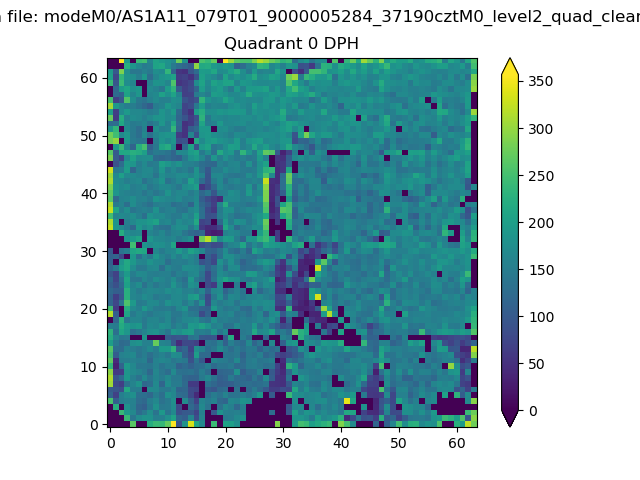 |
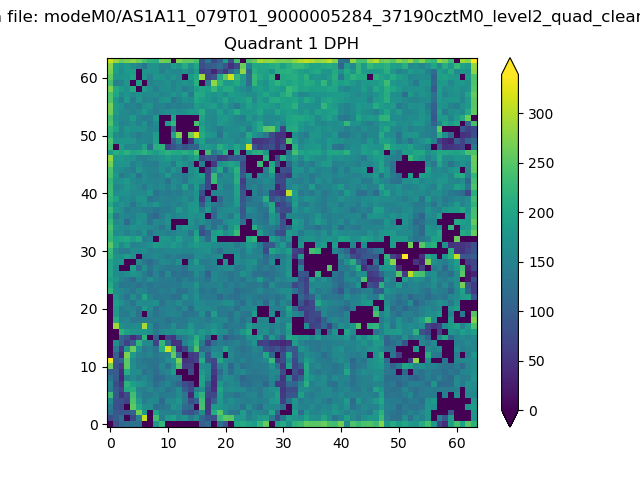 |
Quadrant B |
|---|---|---|---|
| Quadrant D | 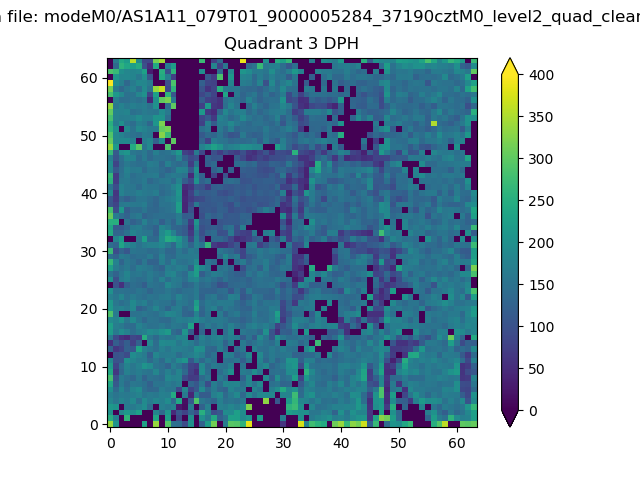 |
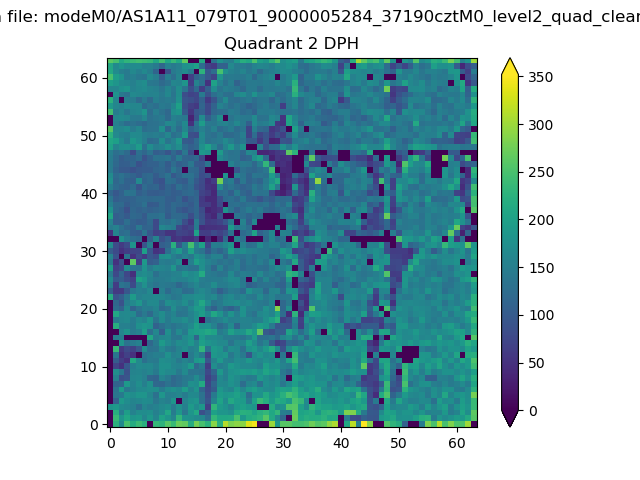 |
Quadrant C |
| Plot type | Count rate plots | Images |
|---|---|---|
| Comparison with Poisson distribution Blue bars denote a histogram of data divided into 1 sec bins. Red curve is a Poisson curve with rate = median count rate of data. |
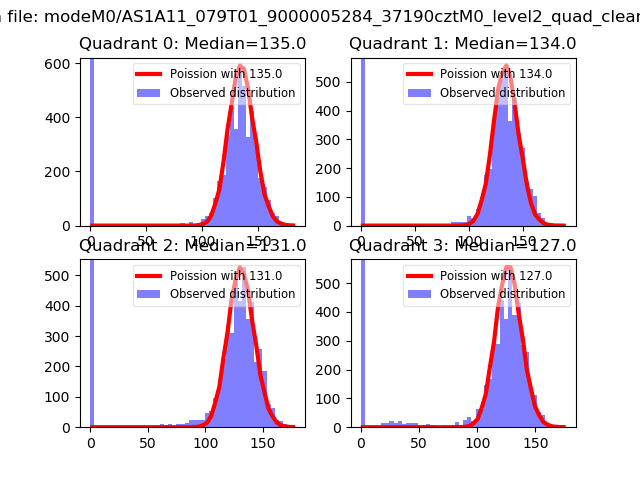 |
 |
| Quadrant-wise count rates Data is divided into 100 sec bins |
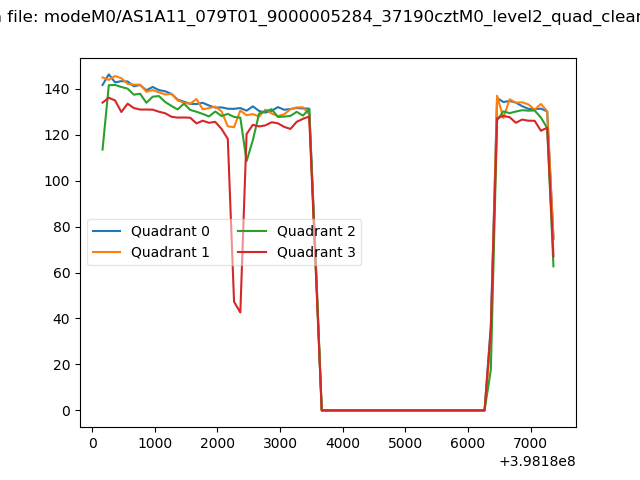 |
|
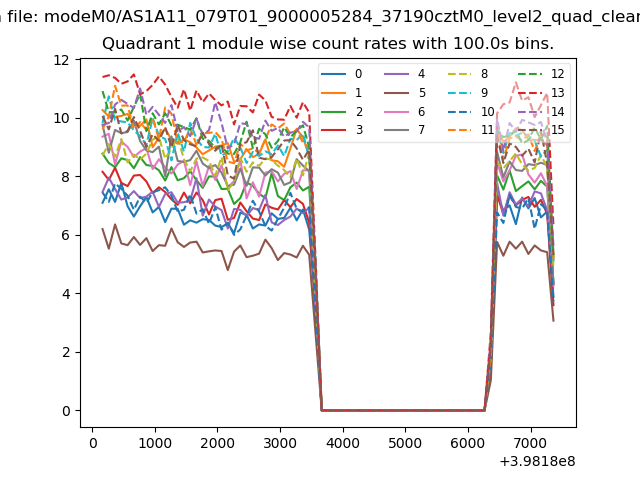
| Module-wise count rates for Quadrant A Data is divided into 100 sec bins |
 |
 |
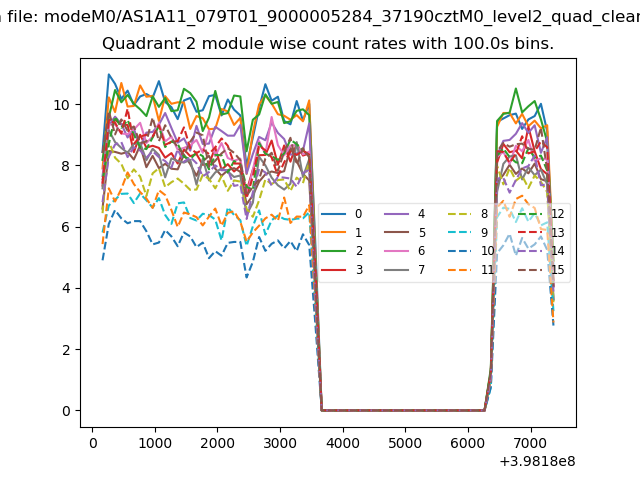
| Module-wise count rates for Quadrant B Data is divided into 100 sec bins |
 |
 |
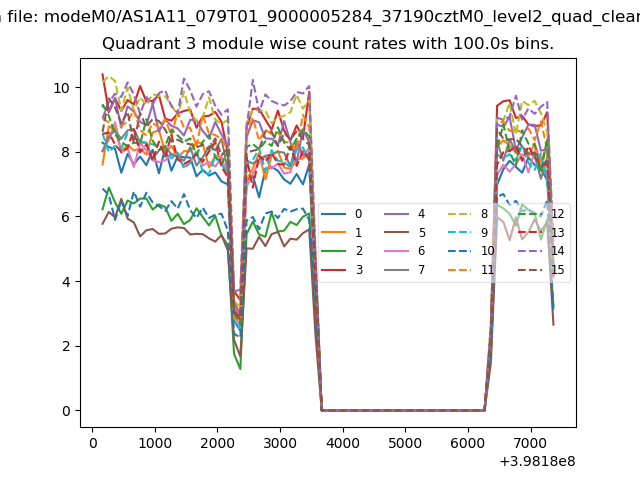
| Module-wise count rates for Quadrant C Data is divided into 100 sec bins |
 |
 |
| Module-wise count rates for Quadrant D Data is divided into 100 sec bins |
 |
 |
| Parameter | Plot |
|---|---|
| CZT HV Monitor | 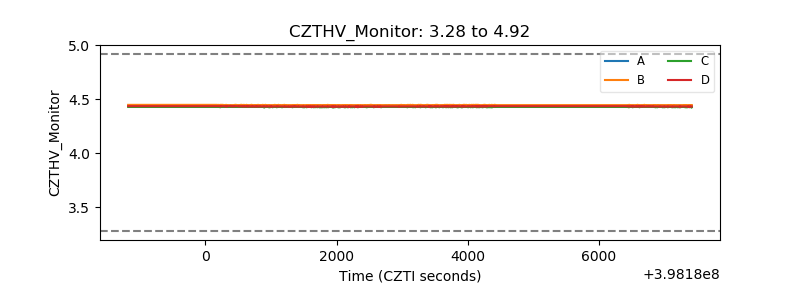 |
| D_VDD | 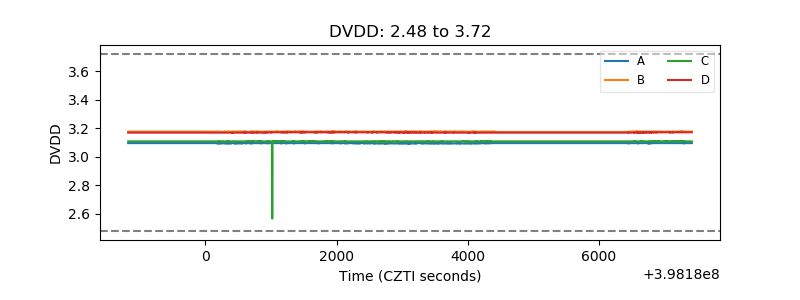 |
| Temperature 1 | 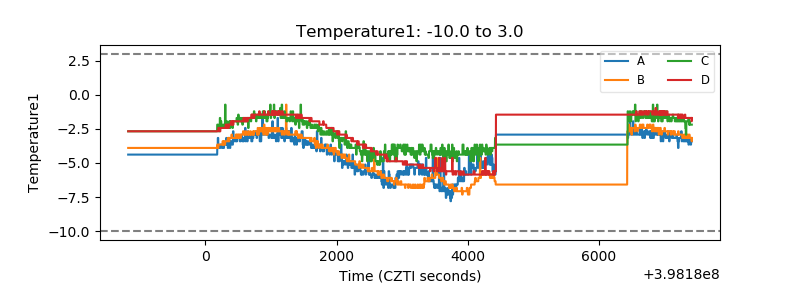 |
| Veto HV Monitor |  |
| Veto LLD | 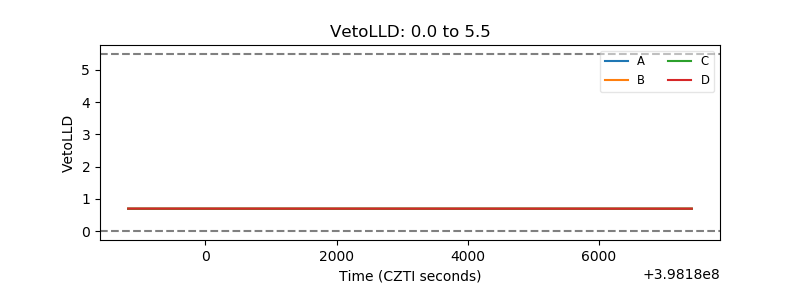 |
| Alpha Counter | 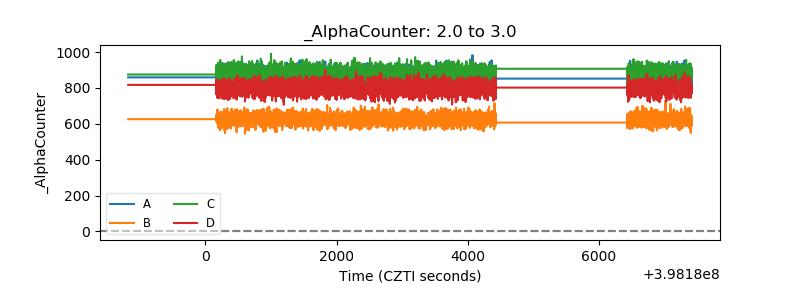 |
| _CPM_Rate | 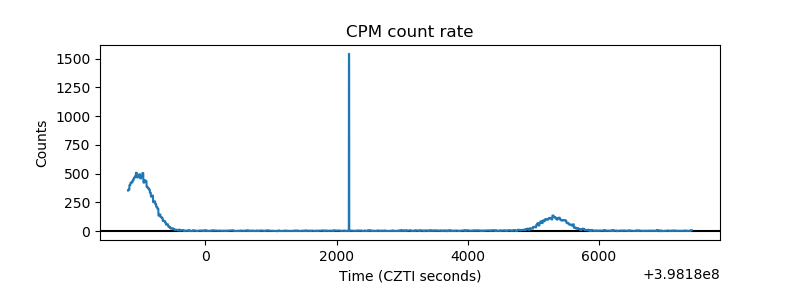 |
| CZT Counter | 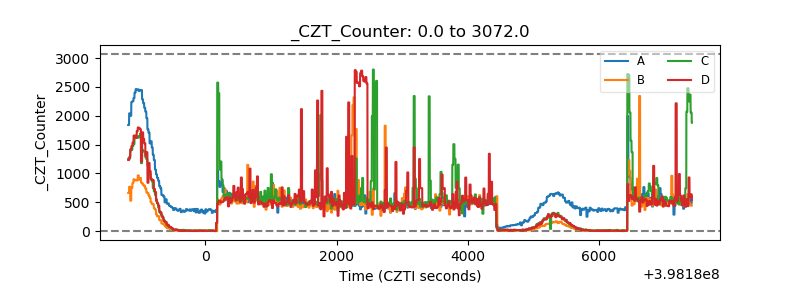 |
| +2.5 Volts monitor | 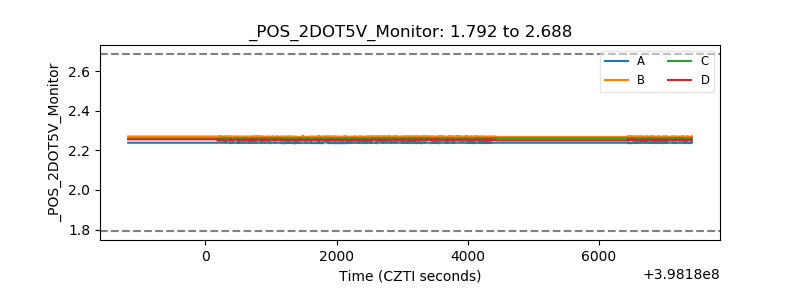 |
| +5 Volts monitor | 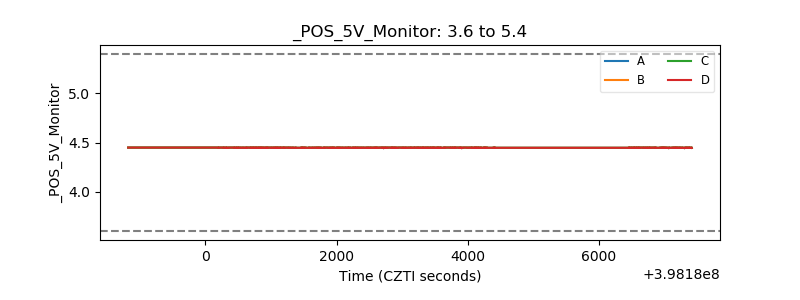 |
| _ROLL_ROT | 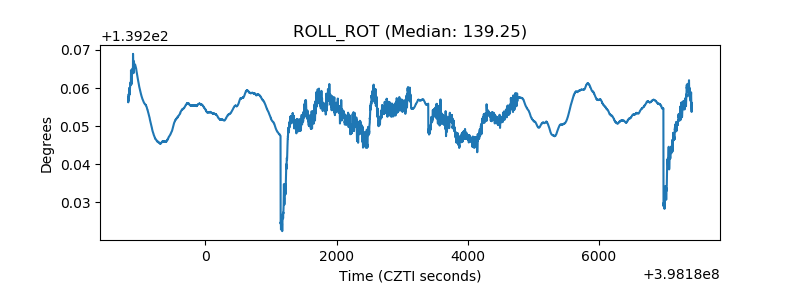 |
| _Roll_DEC | 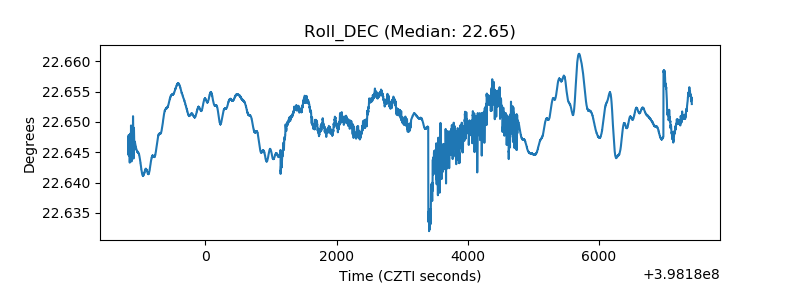 |
| _Roll_RA | 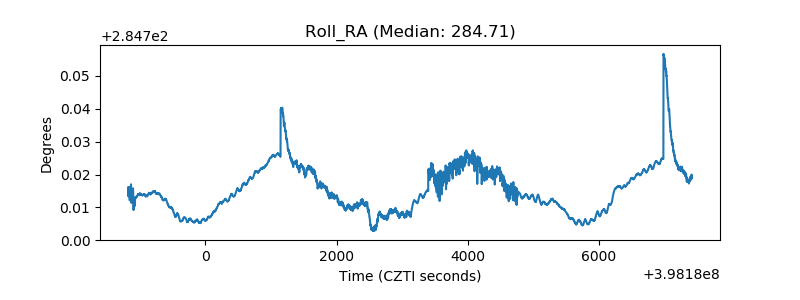 |
| Veto Counter | 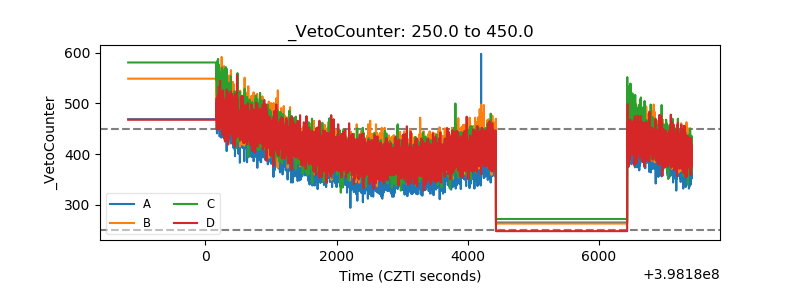 |