| Param | Original file | Final file |
|---|---|---|
| Filename | modeM0/AS1A11_079T01_9000005284_37193cztM0_level2.evt | modeM0/AS1A11_079T01_9000005284_37193cztM0_level2_quad_clean.evt |
| Size (bytes) | 692,455,680 | 70,390,080 |
| Size | 660.4 MB | 67.1 MB |
| Events in quadrant A | 3,248,141 | 446,321 |
| Events in quadrant B | 3,034,143 | 449,660 |
| Events in quadrant C | 7,639,657 | 432,528 |
| Events in quadrant D | 6,653,439 | 392,551 |
| Mode M9 | |||
|---|---|---|---|
| Quadrant | BADHDUFLAG | Total packets | Discarded packets |
| A | 0 | 18 | 0 |
| B | 0 | 18 | 0 |
| C | 0 | 18 | 0 |
| D | 0 | 19 | 0 |
| Mode SS | |||
|---|---|---|---|
| Quadrant | BADHDUFLAG | Total packets | Discarded packets |
| A | 0 | 120 | 0 |
| B | 0 | 120 | 0 |
| C | 0 | 120 | 0 |
| D | 0 | 120 | 0 |
| Mode M0 | |||
|---|---|---|---|
| Quadrant | BADHDUFLAG | Total packets | Discarded packets |
| A | 0 | 13497 | 3 |
| B | 0 | 12909 | 2 |
| C | 0 | 26570 | 2 |
| D | 0 | 23873 | 2 |
| Quadrant | Total seconds | Saturated seconds | Saturation percentage |
|---|---|---|---|
| A | 5863 | 94 | 1.603275% |
| B | 5863 | 55 | 0.938086% |
| C | 5863 | 538 | 9.176190% |
| D | 5863 | 1540 | 26.266417% |
Noise dominated data is calculated using 1-second bins in cleaned event files. If a bin has >2000 counts, and if more than 50% of those come from <1% of pixels, then it is considered to be noise-dominated and hence unusable.
| Quadrant | # 1 sec bins | Bins with >0 counts | Bins with >2000 counts | High rate bins dominated by noise | Noise dominated (total time) | Noise dominated (detector-on time) | Marked lightcurve |
|---|---|---|---|---|---|---|---|
| A | 7145 | 5864 | 69 | 69 | 0.97% | 1.18% | 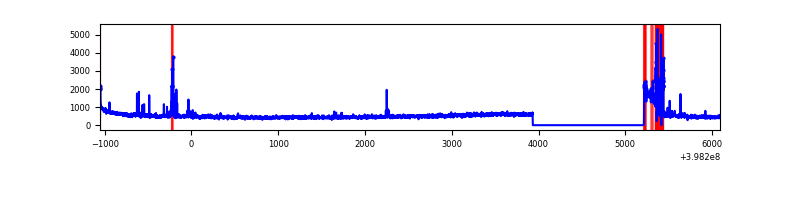 |
| B | 7145 | 5864 | 32 | 32 | 0.45% | 0.55% | 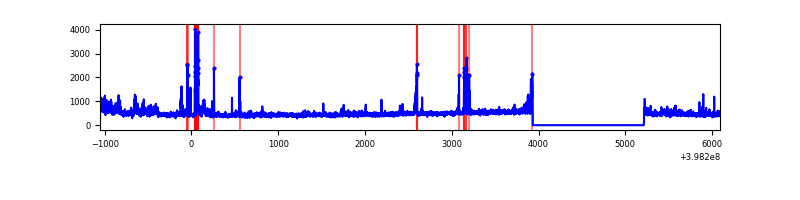 |
| C | 7145 | 5864 | 710 | 710 | 9.94% | 12.11% | 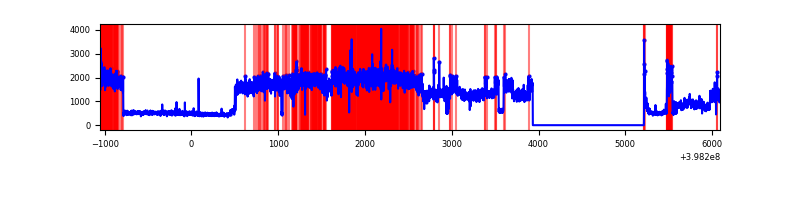 |
| D | 7145 | 5864 | 1471 | 1471 | 20.59% | 25.09% | 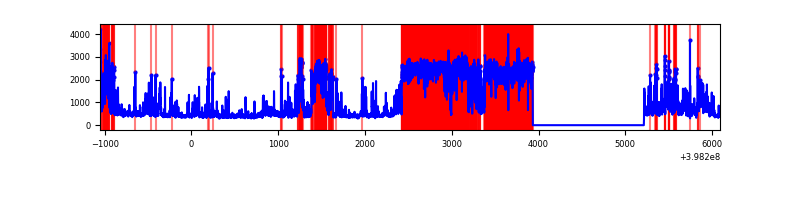 |
Top three noisy pixels from each quadrant. If the there are fewer than three noisy pixels in the level2.evt file, extra rows are filled as -1
| Pixel properties | Quadrant properties | ||||||
|---|---|---|---|---|---|---|---|
| Quadrant | DetID | PixID | Counts | Sigma | Mean | Median | Sigma |
| A | 10 | 83 | 275880 | 2059.76 | 660 | 647 | 133.6 |
| A | 15 | 237 | 272811 | 2036.8 | 660 | 647 | 133.6 |
| A | 13 | 6 | 96983 | 720.95 | 660 | 647 | 133.6 |
| B | 5 | 172 | 103755 | 810.97 | 656 | 638 | 127.2 |
| B | 0 | 229 | 80170 | 625.49 | 656 | 638 | 127.2 |
| B | 0 | 155 | 67832 | 528.45 | 656 | 638 | 127.2 |
| C | 10 | 49 | 4714331 | 31690.11 | 637 | 642 | 148.7 |
| C | 15 | 214 | 247703 | 1660.99 | 637 | 642 | 148.7 |
| C | 14 | 254 | 101047 | 675.02 | 637 | 642 | 148.7 |
| D | 10 | 253 | 3726849 | 26283.51 | 580 | 565 | 141.8 |
| D | 13 | 249 | 176712 | 1242.46 | 580 | 565 | 141.8 |
| D | 2 | 249 | 138891 | 975.69 | 580 | 565 | 141.8 |
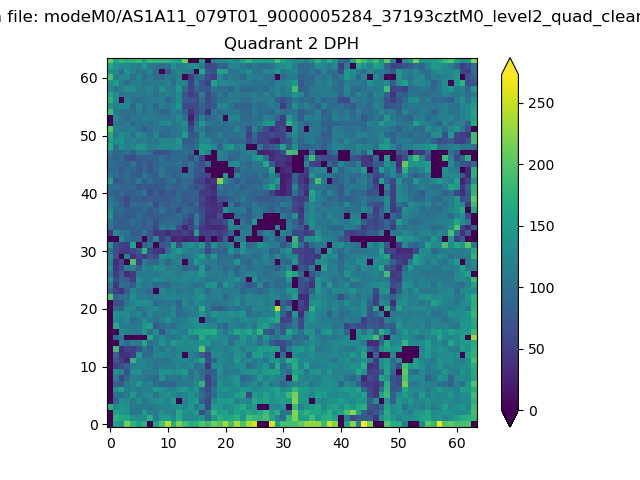
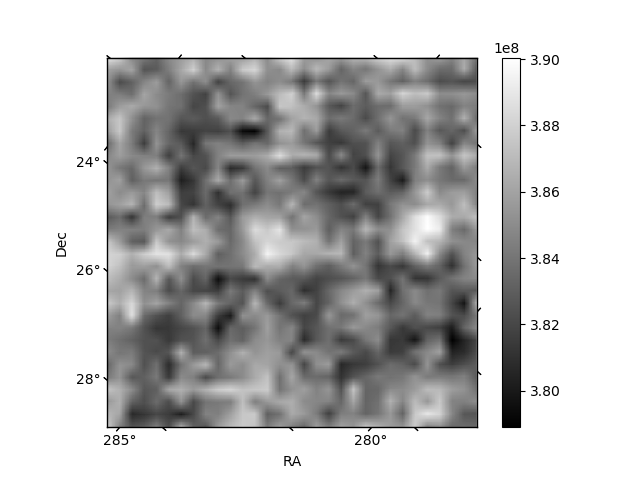
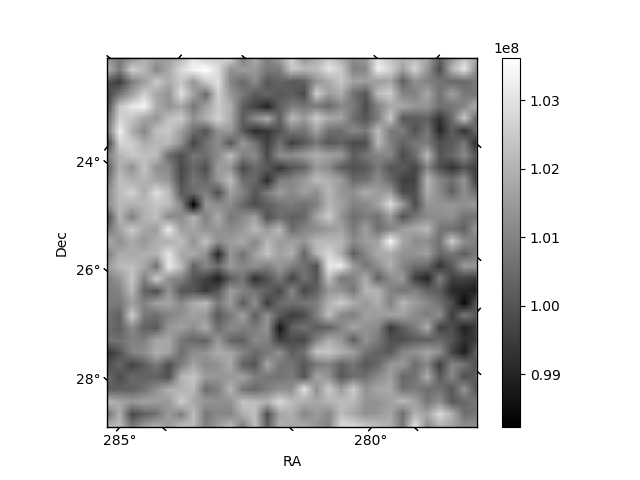
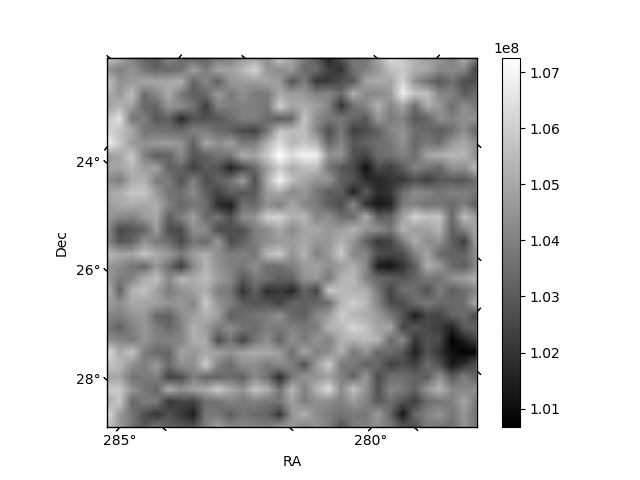
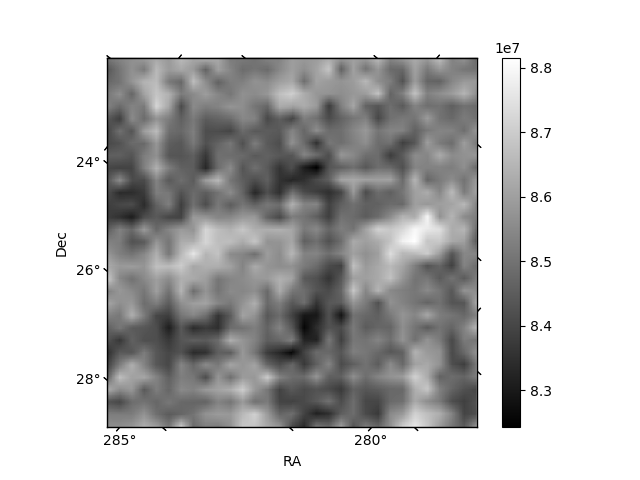
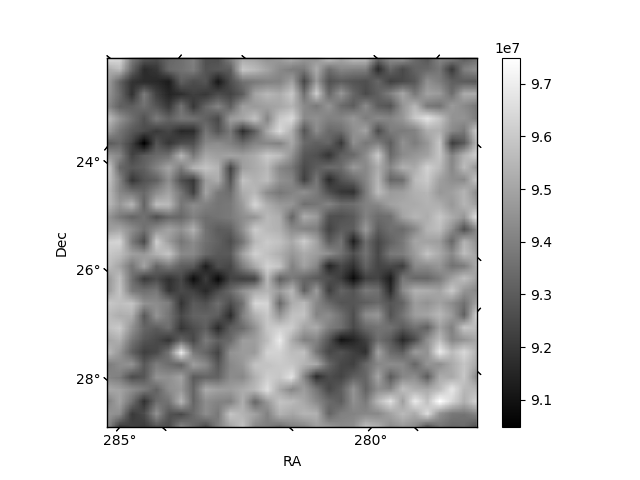
Histogram calculated using DETX and DETY for each event in the final _common_clean file
| Quadrant A | 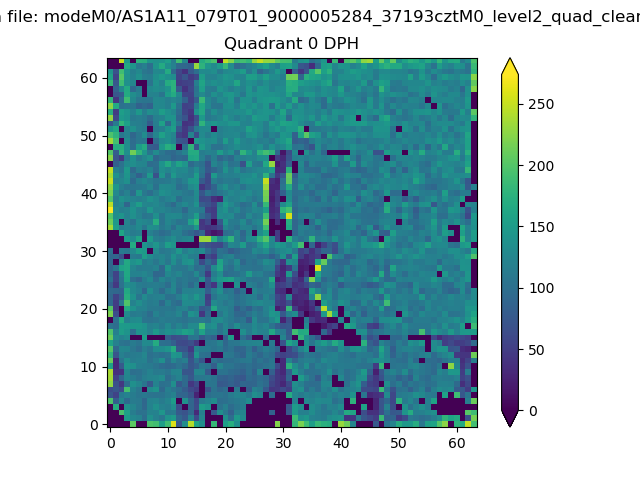 |
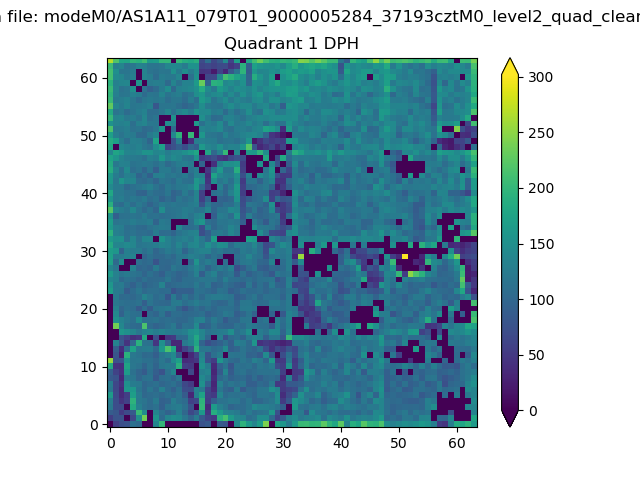 |
Quadrant B |
|---|---|---|---|
| Quadrant D | 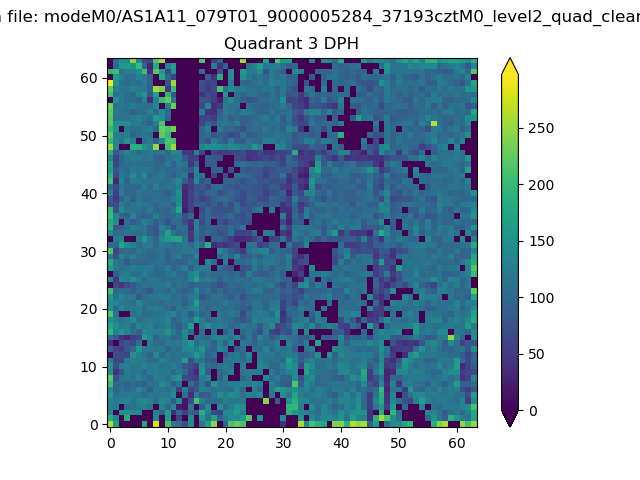 |
 |
Quadrant C |
| Plot type | Count rate plots | Images |
|---|---|---|
| Comparison with Poisson distribution Blue bars denote a histogram of data divided into 1 sec bins. Red curve is a Poisson curve with rate = median count rate of data. |
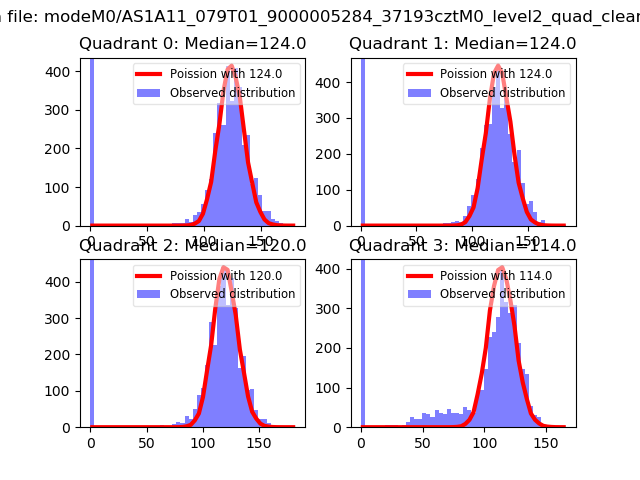 |
 |
| Quadrant-wise count rates Data is divided into 100 sec bins |
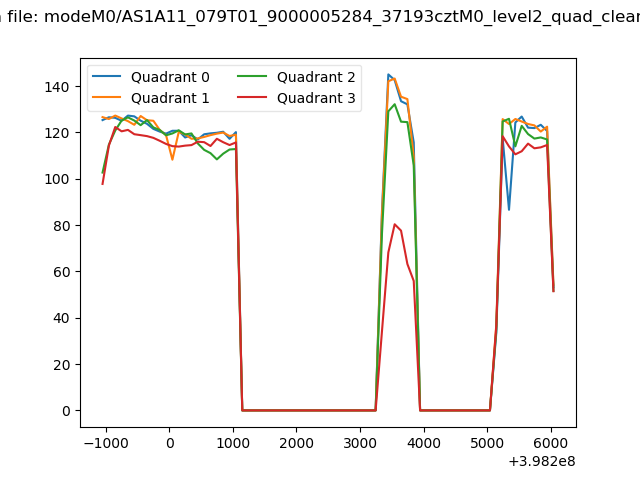 |
|
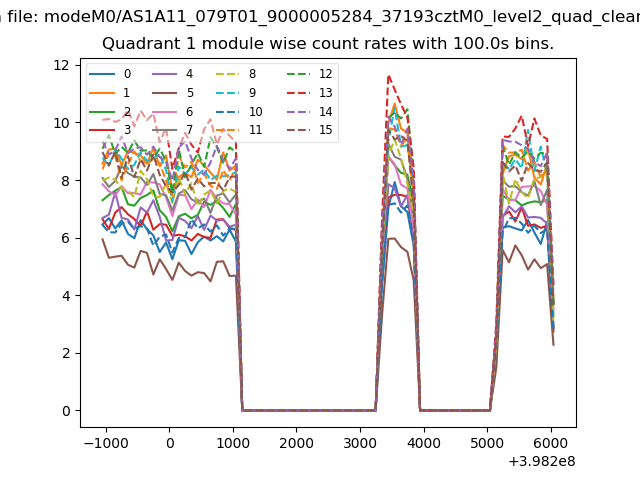
| Module-wise count rates for Quadrant A Data is divided into 100 sec bins |
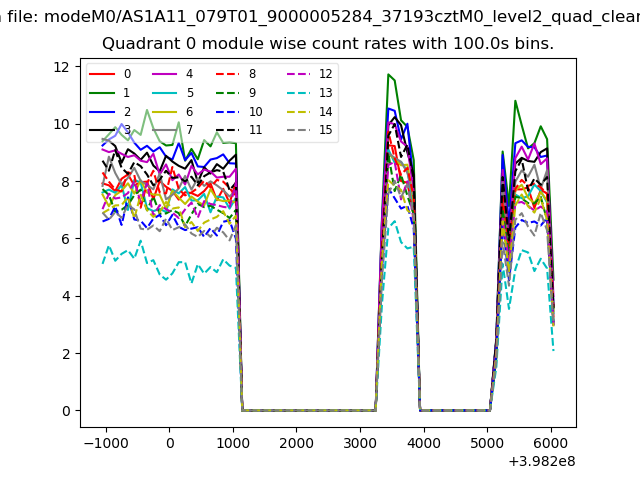 |
 |
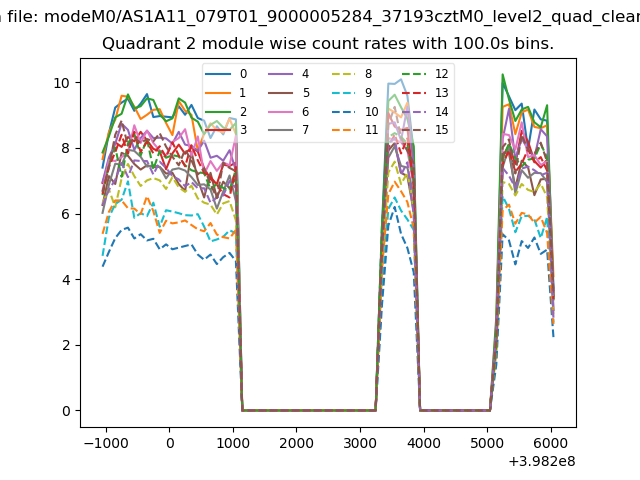
| Module-wise count rates for Quadrant B Data is divided into 100 sec bins |
 |
 |
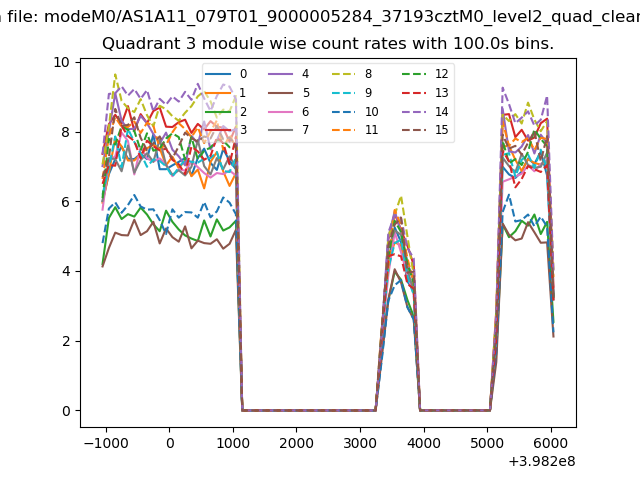
| Module-wise count rates for Quadrant C Data is divided into 100 sec bins |
 |
 |
| Module-wise count rates for Quadrant D Data is divided into 100 sec bins |
 |
 |
| Parameter | Plot |
|---|---|
| CZT HV Monitor | 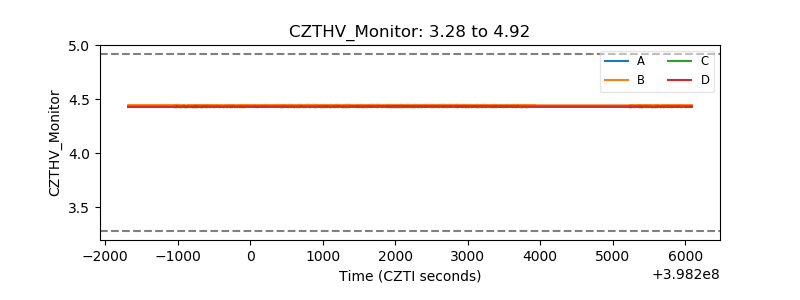 |
| D_VDD | 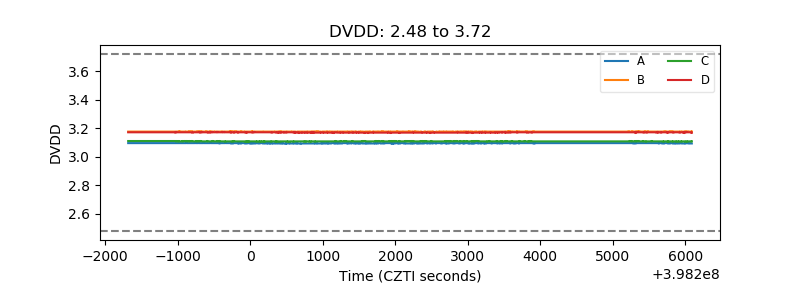 |
| Temperature 1 | 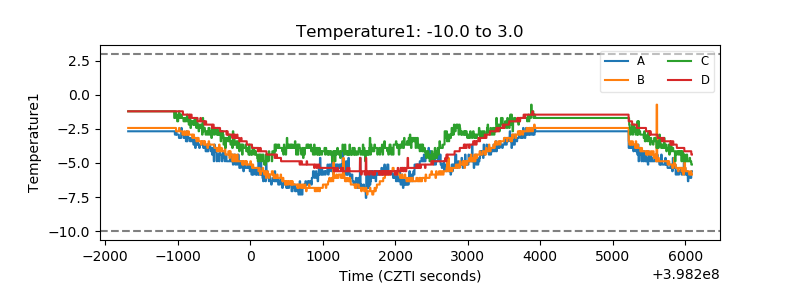 |
| Veto HV Monitor | 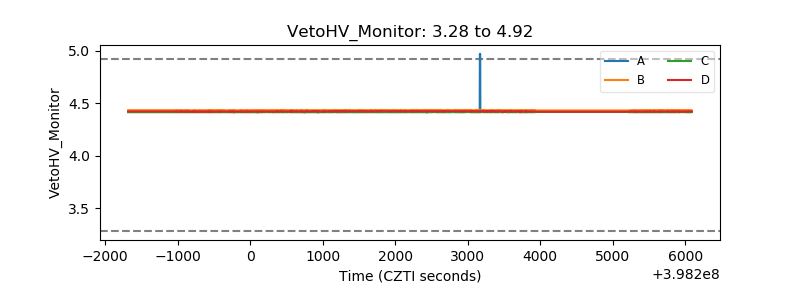 |
| Veto LLD | 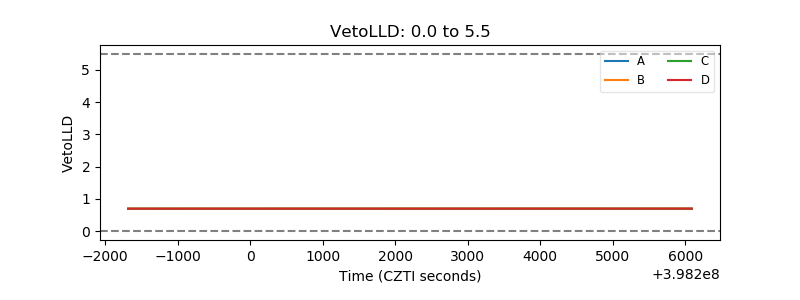 |
| Alpha Counter | 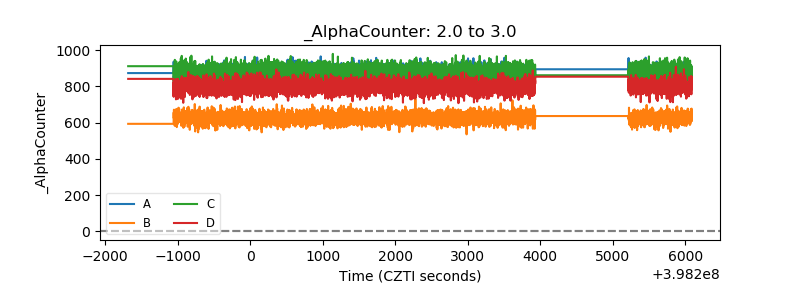 |
| _CPM_Rate | 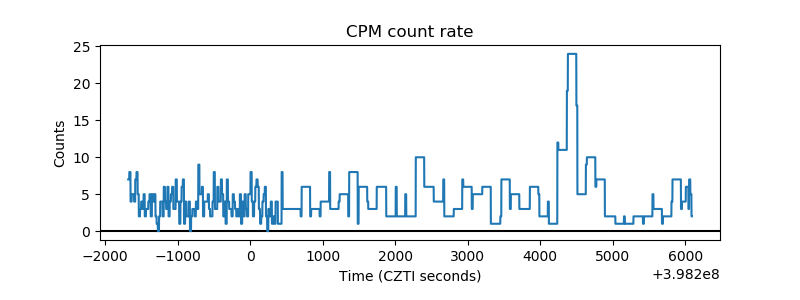 |
| CZT Counter | 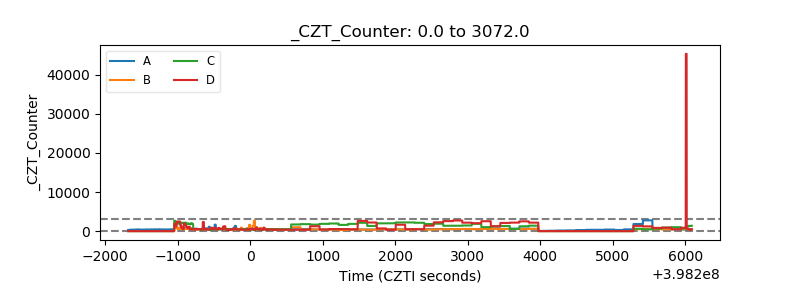 |
| +2.5 Volts monitor | 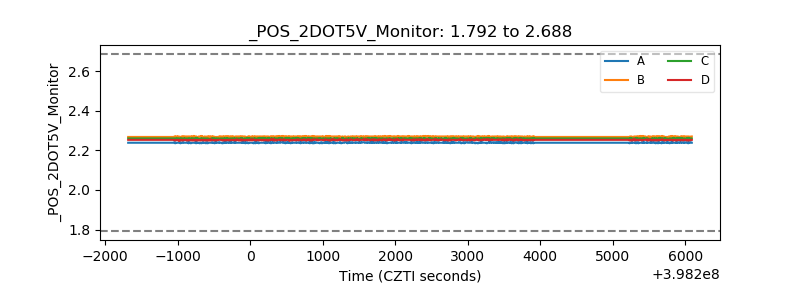 |
| +5 Volts monitor | 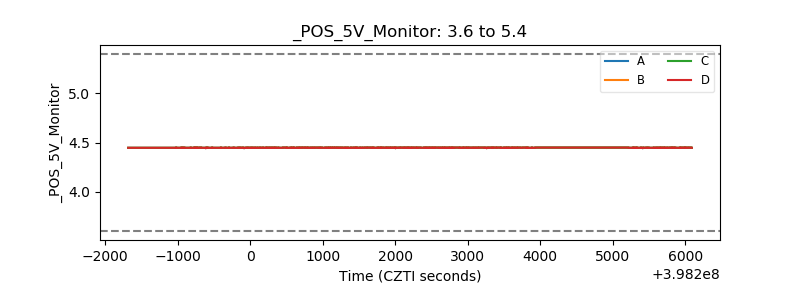 |
| _ROLL_ROT | 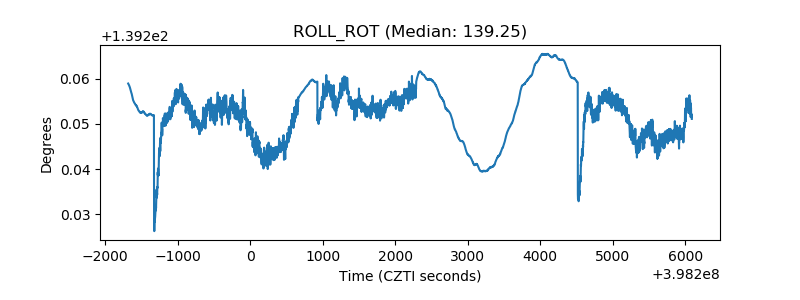 |
| _Roll_DEC | 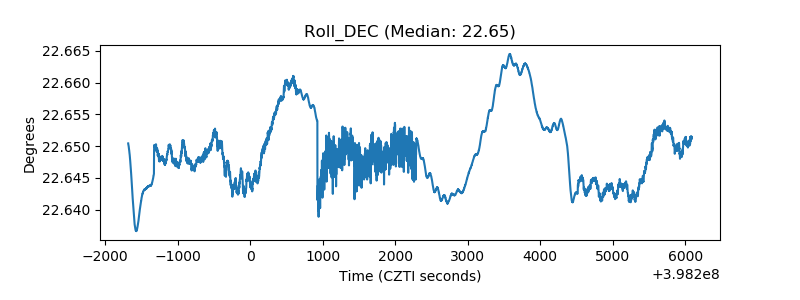 |
| _Roll_RA | 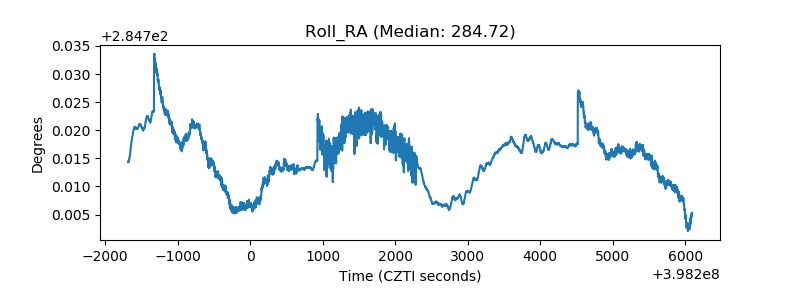 |
| Veto Counter | 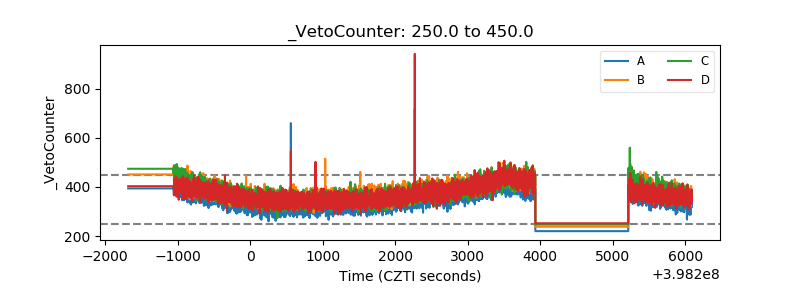 |